Denmark Umbilical Cable Market (2026-2032) | Strategic Insights, Industry, Segmentation, Competition, Drivers, Analysis, Trends, Outlook, Revenue, Competitive, Size, Value, Demand, Segments, Strategy, Opportunities, Forecast, Supply, Companies, Challenges, Pricing Analysis, Restraints, Share, Growth, Investment Trends, Consumer Insights
Market Forecast By Type (Power Transmission, Control and Monitoring, Communication, Chemical Injection), By Component (Electrical Cables, Optical Fiber Cables, Hydraulic Hoses, Umbilical Terminations), By Application (Offshore Oil and Gas, Subsea Production, Renewable Energy, Defense and Marine), By Material (Thermoplastic, Thermoset, Composite, Metal), By End Use (Professional Tattooing, Tattoo Studios) And Competitive Landscape
| Product Code: ETC11238488 | Publication Date: Apr 2025 | Updated Date: Apr 2026 | Product Type: Market Research Report | |
| Publisher: 6Wresearch | Author: Bhawna Singh | No. of Pages: 65 | No. of Figures: 34 | No. of Tables: 19 |
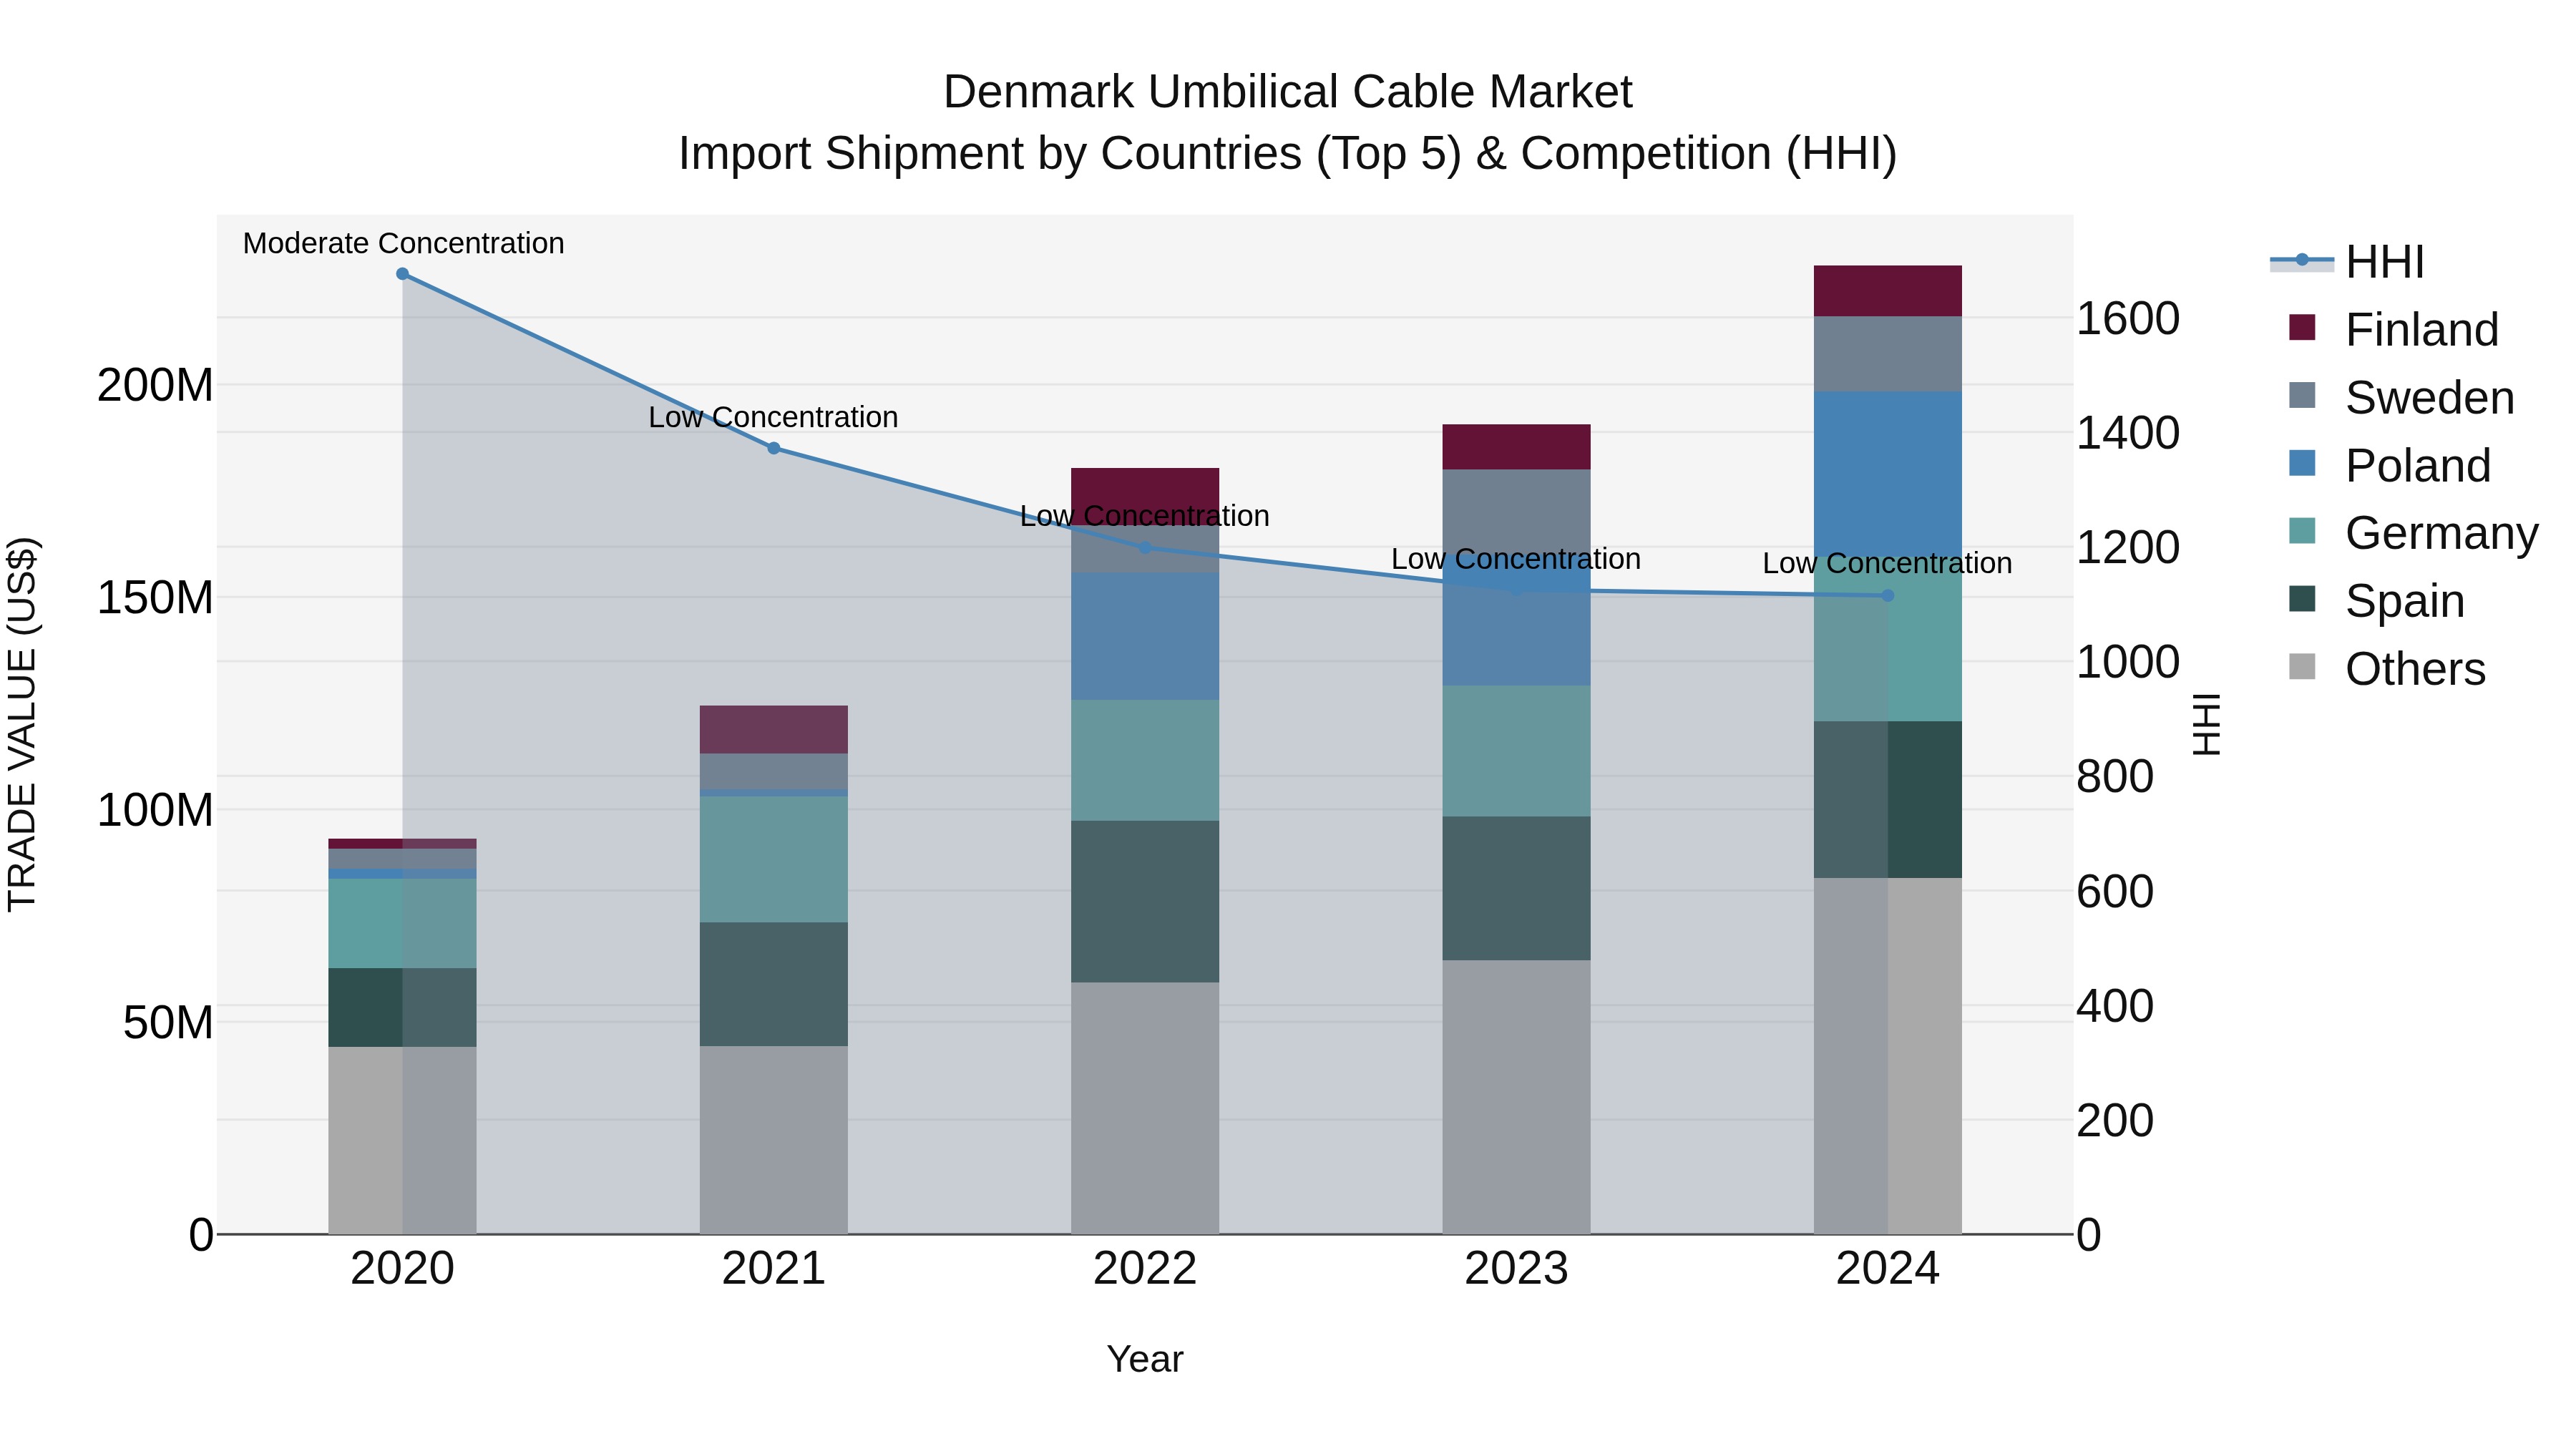
Denmark Umbilical Cable Market Top 5 Importing Countries and Market Competition (HHI) Analysis
Denmark umbilical cable import market in 2024 continues to see diverse sourcing, with top exporting countries including Poland, Germany, Spain, Greece, and Sweden. The market maintains low concentration levels, indicating a competitive landscape. The impressive compound annual growth rate (CAGR) of 25.1% during 2020-24 highlights the increasing demand for umbilical cables in Denmark. Moreover, the strong growth rate of 19.55% from 2023 to 2024 suggests a sustained momentum in the market, presenting opportunities for both domestic and international players to capitalize on this upward trend.
Key Highlights of the Report:
- Denmark Umbilical Cable Market Outlook
- Market Size of Denmark Umbilical Cable Market, 2025
- Forecast of Denmark Umbilical Cable Market, 2032
- Historical Data and Forecast of Denmark Umbilical Cable Revenues & Volume for the Period 2022 - 2032F
- Denmark Umbilical Cable Market Trend Evolution
- Denmark Umbilical Cable Market Drivers and Challenges
- Denmark Umbilical Cable Price Trends
- Denmark Umbilical Cable Porter's Five Forces
- Denmark Umbilical Cable Industry Life Cycle
- Historical Data and Forecast of Denmark Umbilical Cable Market Revenues & Volume By Type for the Period 2022 - 2032F
- Historical Data and Forecast of Denmark Umbilical Cable Market Revenues & Volume By Power Transmission for the Period 2022 - 2032F
- Historical Data and Forecast of Denmark Umbilical Cable Market Revenues & Volume By Control and Monitoring for the Period 2022 - 2032F
- Historical Data and Forecast of Denmark Umbilical Cable Market Revenues & Volume By Communication for the Period 2022 - 2032F
- Historical Data and Forecast of Denmark Umbilical Cable Market Revenues & Volume By Chemical Injection for the Period 2022 - 2032F
- Historical Data and Forecast of Denmark Umbilical Cable Market Revenues & Volume By Component for the Period 2022 - 2032F
- Historical Data and Forecast of Denmark Umbilical Cable Market Revenues & Volume By Electrical Cables for the Period 2022 - 2032F
- Historical Data and Forecast of Denmark Umbilical Cable Market Revenues & Volume By Optical Fiber Cables for the Period 2022 - 2032F
- Historical Data and Forecast of Denmark Umbilical Cable Market Revenues & Volume By Hydraulic Hoses for the Period 2022 - 2032F
- Historical Data and Forecast of Denmark Umbilical Cable Market Revenues & Volume By Umbilical Terminations for the Period 2022 - 2032F
- Historical Data and Forecast of Denmark Umbilical Cable Market Revenues & Volume By Application for the Period 2022 - 2032F
- Historical Data and Forecast of Denmark Umbilical Cable Market Revenues & Volume By Offshore Oil and Gas for the Period 2022 - 2032F
- Historical Data and Forecast of Denmark Umbilical Cable Market Revenues & Volume By Subsea Production for the Period 2022 - 2032F
- Historical Data and Forecast of Denmark Umbilical Cable Market Revenues & Volume By Renewable Energy for the Period 2022 - 2032F
- Historical Data and Forecast of Denmark Umbilical Cable Market Revenues & Volume By Defense and Marine for the Period 2022 - 2032F
- Historical Data and Forecast of Denmark Umbilical Cable Market Revenues & Volume By Material for the Period 2022 - 2032F
- Historical Data and Forecast of Denmark Umbilical Cable Market Revenues & Volume By Thermoplastic for the Period 2022 - 2032F
- Historical Data and Forecast of Denmark Umbilical Cable Market Revenues & Volume By Thermoset for the Period 2022 - 2032F
- Historical Data and Forecast of Denmark Umbilical Cable Market Revenues & Volume By Composite for the Period 2022 - 2032F
- Historical Data and Forecast of Denmark Umbilical Cable Market Revenues & Volume By Metal for the Period 2022 - 2032F
- Historical Data and Forecast of Denmark Umbilical Cable Market Revenues & Volume By End Use for the Period 2022 - 2032F
- Historical Data and Forecast of Denmark Umbilical Cable Market Revenues & Volume By Professional Tattooing for the Period 2022 - 2032F
- Historical Data and Forecast of Denmark Umbilical Cable Market Revenues & Volume By Tattoo Studios for the Period 2022 - 2032F
- Denmark Umbilical Cable Import Export Trade Statistics
- Market Opportunity Assessment By Type
- Market Opportunity Assessment By Component
- Market Opportunity Assessment By Application
- Market Opportunity Assessment By Material
- Market Opportunity Assessment By End Use
- Denmark Umbilical Cable Top Companies Market Share
- Denmark Umbilical Cable Competitive Benchmarking By Technical and Operational Parameters
- Denmark Umbilical Cable Company Profiles
- Denmark Umbilical Cable Key Strategic Recommendations
Frequently Asked Questions About the Market Study (FAQs):
6Wresearch actively monitors the Denmark Umbilical Cable Market and publishes its comprehensive annual report, highlighting emerging trends, growth drivers, revenue analysis, and forecast outlook. Our insights help businesses to make data-backed strategic decisions with ongoing market dynamics. Our analysts track relevent industries related to the Denmark Umbilical Cable Market, allowing our clients with actionable intelligence and reliable forecasts tailored to emerging regional needs.
Yes, we provide customisation as per your requirements. To learn more, feel free to contact us on sales@6wresearch.com
1 Executive Summary |
2 Introduction |
2.1 Key Highlights of the Report |
2.2 Report Description |
2.3 Market Scope & Segmentation |
2.4 Research Methodology |
2.5 Assumptions |
3 Denmark Umbilical Cable Market Overview |
3.1 Denmark Country Macro Economic Indicators |
3.2 Denmark Umbilical Cable Market Revenues & Volume, 2022 & 2032F |
3.3 Denmark Umbilical Cable Market - Industry Life Cycle |
3.4 Denmark Umbilical Cable Market - Porter's Five Forces |
3.5 Denmark Umbilical Cable Market Revenues & Volume Share, By Type, 2022 & 2032F |
3.6 Denmark Umbilical Cable Market Revenues & Volume Share, By Component, 2022 & 2032F |
3.7 Denmark Umbilical Cable Market Revenues & Volume Share, By Application, 2022 & 2032F |
3.8 Denmark Umbilical Cable Market Revenues & Volume Share, By Material, 2022 & 2032F |
4 Denmark Umbilical Cable Market Dynamics |
4.1 Impact Analysis |
4.2 Market Drivers |
4.2.1 Increasing demand for renewable energy sources in Denmark, leading to higher investments in offshore wind farms. |
4.2.2 Technological advancements in umbilical cable materials and manufacturing processes, improving efficiency and durability. |
4.2.3 Government initiatives and regulations promoting sustainable energy solutions, driving the demand for umbilical cables in the renewable energy sector. |
4.3 Market Restraints |
4.3.1 Fluctuating raw material prices impacting the overall cost of production for umbilical cables. |
4.3.2 Intense competition among key market players leading to pricing pressures and margin erosion. |
4.3.3 Challenges related to project delays and regulatory hurdles in offshore wind farm developments affecting the demand for umbilical cables. |
5 Denmark Umbilical Cable Market Trends |
6 Denmark Umbilical Cable Market, By Types |
6.1 Denmark Umbilical Cable Market, By Type |
6.1.1 Overview and Analysis |
6.1.2 Denmark Umbilical Cable Market Revenues & Volume, By Type, 2022 - 2032F |
6.1.3 Denmark Umbilical Cable Market Revenues & Volume, By Power Transmission, 2022 - 2032F |
6.1.4 Denmark Umbilical Cable Market Revenues & Volume, By Control and Monitoring, 2022 - 2032F |
6.1.5 Denmark Umbilical Cable Market Revenues & Volume, By Communication, 2022 - 2032F |
6.1.6 Denmark Umbilical Cable Market Revenues & Volume, By Chemical Injection, 2022 - 2032F |
6.2 Denmark Umbilical Cable Market, By Component |
6.2.1 Overview and Analysis |
6.2.2 Denmark Umbilical Cable Market Revenues & Volume, By Electrical Cables, 2022 - 2032F |
6.2.3 Denmark Umbilical Cable Market Revenues & Volume, By Optical Fiber Cables, 2022 - 2032F |
6.2.4 Denmark Umbilical Cable Market Revenues & Volume, By Hydraulic Hoses, 2022 - 2032F |
6.2.5 Denmark Umbilical Cable Market Revenues & Volume, By Umbilical Terminations, 2022 - 2032F |
6.3 Denmark Umbilical Cable Market, By Application |
6.3.1 Overview and Analysis |
6.3.2 Denmark Umbilical Cable Market Revenues & Volume, By Offshore Oil and Gas, 2022 - 2032F |
6.3.3 Denmark Umbilical Cable Market Revenues & Volume, By Subsea Production, 2022 - 2032F |
6.3.4 Denmark Umbilical Cable Market Revenues & Volume, By Renewable Energy, 2022 - 2032F |
6.3.5 Denmark Umbilical Cable Market Revenues & Volume, By Defense and Marine, 2022 - 2032F |
6.4 Denmark Umbilical Cable Market, By Material |
6.4.1 Overview and Analysis |
6.4.2 Denmark Umbilical Cable Market Revenues & Volume, By Thermoplastic, 2022 - 2032F |
6.4.3 Denmark Umbilical Cable Market Revenues & Volume, By Thermoset, 2022 - 2032F |
6.4.4 Denmark Umbilical Cable Market Revenues & Volume, By Composite, 2022 - 2032F |
6.4.5 Denmark Umbilical Cable Market Revenues & Volume, By Metal, 2022 - 2032F |
7 Denmark Umbilical Cable Market Import-Export Trade Statistics |
7.1 Denmark Umbilical Cable Market Export to Major Countries |
7.2 Denmark Umbilical Cable Market Imports from Major Countries |
8 Denmark Umbilical Cable Market Key Performance Indicators |
8.1 Average installation time for umbilical cables in offshore wind farms. |
8.2 Percentage of umbilical cable failures during operation. |
8.3 Percentage of revenue invested in research and development for umbilical cable technology improvements. |
9 Denmark Umbilical Cable Market - Opportunity Assessment |
9.1 Denmark Umbilical Cable Market Opportunity Assessment, By Type, 2022 & 2032F |
9.2 Denmark Umbilical Cable Market Opportunity Assessment, By Component, 2022 & 2032F |
9.3 Denmark Umbilical Cable Market Opportunity Assessment, By Application, 2022 & 2032F |
9.4 Denmark Umbilical Cable Market Opportunity Assessment, By Material, 2022 & 2032F |
10 Denmark Umbilical Cable Market - Competitive Landscape |
10.1 Denmark Umbilical Cable Market Revenue Share, By Companies, 2025 |
10.2 Denmark Umbilical Cable Market Competitive Benchmarking, By Operating and Technical Parameters |
11 Company Profiles |
12 Recommendations |
13 Disclaimer |
Global Go To Market Strategy - 2030
Export potential enables firms to identify high-growth global markets with greater confidence by combining advanced trade intelligence with a structured quantitative methodology. The framework analyzes emerging demand trends and country-level import patterns while integrating macroeconomic and trade datasets such as GDP and population forecasts, bilateral import–export flows, tariff structures, elasticity differentials between developed and developing economies, geographic distance, and import demand projections. Using weighted trade values from 2020–2024 as the base period to project country-to-country export potential for 2030, these inputs are operationalized through calculated drivers such as gravity model parameters, tariff impact factors, and projected GDP per-capita growth. Through an analysis of hidden potentials, demand hotspots, and market conditions that are most favorable to success, this method enables firms to focus on target countries, maximize returns, and global expansion with data, backed by accuracy.
By factoring in the projected importer demand gap that is currently unmet and could be potential opportunity, it identifies the potential for the Exporter (Country) among 190 countries, against the general trade analysis, which identifies the biggest importer or exporter.
To discover high-growth global markets and optimize your business strategy:
Click Here
Pricing
- Single User License$ 1,995
- Department License$ 2,400
- Site License$ 3,120
- Global License$ 3,795

Leadership Perspectives from Industry Events
Search
Thought Leadership and Analyst Meet


Our Clients
6WResearch In News
- Doha a strategic location for EV manufacturing hub: IPA Qatar
- Demand for luxury TVs surging in the GCC, says Samsung
- Empowering Growth: The Thriving Journey of Bangladesh’s Cable Industry
- Demand for luxury TVs surging in the GCC, says Samsung
- Video call with a traditional healer? Once unthinkable, it’s now common in South Africa
- Intelligent Buildings To Smooth GCC’s Path To Net Zero
Latest Reports
- Taiwan Airport Wireless Infrastructure Market (2026-2032)
- Vietnam Airport Wireless Infrastructure Market (2026-2032)
- Thailand Airport Wireless Infrastructure Market (2026-2032)
- South Korea Airport Wireless Infrastructure Market (2026-2032)
- Romania Airport Wireless Infrastructure Market (2026-2032)
- Qatar Airport Wireless Infrastructure Market (2026-2032)
- Philippines Airport Wireless Infrastructure Market (2026-2032)
- Japan Airport Wireless Infrastructure Market (2026-2032)
- Taiwan Airport Winter Services Market (2026-2032)
- Vietnam Airport Winter Services Market (2026-2032)
Industry Events and Analyst Meet

HIMTEX 2026

India Refining Summit 2026

India EV Show 2026

EV tech India Expo 2026

Auto Tech Asia 2026
Whitepaper
- Middle East & Africa Commercial Security Market Click here to view more.
- Middle East & Africa Fire Safety Systems & Equipment Market Click here to view more.
- GCC Drone Market Click here to view more.
- Middle East Lighting Fixture Market Click here to view more.
- GCC Physical & Perimeter Security Market Click here to view more.