Denmark Wire Marking Labels Market (2026-2032) | Value, Opportunities, Share, Competitive, Segmentation, Drivers, Strategy, Trends, Challenges, Segments, Strategic Insights, Forecast, Supply, Investment Trends, Size, Industry, Growth, Outlook, Companies, Revenue, Competition, Consumer Insights, Restraints, Pricing Analysis, Analysis, Demand
Market Forecast By Product Type (Self-Laminating Labels, Heat Shrink Labels, Adhesive Labels, Clip-On Labels), By Material Type (Polyester, PVC, Paper, Rubber), By Distribution Channel (Online Platforms, Specialty Stores, Industrial Suppliers, Direct Sales), By End User (Electronics Industry, Aerospace Industry, Telecom Industry, Power Utilities), By End Use (Professional Tattooing, Tattoo Studios) And Competitive Landscape
| Product Code: ETC11327768 | Publication Date: Apr 2025 | Updated Date: Apr 2026 | Product Type: Market Research Report | |
| Publisher: 6Wresearch | Author: Bhawna Singh | No. of Pages: 65 | No. of Figures: 34 | No. of Tables: 19 |
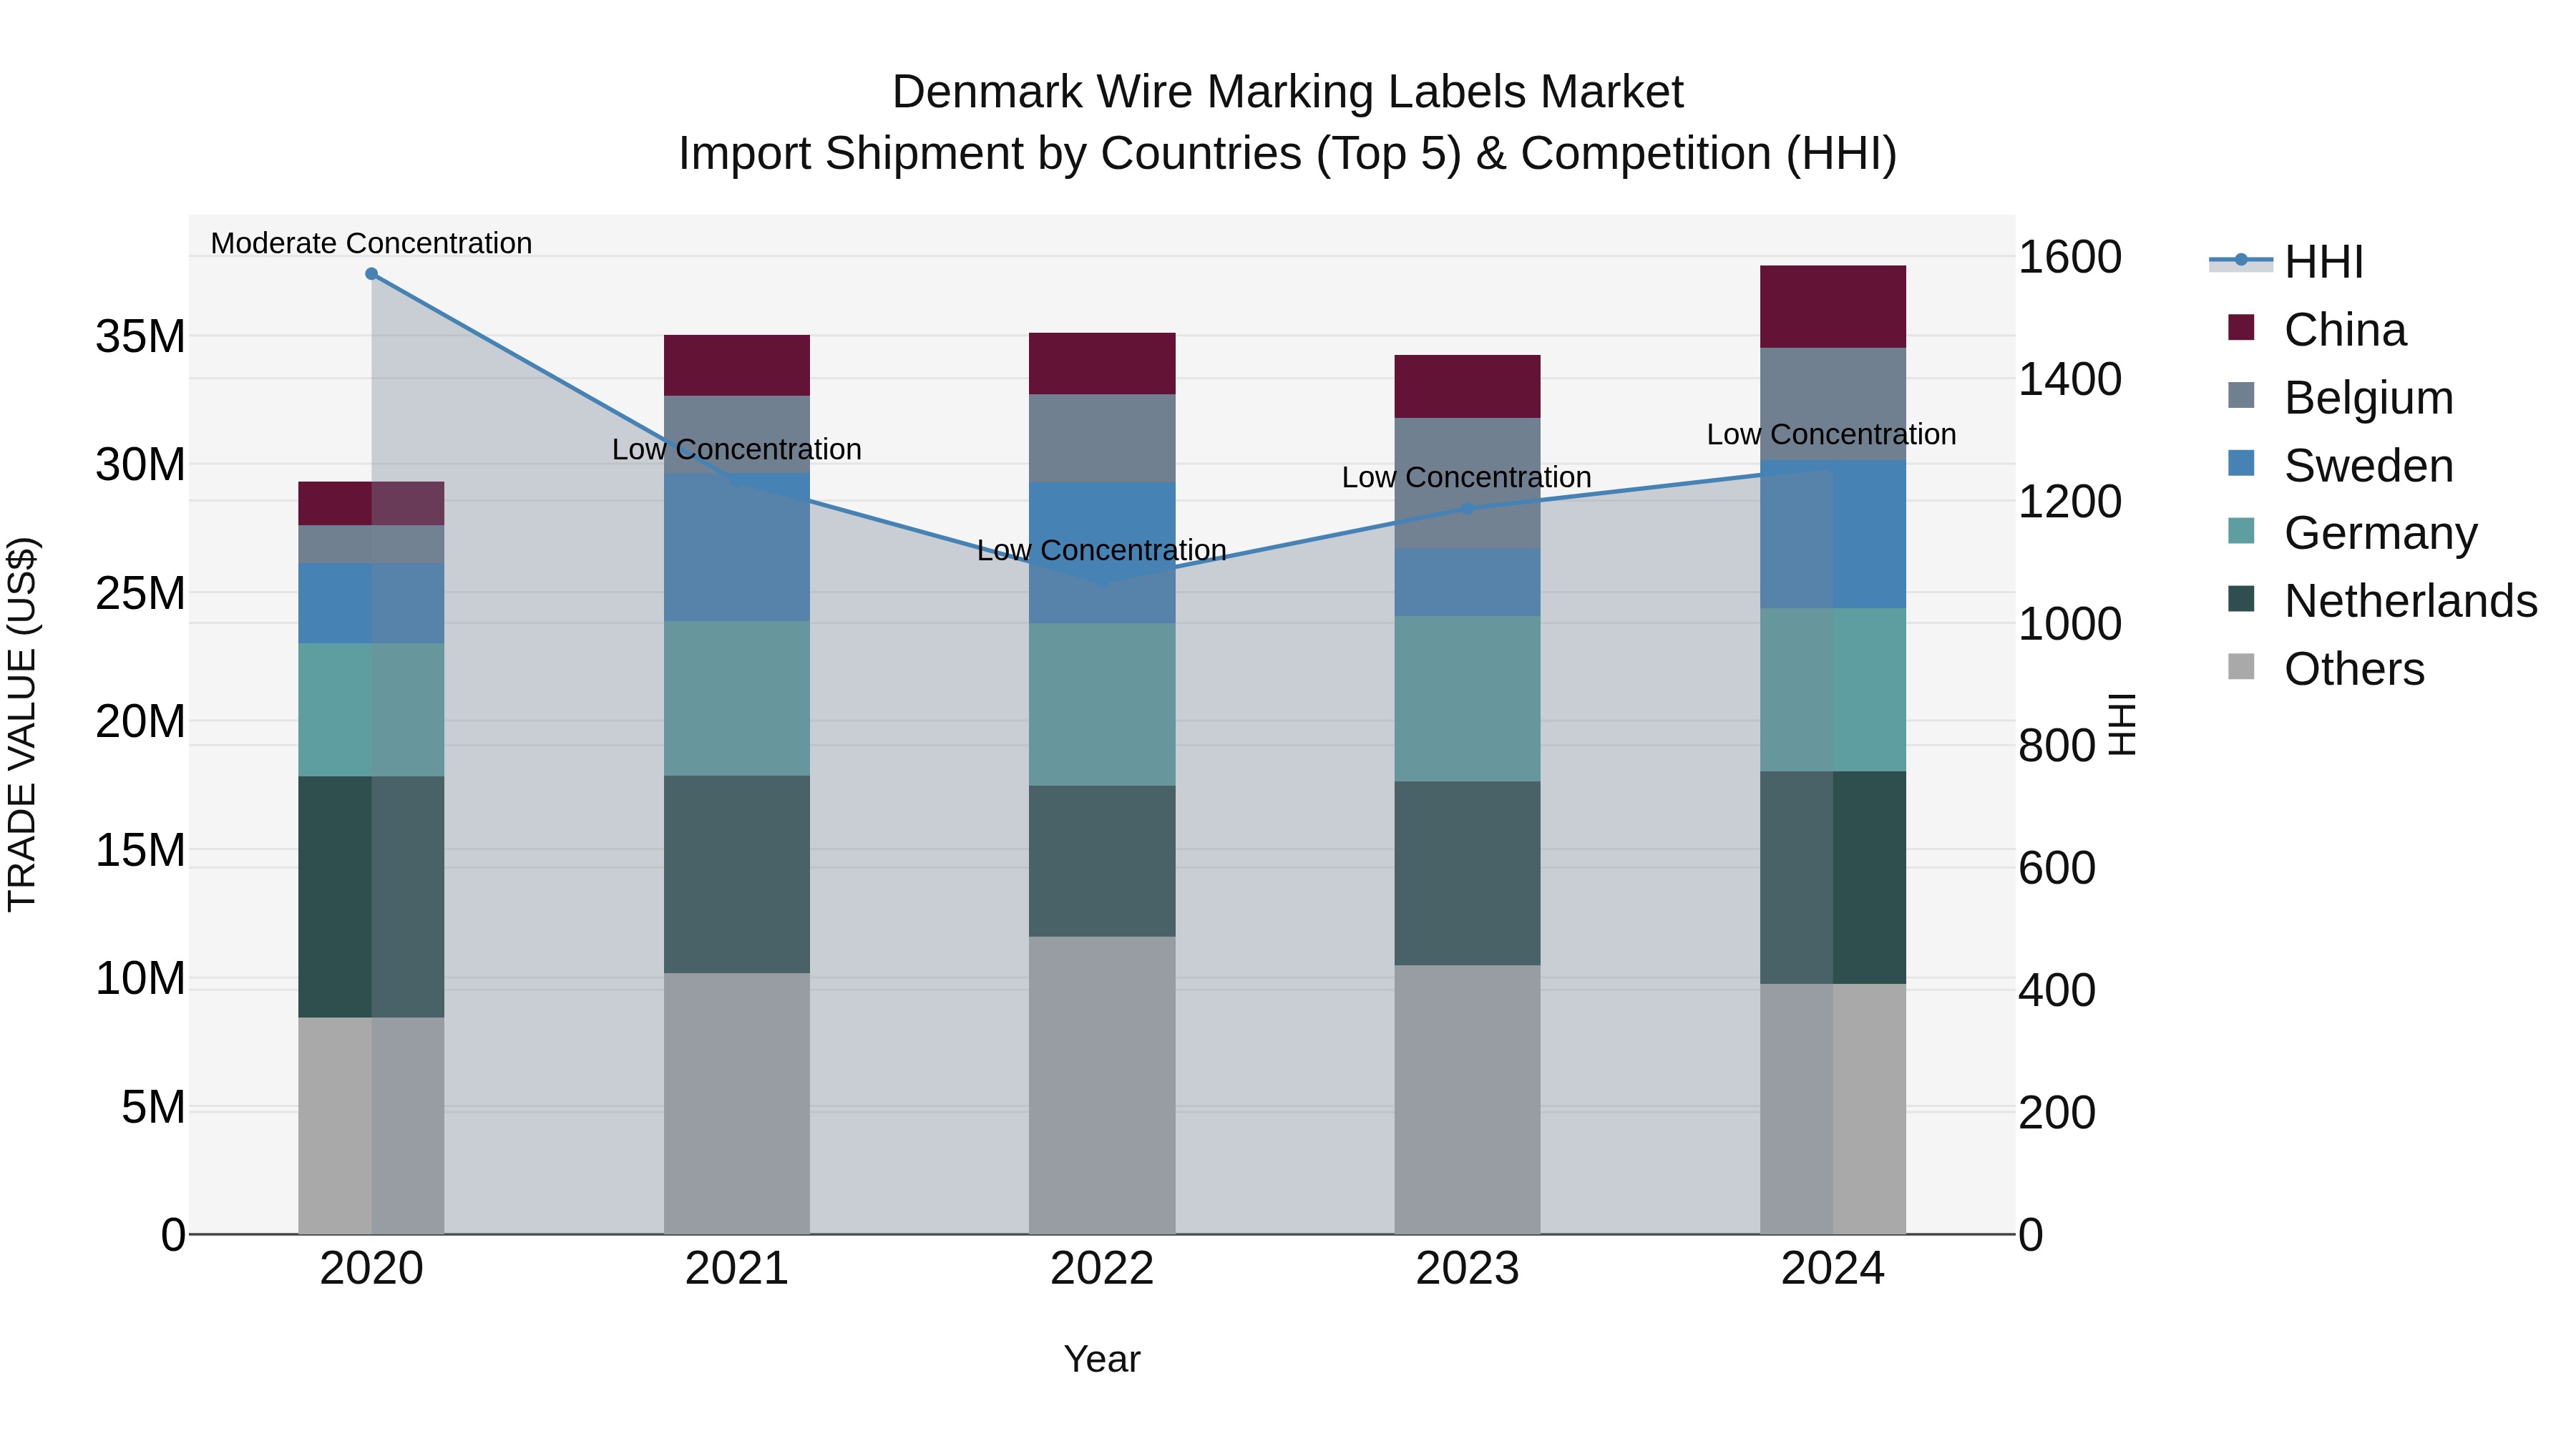
Denmark Wire Marking Labels Market Top 5 Importing Countries and Market Competition (HHI) Analysis
Denmark wire marking labels import market in 2024 saw consistent growth, with key suppliers from the Netherlands, Germany, Sweden, Belgium, and China. The market remained competitive with low concentration levels indicated by the HHI. The compound annual growth rate (CAGR) from 2020 to 2024 was a healthy 6.52%, showing sustained expansion. Notably, the growth rate spiked in 2024, reaching 10.11%, indicating a potential surge in demand or new market dynamics influencing the wire marking labels sector.
Key Highlights of the Report:
- Denmark Wire Marking Labels Market Outlook
- Market Size of Denmark Wire Marking Labels Market, 2025
- Forecast of Denmark Wire Marking Labels Market, 2032
- Historical Data and Forecast of Denmark Wire Marking Labels Revenues & Volume for the Period 2022 - 2032F
- Denmark Wire Marking Labels Market Trend Evolution
- Denmark Wire Marking Labels Market Drivers and Challenges
- Denmark Wire Marking Labels Price Trends
- Denmark Wire Marking Labels Porter's Five Forces
- Denmark Wire Marking Labels Industry Life Cycle
- Historical Data and Forecast of Denmark Wire Marking Labels Market Revenues & Volume By Product Type for the Period 2022 - 2032F
- Historical Data and Forecast of Denmark Wire Marking Labels Market Revenues & Volume By Self-Laminating Labels for the Period 2022 - 2032F
- Historical Data and Forecast of Denmark Wire Marking Labels Market Revenues & Volume By Heat Shrink Labels for the Period 2022 - 2032F
- Historical Data and Forecast of Denmark Wire Marking Labels Market Revenues & Volume By Adhesive Labels for the Period 2022 - 2032F
- Historical Data and Forecast of Denmark Wire Marking Labels Market Revenues & Volume By Clip-On Labels for the Period 2022 - 2032F
- Historical Data and Forecast of Denmark Wire Marking Labels Market Revenues & Volume By Material Type for the Period 2022 - 2032F
- Historical Data and Forecast of Denmark Wire Marking Labels Market Revenues & Volume By Polyester for the Period 2022 - 2032F
- Historical Data and Forecast of Denmark Wire Marking Labels Market Revenues & Volume By PVC for the Period 2022 - 2032F
- Historical Data and Forecast of Denmark Wire Marking Labels Market Revenues & Volume By Paper for the Period 2022 - 2032F
- Historical Data and Forecast of Denmark Wire Marking Labels Market Revenues & Volume By Rubber for the Period 2022 - 2032F
- Historical Data and Forecast of Denmark Wire Marking Labels Market Revenues & Volume By Distribution Channel for the Period 2022 - 2032F
- Historical Data and Forecast of Denmark Wire Marking Labels Market Revenues & Volume By Online Platforms for the Period 2022 - 2032F
- Historical Data and Forecast of Denmark Wire Marking Labels Market Revenues & Volume By Specialty Stores for the Period 2022 - 2032F
- Historical Data and Forecast of Denmark Wire Marking Labels Market Revenues & Volume By Industrial Suppliers for the Period 2022 - 2032F
- Historical Data and Forecast of Denmark Wire Marking Labels Market Revenues & Volume By Direct Sales for the Period 2022 - 2032F
- Historical Data and Forecast of Denmark Wire Marking Labels Market Revenues & Volume By End User for the Period 2022 - 2032F
- Historical Data and Forecast of Denmark Wire Marking Labels Market Revenues & Volume By Electronics Industry for the Period 2022 - 2032F
- Historical Data and Forecast of Denmark Wire Marking Labels Market Revenues & Volume By Aerospace Industry for the Period 2022 - 2032F
- Historical Data and Forecast of Denmark Wire Marking Labels Market Revenues & Volume By Telecom Industry for the Period 2022 - 2032F
- Historical Data and Forecast of Denmark Wire Marking Labels Market Revenues & Volume By Power Utilities for the Period 2022 - 2032F
- Historical Data and Forecast of Denmark Wire Marking Labels Market Revenues & Volume By End Use for the Period 2022 - 2032F
- Historical Data and Forecast of Denmark Wire Marking Labels Market Revenues & Volume By Professional Tattooing for the Period 2022 - 2032F
- Historical Data and Forecast of Denmark Wire Marking Labels Market Revenues & Volume By Tattoo Studios for the Period 2022 - 2032F
- Denmark Wire Marking Labels Import Export Trade Statistics
- Market Opportunity Assessment By Product Type
- Market Opportunity Assessment By Material Type
- Market Opportunity Assessment By Distribution Channel
- Market Opportunity Assessment By End User
- Market Opportunity Assessment By End Use
- Denmark Wire Marking Labels Top Companies Market Share
- Denmark Wire Marking Labels Competitive Benchmarking By Technical and Operational Parameters
- Denmark Wire Marking Labels Company Profiles
- Denmark Wire Marking Labels Key Strategic Recommendations
Frequently Asked Questions About the Market Study (FAQs):
6Wresearch actively monitors the Denmark Wire Marking Labels Market and publishes its comprehensive annual report, highlighting emerging trends, growth drivers, revenue analysis, and forecast outlook. Our insights help businesses to make data-backed strategic decisions with ongoing market dynamics. Our analysts track relevent industries related to the Denmark Wire Marking Labels Market, allowing our clients with actionable intelligence and reliable forecasts tailored to emerging regional needs.
Yes, we provide customisation as per your requirements. To learn more, feel free to contact us on sales@6wresearch.com
1 Executive Summary |
2 Introduction |
2.1 Key Highlights of the Report |
2.2 Report Description |
2.3 Market Scope & Segmentation |
2.4 Research Methodology |
2.5 Assumptions |
3 Denmark Wire Marking Labels Market Overview |
3.1 Denmark Country Macro Economic Indicators |
3.2 Denmark Wire Marking Labels Market Revenues & Volume, 2022 & 2032F |
3.3 Denmark Wire Marking Labels Market - Industry Life Cycle |
3.4 Denmark Wire Marking Labels Market - Porter's Five Forces |
3.5 Denmark Wire Marking Labels Market Revenues & Volume Share, By Product Type, 2022 & 2032F |
3.6 Denmark Wire Marking Labels Market Revenues & Volume Share, By Material Type, 2022 & 2032F |
3.7 Denmark Wire Marking Labels Market Revenues & Volume Share, By Distribution Channel, 2022 & 2032F |
3.8 Denmark Wire Marking Labels Market Revenues & Volume Share, By End User, 2022 & 2032F |
4 Denmark Wire Marking Labels Market Dynamics |
4.1 Impact Analysis |
4.2 Market Drivers |
4.2.1 Increasing demand for wire marking labels in various industries such as telecommunications, construction, and automotive due to the need for efficient cable management. |
4.2.2 Growing emphasis on safety and compliance regulations driving the adoption of wire marking labels for clear identification of wires and cables. |
4.2.3 Technological advancements leading to the development of innovative and durable wire marking labels, enhancing their usability and longevity. |
4.3 Market Restraints |
4.3.1 Price volatility of raw materials used in manufacturing wire marking labels impacting the production costs and pricing strategies of manufacturers. |
4.3.2 Competition from alternative cable marking solutions such as heat shrink tubing or engraved labels affecting the market penetration of wire marking labels. |
4.3.3 Economic fluctuations and uncertainties impacting the overall investment in infrastructure projects, which can influence the demand for wire marking labels. |
5 Denmark Wire Marking Labels Market Trends |
6 Denmark Wire Marking Labels Market, By Types |
6.1 Denmark Wire Marking Labels Market, By Product Type |
6.1.1 Overview and Analysis |
6.1.2 Denmark Wire Marking Labels Market Revenues & Volume, By Product Type, 2022 - 2032F |
6.1.3 Denmark Wire Marking Labels Market Revenues & Volume, By Self-Laminating Labels, 2022 - 2032F |
6.1.4 Denmark Wire Marking Labels Market Revenues & Volume, By Heat Shrink Labels, 2022 - 2032F |
6.1.5 Denmark Wire Marking Labels Market Revenues & Volume, By Adhesive Labels, 2022 - 2032F |
6.1.6 Denmark Wire Marking Labels Market Revenues & Volume, By Clip-On Labels, 2022 - 2032F |
6.2 Denmark Wire Marking Labels Market, By Material Type |
6.2.1 Overview and Analysis |
6.2.2 Denmark Wire Marking Labels Market Revenues & Volume, By Polyester, 2022 - 2032F |
6.2.3 Denmark Wire Marking Labels Market Revenues & Volume, By PVC, 2022 - 2032F |
6.2.4 Denmark Wire Marking Labels Market Revenues & Volume, By Paper, 2022 - 2032F |
6.2.5 Denmark Wire Marking Labels Market Revenues & Volume, By Rubber, 2022 - 2032F |
6.3 Denmark Wire Marking Labels Market, By Distribution Channel |
6.3.1 Overview and Analysis |
6.3.2 Denmark Wire Marking Labels Market Revenues & Volume, By Online Platforms, 2022 - 2032F |
6.3.3 Denmark Wire Marking Labels Market Revenues & Volume, By Specialty Stores, 2022 - 2032F |
6.3.4 Denmark Wire Marking Labels Market Revenues & Volume, By Industrial Suppliers, 2022 - 2032F |
6.3.5 Denmark Wire Marking Labels Market Revenues & Volume, By Direct Sales, 2022 - 2032F |
6.4 Denmark Wire Marking Labels Market, By End User |
6.4.1 Overview and Analysis |
6.4.2 Denmark Wire Marking Labels Market Revenues & Volume, By Electronics Industry, 2022 - 2032F |
6.4.3 Denmark Wire Marking Labels Market Revenues & Volume, By Aerospace Industry, 2022 - 2032F |
6.4.4 Denmark Wire Marking Labels Market Revenues & Volume, By Telecom Industry, 2022 - 2032F |
6.4.5 Denmark Wire Marking Labels Market Revenues & Volume, By Power Utilities, 2022 - 2032F |
7 Denmark Wire Marking Labels Market Import-Export Trade Statistics |
7.1 Denmark Wire Marking Labels Market Export to Major Countries |
7.2 Denmark Wire Marking Labels Market Imports from Major Countries |
8 Denmark Wire Marking Labels Market Key Performance Indicators |
8.1 Adoption rate of digital wire marking solutions compared to traditional manual labeling methods. |
8.2 Customer satisfaction scores related to the durability and readability of wire marking labels. |
8.3 Percentage of repeat purchases or customer loyalty indicating the market acceptance and trust in wire marking label products. |
9 Denmark Wire Marking Labels Market - Opportunity Assessment |
9.1 Denmark Wire Marking Labels Market Opportunity Assessment, By Product Type, 2022 & 2032F |
9.2 Denmark Wire Marking Labels Market Opportunity Assessment, By Material Type, 2022 & 2032F |
9.3 Denmark Wire Marking Labels Market Opportunity Assessment, By Distribution Channel, 2022 & 2032F |
9.4 Denmark Wire Marking Labels Market Opportunity Assessment, By End User, 2022 & 2032F |
10 Denmark Wire Marking Labels Market - Competitive Landscape |
10.1 Denmark Wire Marking Labels Market Revenue Share, By Companies, 2025 |
10.2 Denmark Wire Marking Labels Market Competitive Benchmarking, By Operating and Technical Parameters |
11 Company Profiles |
12 Recommendations |
13 Disclaimer |
Export potential assessment - trade Analytics for 2030
Export potential enables firms to identify high-growth global markets with greater confidence by combining advanced trade intelligence with a structured quantitative methodology. The framework analyzes emerging demand trends and country-level import patterns while integrating macroeconomic and trade datasets such as GDP and population forecasts, bilateral import–export flows, tariff structures, elasticity differentials between developed and developing economies, geographic distance, and import demand projections. Using weighted trade values from 2020–2024 as the base period to project country-to-country export potential for 2030, these inputs are operationalized through calculated drivers such as gravity model parameters, tariff impact factors, and projected GDP per-capita growth. Through an analysis of hidden potentials, demand hotspots, and market conditions that are most favorable to success, this method enables firms to focus on target countries, maximize returns, and global expansion with data, backed by accuracy.
By factoring in the projected importer demand gap that is currently unmet and could be potential opportunity, it identifies the potential for the Exporter (Country) among 190 countries, against the general trade analysis, which identifies the biggest importer or exporter.
To discover high-growth global markets and optimize your business strategy:
Click Here
Pricing
- Single User License$ 1,995
- Department License$ 2,400
- Site License$ 3,120
- Global License$ 3,795

Search
Thought Leadership and Analyst Meet


Our Clients
Latest Reports
- Philippines Polyhydroxybutyrate-co-Hydroxyvalerate Market (2026-2032) | Trends, Insights, Challenges, Restraints, Competition, Size, Value, Forecast, Pricing, Share, Outlook, Revenue, Investment Opportunities, Strategy, Drivers, Demand, Growth, segmentation, Analysis, Companies
- Peru Polyhydroxybutyrate-co-Hydroxyvalerate Market (2026-2032) | Growth, Demand, Challenges, Share, Trends, Analysis, Pricing, Investment Opportunities, Drivers, Value, Forecast, Competition, Size, Companies, Insights, Outlook, Restraints, segmentation, Revenue, Strategy
- Pakistan Polyhydroxybutyrate-co-Hydroxyvalerate Market (2026-2032) | Restraints, segmentation, Pricing, Forecast, Share, Strategy, Competition, Trends, Insights, Drivers, Challenges, Growth, Revenue, Outlook, Value, Investment Opportunities, Companies, Size, Analysis, Demand
- Oman Polyhydroxybutyrate-co-Hydroxyvalerate Market (2026-2032) | Drivers, segmentation, Insights, Competition, Pricing, Outlook, Size, Revenue, Challenges, Forecast, Analysis, Growth, Value, Share, Trends, Investment Opportunities, Strategy, Restraints, Companies, Demand
- Nigeria Polyhydroxybutyrate-co-Hydroxyvalerate Market (2026-2032) | Value, Investment Opportunities, Analysis, Revenue, Restraints, Pricing, Outlook, Competition, Demand, Growth, Forecast, Companies, Trends, Challenges, segmentation, Drivers, Insights, Share, Size, Strategy
- Nepal Polyhydroxybutyrate-co-Hydroxyvalerate Market (2026-2032) | Insights, Analysis, Drivers, Share, Revenue, Demand, segmentation, Investment Opportunities, Competition, Forecast, Growth, Pricing, Companies, Strategy, Trends, Restraints, Challenges, Outlook, Size, Value
- Myanmar Polyhydroxybutyrate-co-Hydroxyvalerate Market (2026-2032) | Outlook, Revenue, Strategy, Restraints, Drivers, segmentation, Share, Forecast, Competition, Insights, Growth, Pricing, Size, Demand, Value, Companies, Trends, Challenges, Investment Opportunities, Analysis
- Morocco Polyhydroxybutyrate-co-Hydroxyvalerate Market (2026-2032) | Outlook, Investment Opportunities, Restraints, Strategy, Forecast, Challenges, Drivers, Growth, Companies, segmentation, Trends, Size, Competition, Revenue, Demand, Insights, Share, Analysis, Value, Pricing
- Mexico Polyhydroxybutyrate-co-Hydroxyvalerate Market (2026-2032) | Size, Drivers, Outlook, Share, Strategy, Growth, Pricing, Challenges, Companies, Demand, Value, Investment Opportunities, Restraints, Trends, Forecast, segmentation, Analysis, Insights, Competition, Revenue
- Malaysia Polyhydroxybutyrate-co-Hydroxyvalerate Market (2026-2032) | Share, segmentation, Size, Companies, Analysis, Insights, Forecast, Value, Revenue, Drivers, Restraints, Challenges, Investment Opportunities, Trends, Competition, Strategy, Demand, Growth, Outlook, Pricing
Industry Events and Analyst Meet

HIMTEX 2026

India Refining Summit 2026

India EV Show 2026

EV tech India Expo 2026

Auto Tech Asia 2026
Whitepaper
- Middle East & Africa Commercial Security Market Click here to view more.
- Middle East & Africa Fire Safety Systems & Equipment Market Click here to view more.
- GCC Drone Market Click here to view more.
- Middle East Lighting Fixture Market Click here to view more.
- GCC Physical & Perimeter Security Market Click here to view more.
6WResearch In News
- Doha a strategic location for EV manufacturing hub: IPA Qatar
- Demand for luxury TVs surging in the GCC, says Samsung
- Empowering Growth: The Thriving Journey of Bangladesh’s Cable Industry
- Demand for luxury TVs surging in the GCC, says Samsung
- Video call with a traditional healer? Once unthinkable, it’s now common in South Africa
- Intelligent Buildings To Smooth GCC’s Path To Net Zero