Estonia Azithromycin Market (2025-2031) | Companies, Competitive Landscape, Industry, Share, Segmentation, Analysis, Size & Revenue, Outlook, Trends, Value, Growth, Forecast
Market Forecast By Type (Oral, Injection, Ophthalmic), By Application (Bacterial Infections, Mycobacterium Avium Complex (MAC) Infection, Others), By Demographic (Children, Adult), By End-Users (Clinic, Hospital, Others), By Distribution Channel (Hospital Pharmacy, Retail Pharmacy, Online Pharmacy) And Competitive Landscape
| Product Code: ETC7126947 | Publication Date: Sep 2024 | Updated Date: Apr 2026 | Product Type: Market Research Report | |
| Publisher: 6Wresearch | Author: Vasudha | No. of Pages: 75 | No. of Figures: 35 | No. of Tables: 20 |
Estonia Azithromycin Market Size (2020-2030)
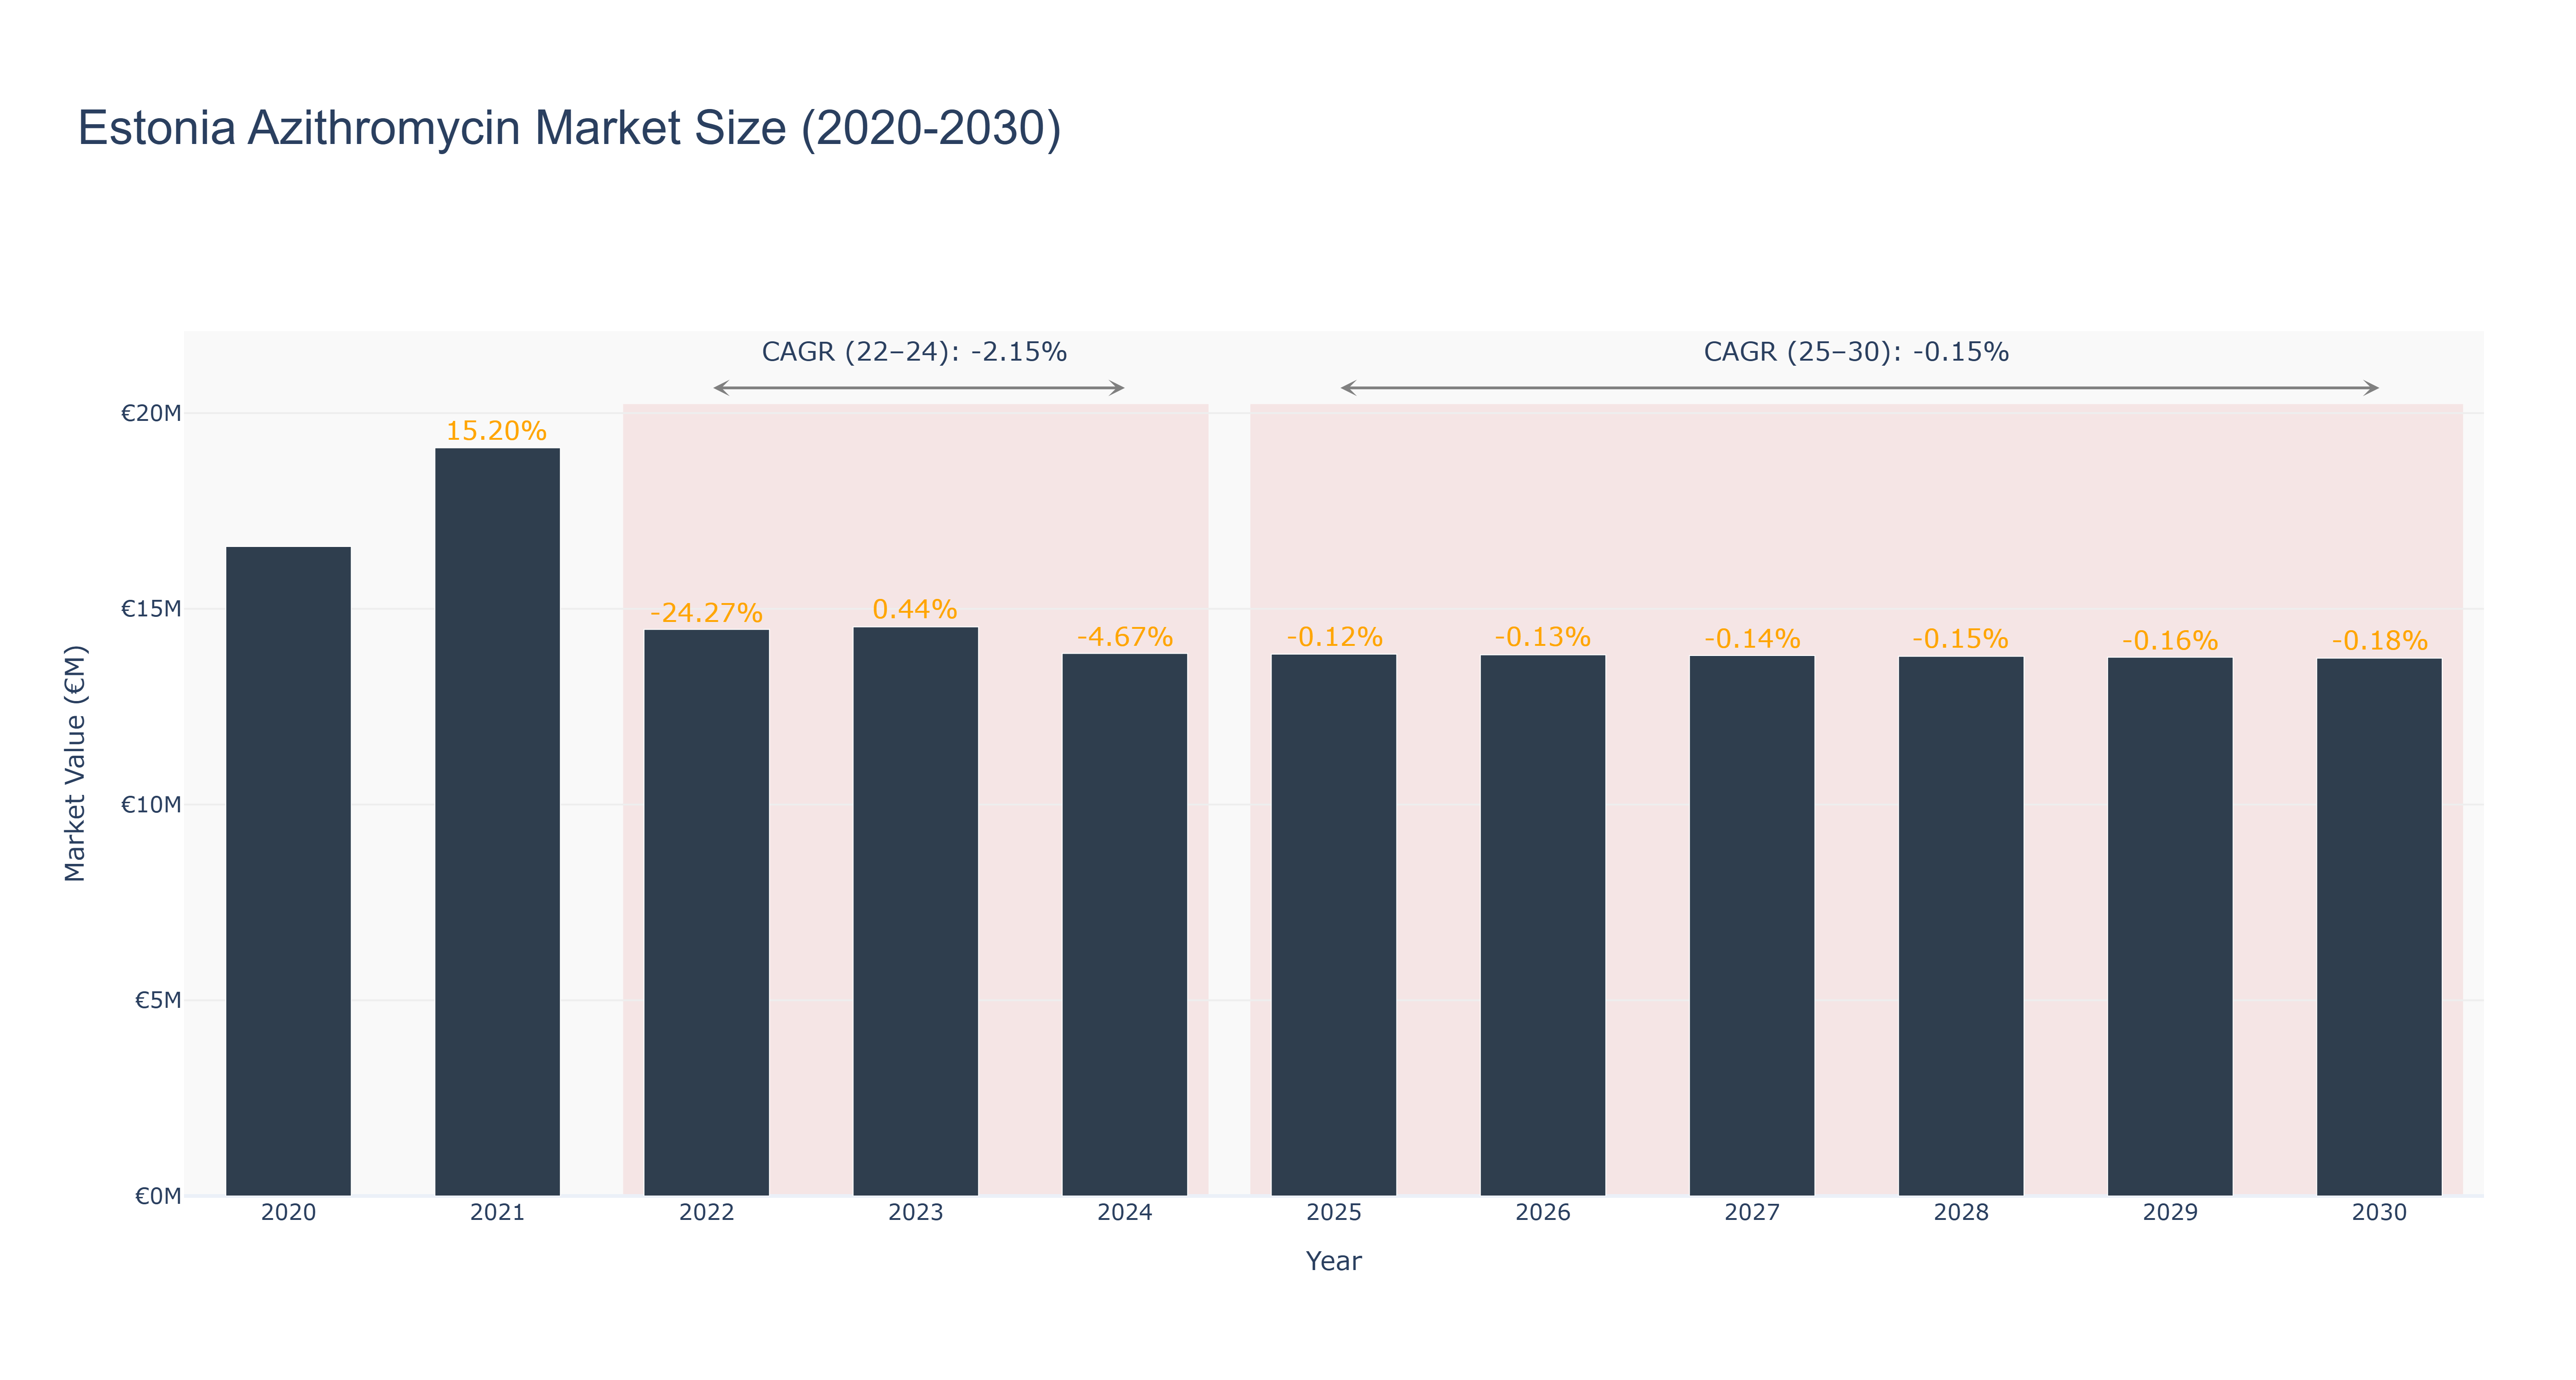
The Estonia Azithromycin Market experienced a peak market size of €19.11 million in 2021, followed by a notable decline to €14.47 million in 2022, reflecting a significant growth contraction of -24.27%. The market size remained relatively stable at €14.54 million in 2023, with a slight growth of 0.44%, but is projected to decline further to €13.86 million by 2024, yielding an actual CAGR of -2.15% from 2022 to 2024. Looking ahead, the forecasted period from 2025 to 2030 indicates a gradual decline in market size, with projected values decreasing from €13.84 million in 2025 to €13.74 million in 2030, resulting in a forecasted CAGR of -0.15%. This ongoing contraction may be attributed to increased competition, market saturation, and shifting prescribing patterns. Despite the challenging landscape, potential innovations in antibiotic therapies and evolving healthcare policies could provide opportunities for market stabilization in the long term.
Estonia Azithromycin Market: Production & Trade Performance (2019-2025)
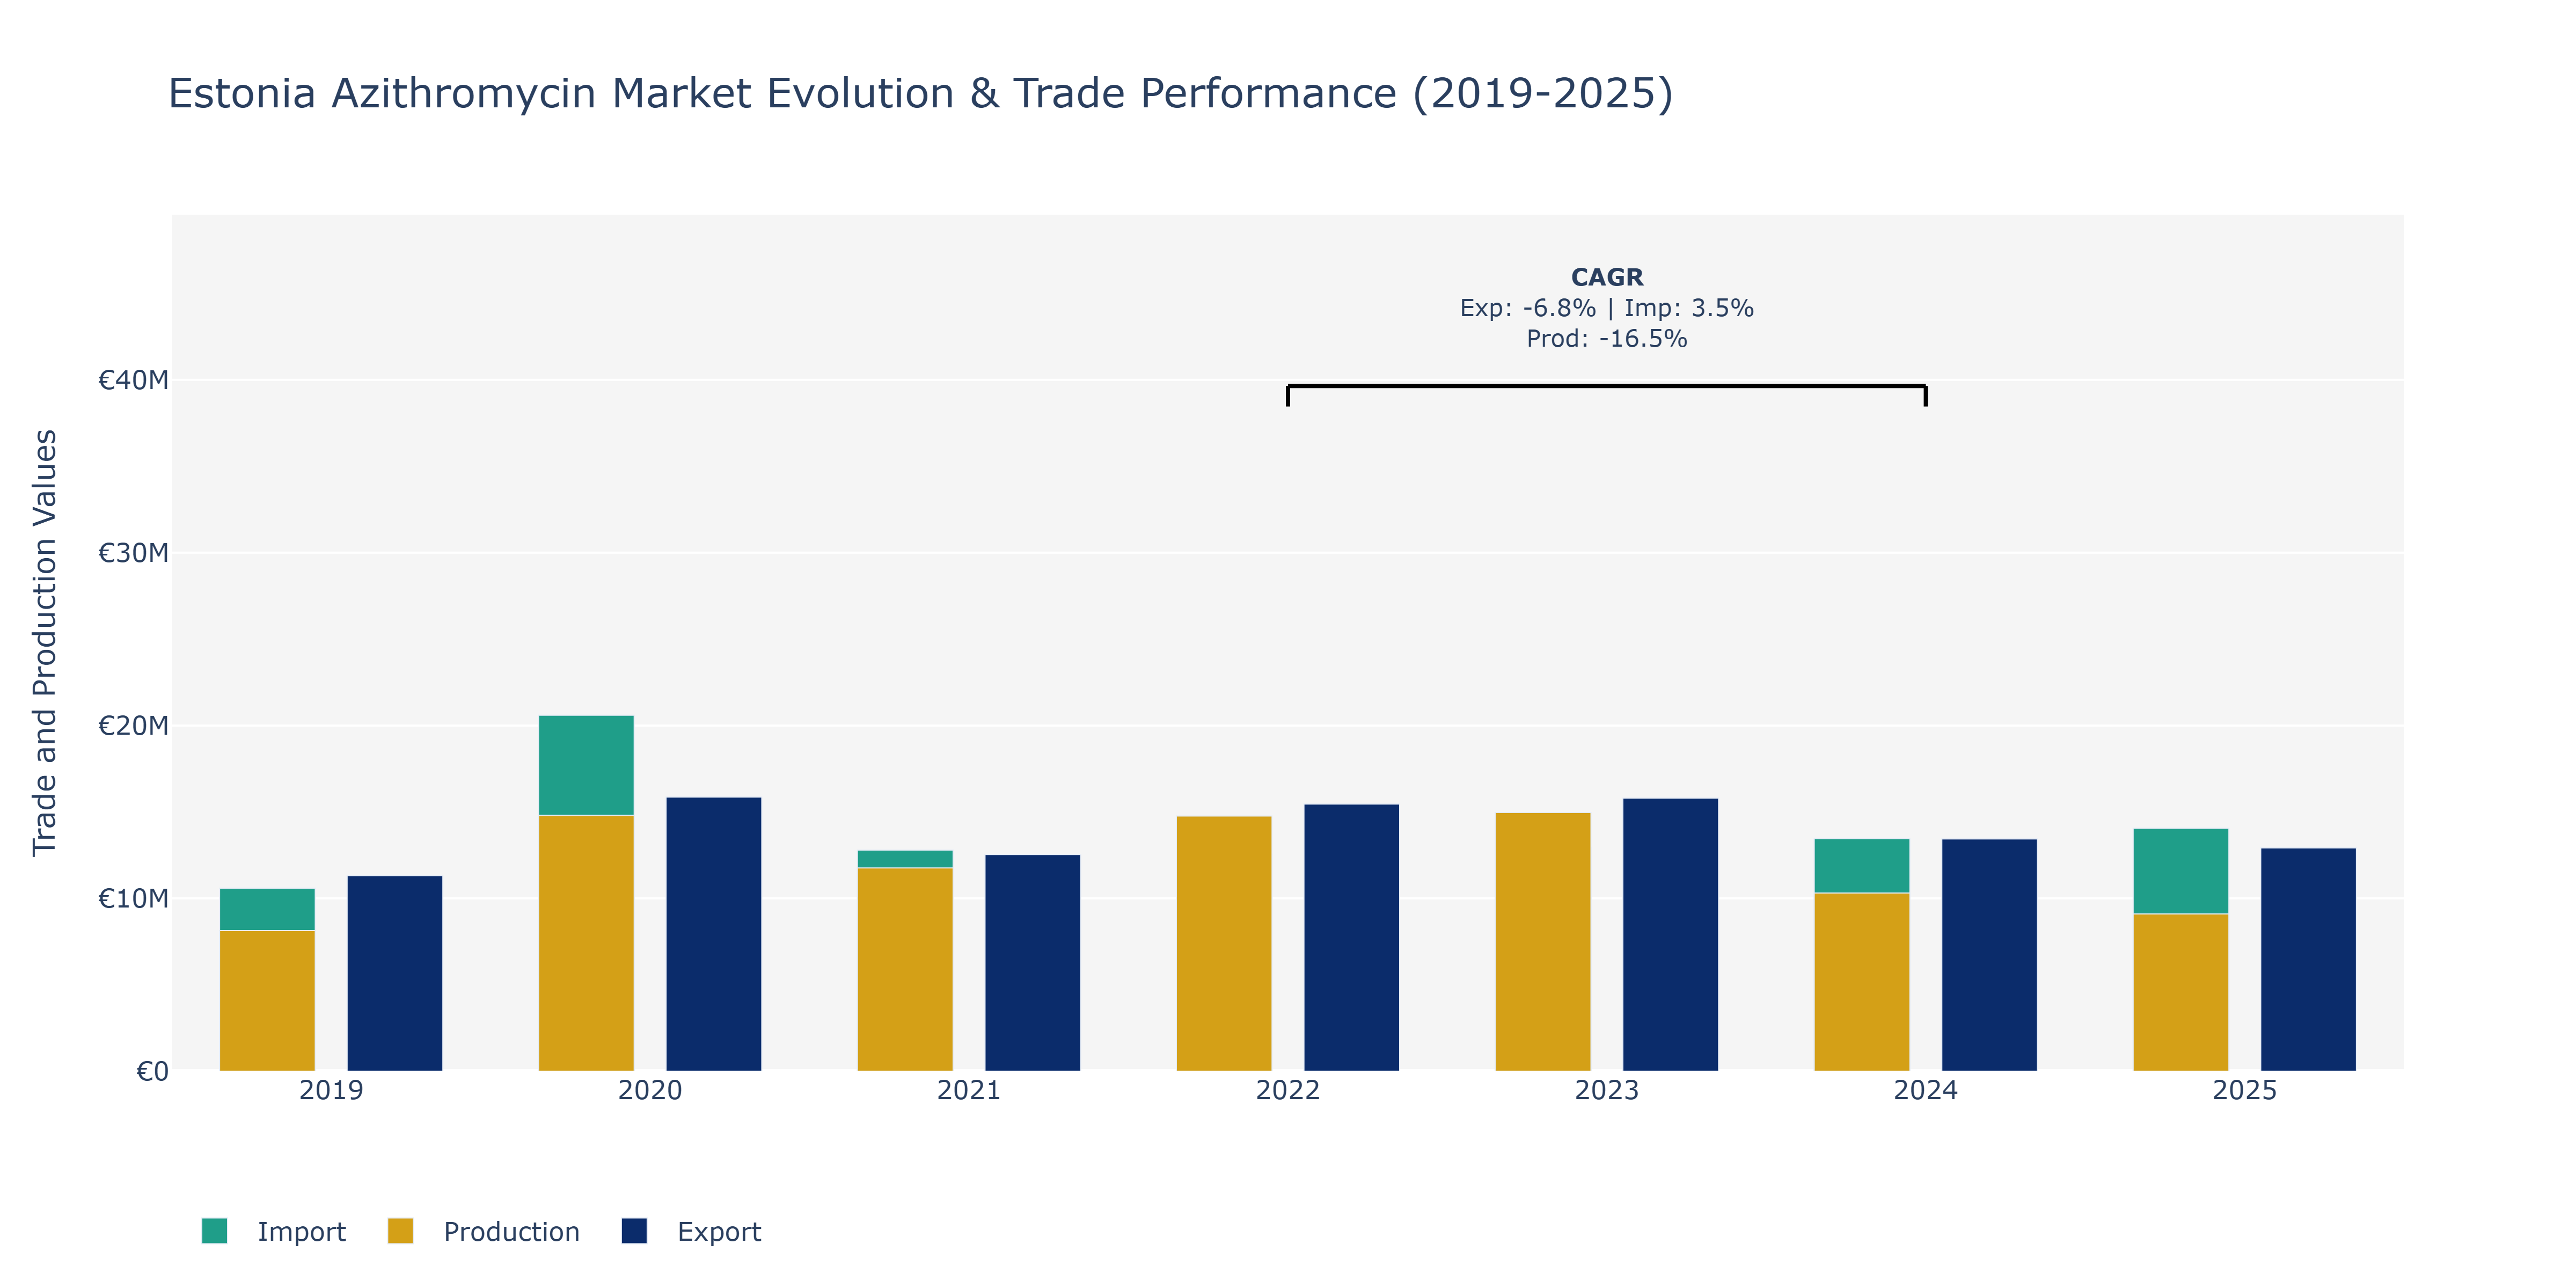
Between 2019 and 2025, the Estonia Azithromycin Market witnessed fluctuations in Exports, Imports, and Production. Exports saw peaks in 2020 at €15.86 million and a slight decline to €12.92 million in 2025. Imports peaked in 2020 at €20.59 million and declined to €14.05 million in 2025. Production peaked in 2020 at €14.80 million and dropped to €9.09 million in 2025. The market experienced a negative Production CAGR of -16.47% from 2022 to 2024, possibly due to shifts in demand or supply chain disruptions. The decrease in Exports from 2020 to 2025 might indicate changes in international demand or competitive pressures. The fluctuations in Imports could be influenced by changes in raw material costs or regulatory factors affecting imports. Continued monitoring of global pharmaceutical trends and market dynamics could provide insights into future developments in the Estonia Azithromycin Market.
Key Highlights of the Report:
- Estonia Azithromycin Market Outlook
- Market Size of Estonia Azithromycin Market, 2024
- Forecast of Estonia Azithromycin Market, 2031
- Historical Data and Forecast of Estonia Azithromycin Revenues & Volume for the Period 2021- 2031
- Estonia Azithromycin Market Trend Evolution
- Estonia Azithromycin Market Drivers and Challenges
- Estonia Azithromycin Price Trends
- Estonia Azithromycin Porter's Five Forces
- Estonia Azithromycin Industry Life Cycle
- Historical Data and Forecast of Estonia Azithromycin Market Revenues & Volume By Type for the Period 2021- 2031
- Historical Data and Forecast of Estonia Azithromycin Market Revenues & Volume By Oral for the Period 2021- 2031
- Historical Data and Forecast of Estonia Azithromycin Market Revenues & Volume By Injection for the Period 2021- 2031
- Historical Data and Forecast of Estonia Azithromycin Market Revenues & Volume By Ophthalmic for the Period 2021- 2031
- Historical Data and Forecast of Estonia Azithromycin Market Revenues & Volume By Application for the Period 2021- 2031
- Historical Data and Forecast of Estonia Azithromycin Market Revenues & Volume By Bacterial Infections for the Period 2021- 2031
- Historical Data and Forecast of Estonia Azithromycin Market Revenues & Volume By Mycobacterium Avium Complex (MAC) Infection for the Period 2021- 2031
- Historical Data and Forecast of Estonia Azithromycin Market Revenues & Volume By Others for the Period 2021- 2031
- Historical Data and Forecast of Estonia Azithromycin Market Revenues & Volume By Demographic for the Period 2021- 2031
- Historical Data and Forecast of Estonia Azithromycin Market Revenues & Volume By Children for the Period 2021- 2031
- Historical Data and Forecast of Estonia Azithromycin Market Revenues & Volume By Adult for the Period 2021- 2031
- Historical Data and Forecast of Estonia Azithromycin Market Revenues & Volume By End-Users for the Period 2021- 2031
- Historical Data and Forecast of Estonia Azithromycin Market Revenues & Volume By Clinic for the Period 2021- 2031
- Historical Data and Forecast of Estonia Azithromycin Market Revenues & Volume By Hospital for the Period 2021- 2031
- Historical Data and Forecast of Estonia Azithromycin Market Revenues & Volume By Others for the Period 2021- 2031
- Historical Data and Forecast of Estonia Azithromycin Market Revenues & Volume By Distribution Channel for the Period 2021- 2031
- Historical Data and Forecast of Estonia Azithromycin Market Revenues & Volume By Hospital Pharmacy for the Period 2021- 2031
- Historical Data and Forecast of Estonia Azithromycin Market Revenues & Volume By Retail Pharmacy for the Period 2021- 2031
- Historical Data and Forecast of Estonia Azithromycin Market Revenues & Volume By Online Pharmacy for the Period 2021- 2031
- Estonia Azithromycin Import Export Trade Statistics
- Market Opportunity Assessment By Type
- Market Opportunity Assessment By Application
- Market Opportunity Assessment By Demographic
- Market Opportunity Assessment By End-Users
- Market Opportunity Assessment By Distribution Channel
- Estonia Azithromycin Top Companies Market Share
- Estonia Azithromycin Competitive Benchmarking By Technical and Operational Parameters
- Estonia Azithromycin Company Profiles
- Estonia Azithromycin Key Strategic Recommendations
Frequently Asked Questions About the Market Study (FAQs):
6Wresearch actively monitors the Estonia Azithromycin Market and publishes its comprehensive annual report, highlighting emerging trends, growth drivers, revenue analysis, and forecast outlook. Our insights help businesses to make data-backed strategic decisions with ongoing market dynamics. Our analysts track relevent industries related to the Estonia Azithromycin Market, allowing our clients with actionable intelligence and reliable forecasts tailored to emerging regional needs.
Yes, we provide customisation as per your requirements. To learn more, feel free to contact us on sales@6wresearch.com
1 Executive Summary |
2 Introduction |
2.1 Key Highlights of the Report |
2.2 Report Description |
2.3 Market Scope & Segmentation |
2.4 Research Methodology |
2.5 Assumptions |
3 Estonia Azithromycin Market Overview |
3.1 Estonia Country Macro Economic Indicators |
3.2 Estonia Azithromycin Market Revenues & Volume, 2021 & 2031F |
3.3 Estonia Azithromycin Market - Industry Life Cycle |
3.4 Estonia Azithromycin Market - Porter's Five Forces |
3.5 Estonia Azithromycin Market Revenues & Volume Share, By Type, 2021 & 2031F |
3.6 Estonia Azithromycin Market Revenues & Volume Share, By Application, 2021 & 2031F |
3.7 Estonia Azithromycin Market Revenues & Volume Share, By Demographic, 2021 & 2031F |
3.8 Estonia Azithromycin Market Revenues & Volume Share, By End-Users, 2021 & 2031F |
3.9 Estonia Azithromycin Market Revenues & Volume Share, By Distribution Channel, 2021 & 2031F |
4 Estonia Azithromycin Market Dynamics |
4.1 Impact Analysis |
4.2 Market Drivers |
4.3 Market Restraints |
5 Estonia Azithromycin Market Trends |
6 Estonia Azithromycin Market, By Types |
6.1 Estonia Azithromycin Market, By Type |
6.1.1 Overview and Analysis |
6.1.2 Estonia Azithromycin Market Revenues & Volume, By Type, 2021- 2031F |
6.1.3 Estonia Azithromycin Market Revenues & Volume, By Oral, 2021- 2031F |
6.1.4 Estonia Azithromycin Market Revenues & Volume, By Injection, 2021- 2031F |
6.1.5 Estonia Azithromycin Market Revenues & Volume, By Ophthalmic, 2021- 2031F |
6.2 Estonia Azithromycin Market, By Application |
6.2.1 Overview and Analysis |
6.2.2 Estonia Azithromycin Market Revenues & Volume, By Bacterial Infections, 2021- 2031F |
6.2.3 Estonia Azithromycin Market Revenues & Volume, By Mycobacterium Avium Complex (MAC) Infection, 2021- 2031F |
6.2.4 Estonia Azithromycin Market Revenues & Volume, By Others, 2021- 2031F |
6.3 Estonia Azithromycin Market, By Demographic |
6.3.1 Overview and Analysis |
6.3.2 Estonia Azithromycin Market Revenues & Volume, By Children, 2021- 2031F |
6.3.3 Estonia Azithromycin Market Revenues & Volume, By Adult, 2021- 2031F |
6.4 Estonia Azithromycin Market, By End-Users |
6.4.1 Overview and Analysis |
6.4.2 Estonia Azithromycin Market Revenues & Volume, By Clinic, 2021- 2031F |
6.4.3 Estonia Azithromycin Market Revenues & Volume, By Hospital, 2021- 2031F |
6.4.4 Estonia Azithromycin Market Revenues & Volume, By Others, 2021- 2031F |
6.5 Estonia Azithromycin Market, By Distribution Channel |
6.5.1 Overview and Analysis |
6.5.2 Estonia Azithromycin Market Revenues & Volume, By Hospital Pharmacy, 2021- 2031F |
6.5.3 Estonia Azithromycin Market Revenues & Volume, By Retail Pharmacy, 2021- 2031F |
6.5.4 Estonia Azithromycin Market Revenues & Volume, By Online Pharmacy, 2021- 2031F |
7 Estonia Azithromycin Market Import-Export Trade Statistics |
7.1 Estonia Azithromycin Market Export to Major Countries |
7.2 Estonia Azithromycin Market Imports from Major Countries |
8 Estonia Azithromycin Market Key Performance Indicators |
9 Estonia Azithromycin Market - Opportunity Assessment |
9.1 Estonia Azithromycin Market Opportunity Assessment, By Type, 2021 & 2031F |
9.2 Estonia Azithromycin Market Opportunity Assessment, By Application, 2021 & 2031F |
9.3 Estonia Azithromycin Market Opportunity Assessment, By Demographic, 2021 & 2031F |
9.4 Estonia Azithromycin Market Opportunity Assessment, By End-Users, 2021 & 2031F |
9.5 Estonia Azithromycin Market Opportunity Assessment, By Distribution Channel, 2021 & 2031F |
10 Estonia Azithromycin Market - Competitive Landscape |
10.1 Estonia Azithromycin Market Revenue Share, By Companies, 2024 |
10.2 Estonia Azithromycin Market Competitive Benchmarking, By Operating and Technical Parameters |
11 Company Profiles |
12 Recommendations |
13 Disclaimer |
Global Go To Market Strategy - 2030
Export potential enables firms to identify high-growth global markets with greater confidence by combining advanced trade intelligence with a structured quantitative methodology. The framework analyzes emerging demand trends and country-level import patterns while integrating macroeconomic and trade datasets such as GDP and population forecasts, bilateral import–export flows, tariff structures, elasticity differentials between developed and developing economies, geographic distance, and import demand projections. Using weighted trade values from 2020–2024 as the base period to project country-to-country export potential for 2030, these inputs are operationalized through calculated drivers such as gravity model parameters, tariff impact factors, and projected GDP per-capita growth. Through an analysis of hidden potentials, demand hotspots, and market conditions that are most favorable to success, this method enables firms to focus on target countries, maximize returns, and global expansion with data, backed by accuracy.
By factoring in the projected importer demand gap that is currently unmet and could be potential opportunity, it identifies the potential for the Exporter (Country) among 190 countries, against the general trade analysis, which identifies the biggest importer or exporter.
To discover high-growth global markets and optimize your business strategy:
Click Here
Pricing
- Single User License$ 1,995
- Department License$ 2,400
- Site License$ 3,120
- Global License$ 3,795

Leadership Perspectives from Industry Events
Search
Thought Leadership and Analyst Meet


Our Clients
6WResearch In News
- Doha a strategic location for EV manufacturing hub: IPA Qatar
- Demand for luxury TVs surging in the GCC, says Samsung
- Empowering Growth: The Thriving Journey of Bangladesh’s Cable Industry
- Demand for luxury TVs surging in the GCC, says Samsung
- Video call with a traditional healer? Once unthinkable, it’s now common in South Africa
- Intelligent Buildings To Smooth GCC’s Path To Net Zero
Latest Reports
- Taiwan Airport Wireless Infrastructure Market (2026-2032)
- Vietnam Airport Wireless Infrastructure Market (2026-2032)
- Thailand Airport Wireless Infrastructure Market (2026-2032)
- South Korea Airport Wireless Infrastructure Market (2026-2032)
- Romania Airport Wireless Infrastructure Market (2026-2032)
- Qatar Airport Wireless Infrastructure Market (2026-2032)
- Philippines Airport Wireless Infrastructure Market (2026-2032)
- Japan Airport Wireless Infrastructure Market (2026-2032)
- Taiwan Airport Winter Services Market (2026-2032)
- Vietnam Airport Winter Services Market (2026-2032)
Industry Events and Analyst Meet

HIMTEX 2026

India Refining Summit 2026

India EV Show 2026

EV tech India Expo 2026

Auto Tech Asia 2026
Whitepaper
- Middle East & Africa Commercial Security Market Click here to view more.
- Middle East & Africa Fire Safety Systems & Equipment Market Click here to view more.
- GCC Drone Market Click here to view more.
- Middle East Lighting Fixture Market Click here to view more.
- GCC Physical & Perimeter Security Market Click here to view more.