Estonia Cables Market (2026-2032) | Share, Forecast, Growth, Revenue, Companies, Size, Outlook, Segmentation, Analysis, Trends, Industry & Value
And Competitive Landscape
| Product Code: ETC5403955 | Publication Date: Nov 2023 | Updated Date: Apr 2026 | Product Type: Market Research Report | |
| Publisher: 6Wresearch | Author: Ravi Bhandari | No. of Pages: 60 | No. of Figures: 30 | No. of Tables: 5 |
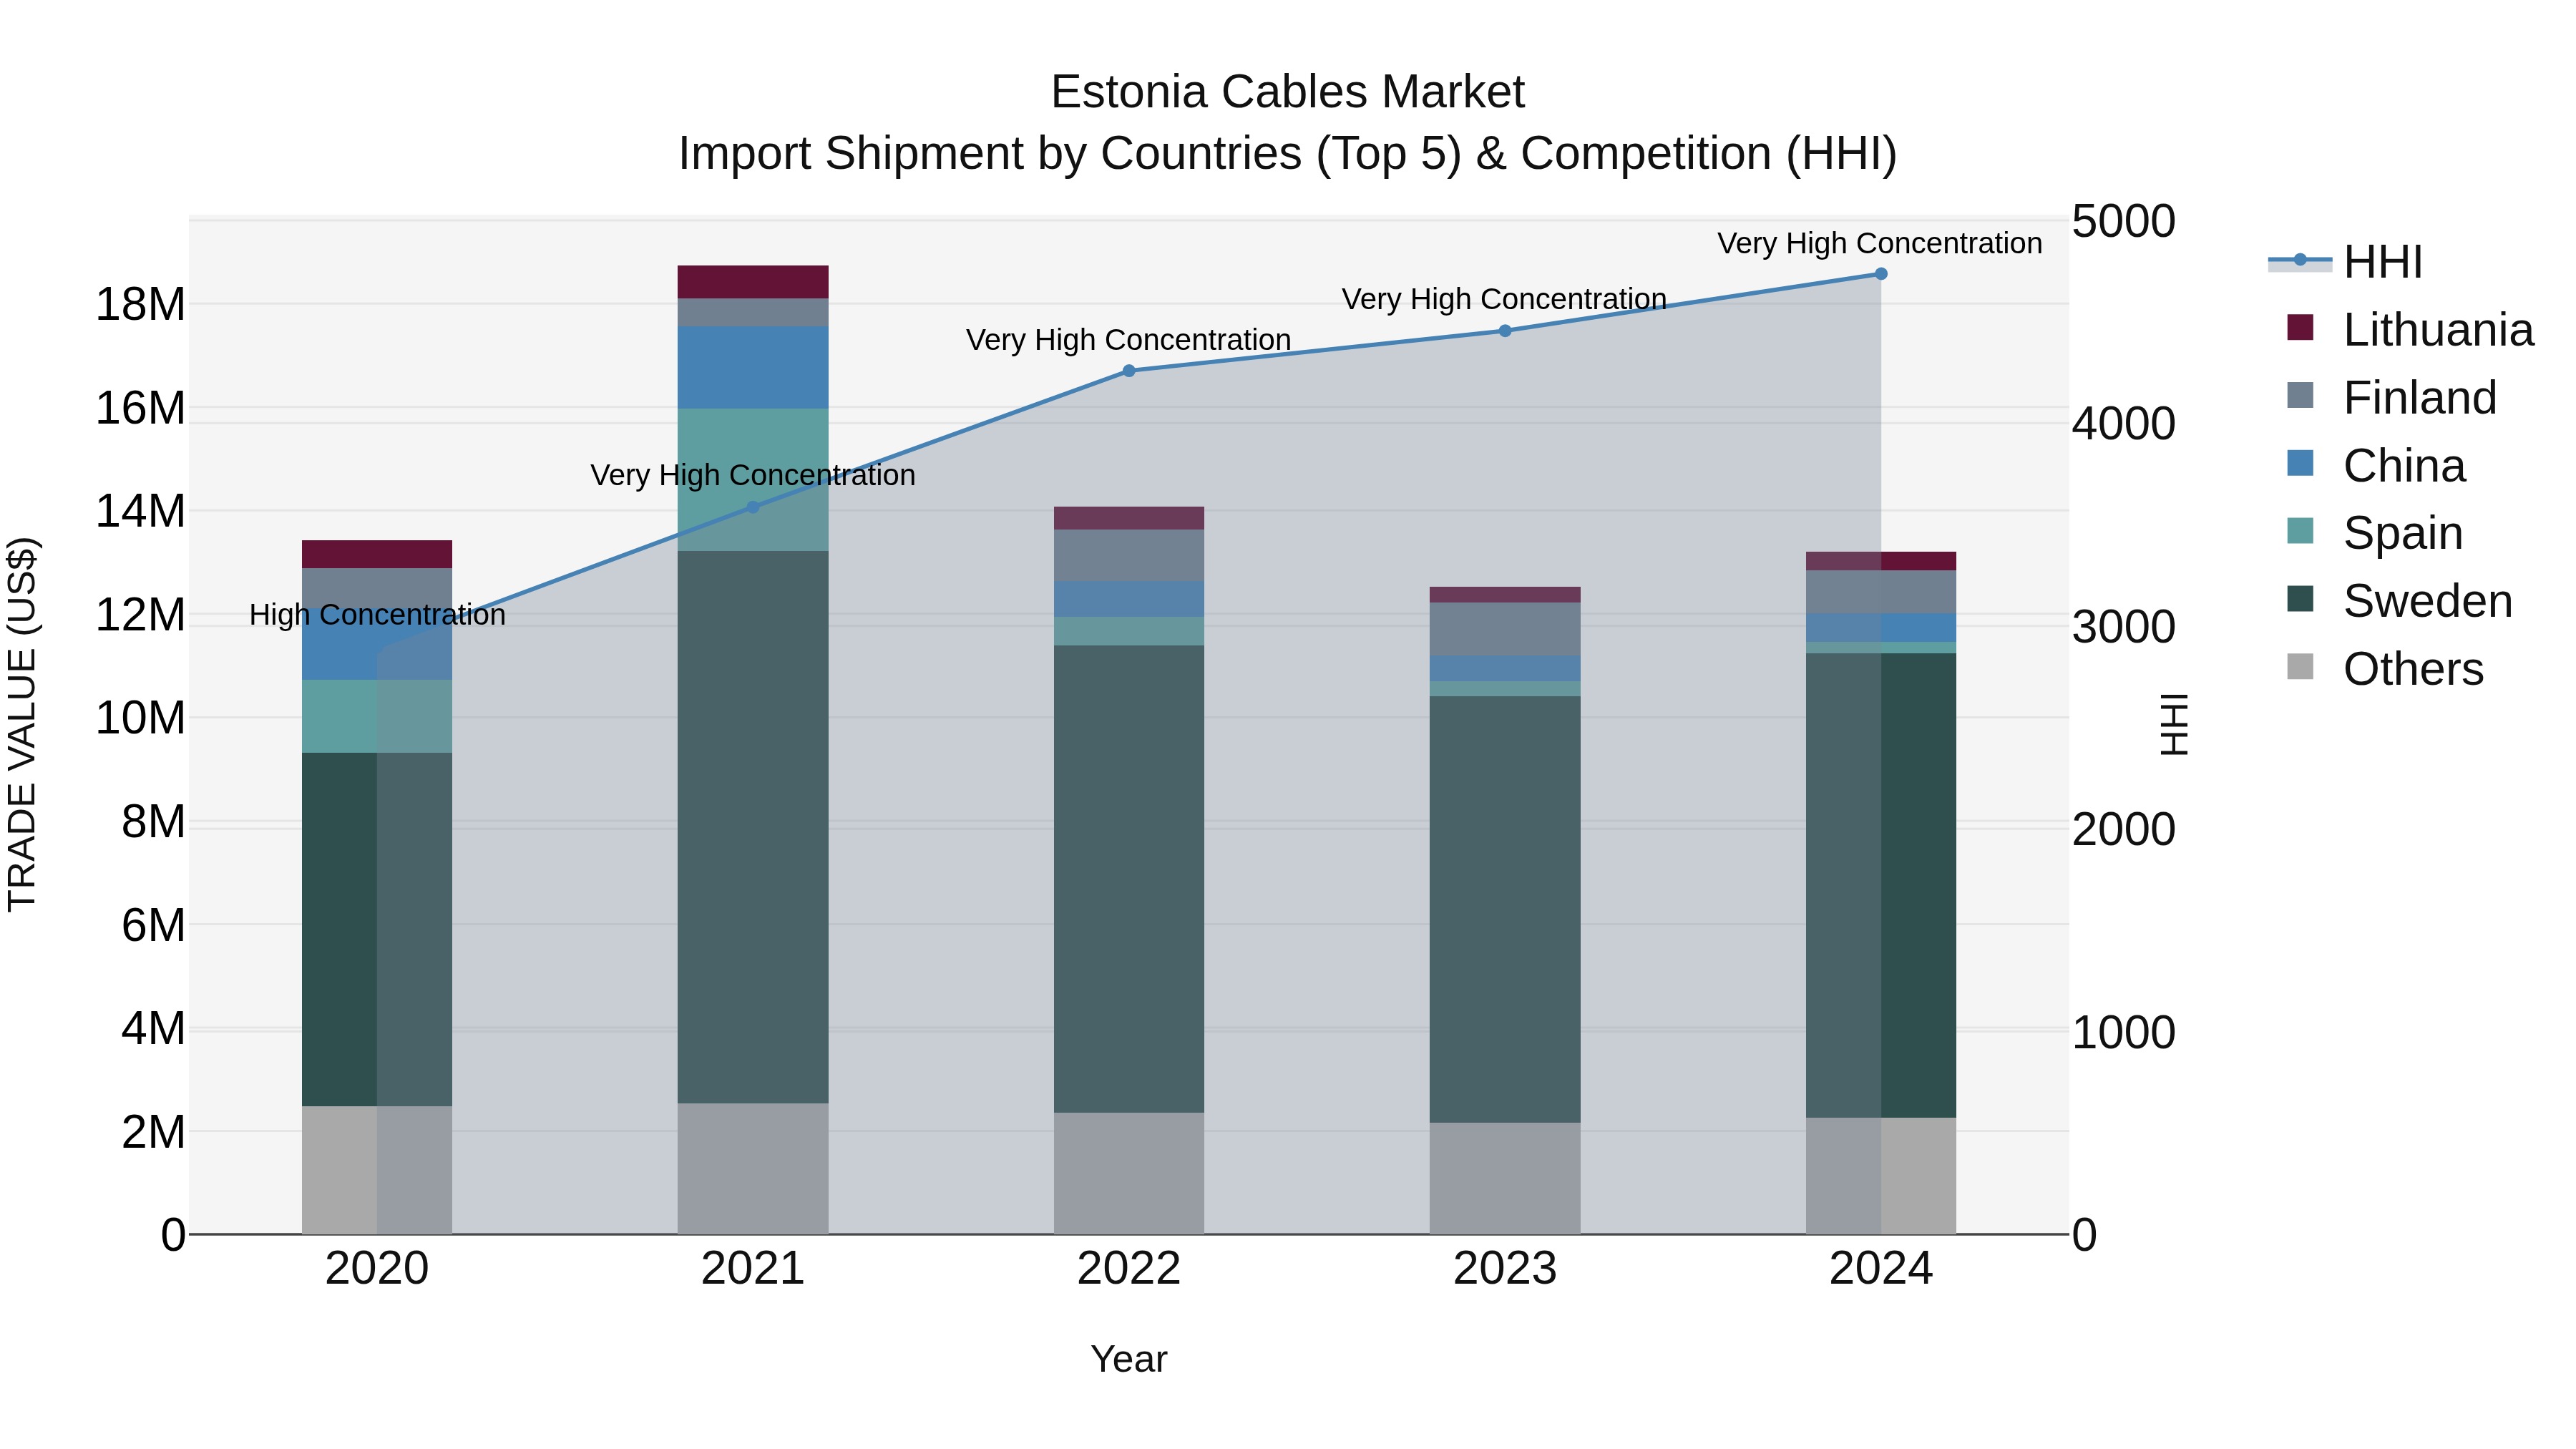
Estonia Cables Market Top 5 Importing Countries and Market Competition (HHI) Analysis
Estonia`s cable import market in 2024 continued to be dominated by key suppliers including Sweden, Finland, China, Germany, and Lithuania. Despite a slight decline in the compound annual growth rate (CAGR) from 2020-2024, the market showed a positive growth rate from 2023-2024. The high Herfindahl-Hirschman Index (HHI) indicates a concentrated market structure, with these top exporting countries maintaining significant market share. This suggests a competitive landscape where these suppliers play a crucial role in meeting Estonia`s cable import demands.
Cables Market: Estonia vs Top 5 Major Economies in 2027 (Europe)
The Cables market in Estonia is projected to grow at a negative growth rate of -0.06% by 2027, highlighting the country's increasing focus on advanced technologies within the Europe region, where Germany holds the dominant position, followed closely by United Kingdom, France, Italy and Russia, shaping overall regional demand.

Key Highlights of the Report:
- Estonia Cables Market Outlook
- Market Size of Estonia Cables Market, 2025
- Forecast of Estonia Cables Market, 2032
- Historical Data and Forecast of Estonia Cables Revenues & Volume for the Period 2022 - 2032F
- Estonia Cables Market Trend Evolution
- Estonia Cables Market Drivers and Challenges
- Estonia Cables Price Trends
- Estonia Cables Porter`s Five Forces
- Estonia Cables Industry Life Cycle
- Historical Data and Forecast of Estonia Cables Market Revenues & Volume By Installation Type for the Period 2022 - 2032F
- Historical Data and Forecast of Estonia Cables Market Revenues & Volume By Overhead for the Period 2022 - 2032F
- Historical Data and Forecast of Estonia Cables Market Revenues & Volume By Underground for the Period 2022 - 2032F
- Historical Data and Forecast of Estonia Cables Market Revenues & Volume By Submarine for the Period 2022 - 2032F
- Historical Data and Forecast of Estonia Cables Market Revenues & Volume By Voltage Type for the Period 2022 - 2032F
- Historical Data and Forecast of Estonia Cables Market Revenues & Volume By High for the Period 2022 - 2032F
- Historical Data and Forecast of Estonia Cables Market Revenues & Volume By Medium for the Period 2022 - 2032F
- Historical Data and Forecast of Estonia Cables Market Revenues & Volume By Low for the Period 2022 - 2032F
- Historical Data and Forecast of Estonia Cables Market Revenues & Volume By End Use for the Period 2022 - 2032F
- Historical Data and Forecast of Estonia Cables Market Revenues & Volume By Industrial for the Period 2022 - 2032F
- Historical Data and Forecast of Estonia Cables Market Revenues & Volume By Aerospace and Defense for the Period 2022 - 2032F
- Historical Data and Forecast of Estonia Cables Market Revenues & Volume By Oil and Gas for the Period 2022 - 2032F
- Historical Data and Forecast of Estonia Cables Market Revenues & Volume By Energy and Power for the Period 2022 - 2032F
- Historical Data and Forecast of Estonia Cables Market Revenues & Volume By IT and Telecommunication for the Period 2022 - 2032F
- Historical Data and Forecast of Estonia Cables Market Revenues & Volume By Others for the Period 2022 - 2032F
- Estonia Cables Import Export Trade Statistics
- Estonia Cables Top Companies Market Share
- Estonia Cables Competitive Benchmarking By Technical and Operational Parameters
- Estonia Cables Company Profiles
- Estonia Cables Key Strategic Recommendations
Frequently Asked Questions About the Market Study (FAQs):
6Wresearch actively monitors the Estonia Cables Market and publishes its comprehensive annual report, highlighting emerging trends, growth drivers, revenue analysis, and forecast outlook. Our insights help businesses to make data-backed strategic decisions with ongoing market dynamics. Our analysts track relevent industries related to the Estonia Cables Market, allowing our clients with actionable intelligence and reliable forecasts tailored to emerging regional needs.
Yes, we provide customisation as per your requirements. To learn more, feel free to contact us on sales@6wresearch.com
1 Executive Summary |
2 Introduction |
2.1 Key Highlights of the Report |
2.2 Report Description |
2.3 Market Scope & Segmentation |
2.4 Research Methodology |
2.5 Assumptions |
3 Estonia Cables Market Overview |
3.1 Estonia Country Macro Economic Indicators |
3.2 Estonia Cables Market Revenues & Volume, 2022 & 2032F |
3.3 Estonia Cables Market - Industry Life Cycle |
3.4 Estonia Cables Market - Porter's Five Forces |
4 Estonia Cables Market Dynamics |
4.1 Impact Analysis |
4.2 Market Drivers |
4.2.1 Increasing demand for renewable energy sources leading to investments in new power infrastructure. |
4.2.2 Growing adoption of electric vehicles driving the demand for charging infrastructure. |
4.2.3 Government initiatives promoting digitalization and connectivity, boosting the need for efficient cable networks. |
4.3 Market Restraints |
4.3.1 Fluctuating raw material prices impacting production costs. |
4.3.2 Technological advancements leading to shorter product life cycles and the need for continuous innovation. |
4.3.3 Intense competition from global and local cable manufacturers affecting pricing and market share. |
5 Estonia Cables Market Trends |
6.1.2 Estonia Cables Market Revenues & Volume, By Installation Type, 2022 - 2032F |
6.1.3 Estonia Cables Market Revenues & Volume, By Overhead, 2022 - 2032F |
6.1.4 Estonia Cables Market Revenues & Volume, By Underground, 2022 - 2032F |
6.1.5 Estonia Cables Market Revenues & Volume, By Submarine, 2022 - 2032F |
6.2.2 Estonia Cables Market Revenues & Volume, By Voltage Type, 2022 - 2032F |
6.2.3 Estonia Cables Market Revenues & Volume, By High, 2022 - 2032F |
6.2.4 Estonia Cables Market Revenues & Volume, By Medium, 2022 - 2032F |
6.2.5 Estonia Cables Market Revenues & Volume, By Low, 2022 - 2032F |
6.3.2 Estonia Cables Market Revenues & Volume, By End Use, 2022 - 2032F |
6.3.3 Estonia Cables Market Revenues & Volume, By Industrial, 2022 - 2032F |
6.3.4 Estonia Cables Market Revenues & Volume, By Aerospace and Defense, 2022 - 2032F |
6.3.5 Estonia Cables Market Revenues & Volume, By Oil and Gas, 2022 - 2032F |
6.3.6 Estonia Cables Market Revenues & Volume, By Energy and Power, 2022 - 2032F |
6.3.7 Estonia Cables Market Revenues & Volume, By IT and Telecommunication, 2022 - 2032F |
7 Estonia Cables Market Import-Export Trade Statistics |
7.1 Estonia Cables Market Export to Major Countries |
7.2 Estonia Cables Market Imports from Major Countries |
8 Estonia Cables Market Key Performance Indicators |
8.1 Percentage of revenue from new product innovations. |
8.2 Average lead time for product development and launch. |
8.3 Percentage of revenue from sustainable and environmentally friendly cable solutions. |
8.4 Percentage of revenue from government contracts for infrastructure projects. |
8.5 Customer satisfaction score for product quality and reliability. |
9 Estonia Cables Market - Opportunity Assessment |
10 Estonia Cables Market - Competitive Landscape |
10.1 Estonia Cables Market Revenue Share, By Companies, 2025 |
10.2 Estonia Cables Market Competitive Benchmarking, By Operating and Technical Parameters |
11 Company Profiles |
12 Recommendations | 13 Disclaimer |
Global Go To Market Strategy - 2030
Export potential enables firms to identify high-growth global markets with greater confidence by combining advanced trade intelligence with a structured quantitative methodology. The framework analyzes emerging demand trends and country-level import patterns while integrating macroeconomic and trade datasets such as GDP and population forecasts, bilateral import–export flows, tariff structures, elasticity differentials between developed and developing economies, geographic distance, and import demand projections. Using weighted trade values from 2020–2024 as the base period to project country-to-country export potential for 2030, these inputs are operationalized through calculated drivers such as gravity model parameters, tariff impact factors, and projected GDP per-capita growth. Through an analysis of hidden potentials, demand hotspots, and market conditions that are most favorable to success, this method enables firms to focus on target countries, maximize returns, and global expansion with data, backed by accuracy.
By factoring in the projected importer demand gap that is currently unmet and could be potential opportunity, it identifies the potential for the Exporter (Country) among 190 countries, against the general trade analysis, which identifies the biggest importer or exporter.
To discover high-growth global markets and optimize your business strategy:
Click Here
Pricing
- Single User License$ 1,995
- Department License$ 2,400
- Site License$ 3,120
- Global License$ 3,795

Leadership Perspectives from Industry Events
Search
Thought Leadership and Analyst Meet


Our Clients
6WResearch In News
- Doha a strategic location for EV manufacturing hub: IPA Qatar
- Demand for luxury TVs surging in the GCC, says Samsung
- Empowering Growth: The Thriving Journey of Bangladesh’s Cable Industry
- Demand for luxury TVs surging in the GCC, says Samsung
- Video call with a traditional healer? Once unthinkable, it’s now common in South Africa
- Intelligent Buildings To Smooth GCC’s Path To Net Zero
Latest Reports
- New Zealand Aseptic Manufacturing Market (2026-2032)
- Netherlands Aseptic Manufacturing Market (2026-2032)
- Nauru Aseptic Manufacturing Market (2026-2032)
- Namibia Aseptic Manufacturing Market (2026-2032)
- Mozambique Aseptic Manufacturing Market (2026-2032)
- Montenegro Aseptic Manufacturing Market (2026-2032)
- Mongolia Aseptic Manufacturing Market (2026-2032)
- Monaco Aseptic Manufacturing Market (2026-2032)
- Micronesia Aseptic Manufacturing Market (2026-2032)
- Mauritius Aseptic Manufacturing Market (2026-2032)
Industry Events and Analyst Meet

HIMTEX 2026

India Refining Summit 2026

India EV Show 2026

EV tech India Expo 2026

Auto Tech Asia 2026
Whitepaper
- Middle East & Africa Commercial Security Market Click here to view more.
- Middle East & Africa Fire Safety Systems & Equipment Market Click here to view more.
- GCC Drone Market Click here to view more.
- Middle East Lighting Fixture Market Click here to view more.
- GCC Physical & Perimeter Security Market Click here to view more.