Estonia Canola-based Products Market (2026-2032) | Size & Revenue, Industry, Value, Outlook, Share, Segmentation, Forecast, Growth, Companies, Competitive Landscape, Trends, Analysis
Market Forecast By Uses (High Protein Meal, BloFuel Feedstock), By Packaging Type (Bottles, Cans, Drums, Pouches), By Distribution Channel (Store- Based, Supermarkets and Hypermarkets, Convenience Stores, Non-Store Based), By Application (Cooking, Processed Food, Lubricants, Personal Care, Biofuels) And Competitive Landscape
| Product Code: ETC7128157 | Publication Date: Sep 2024 | Updated Date: Apr 2026 | Product Type: Market Research Report | |
| Publisher: 6Wresearch | Author: Sumit Sagar | No. of Pages: 75 | No. of Figures: 35 | No. of Tables: 20 |
Estonia Canola-Based Products Market Size (2020-2030)
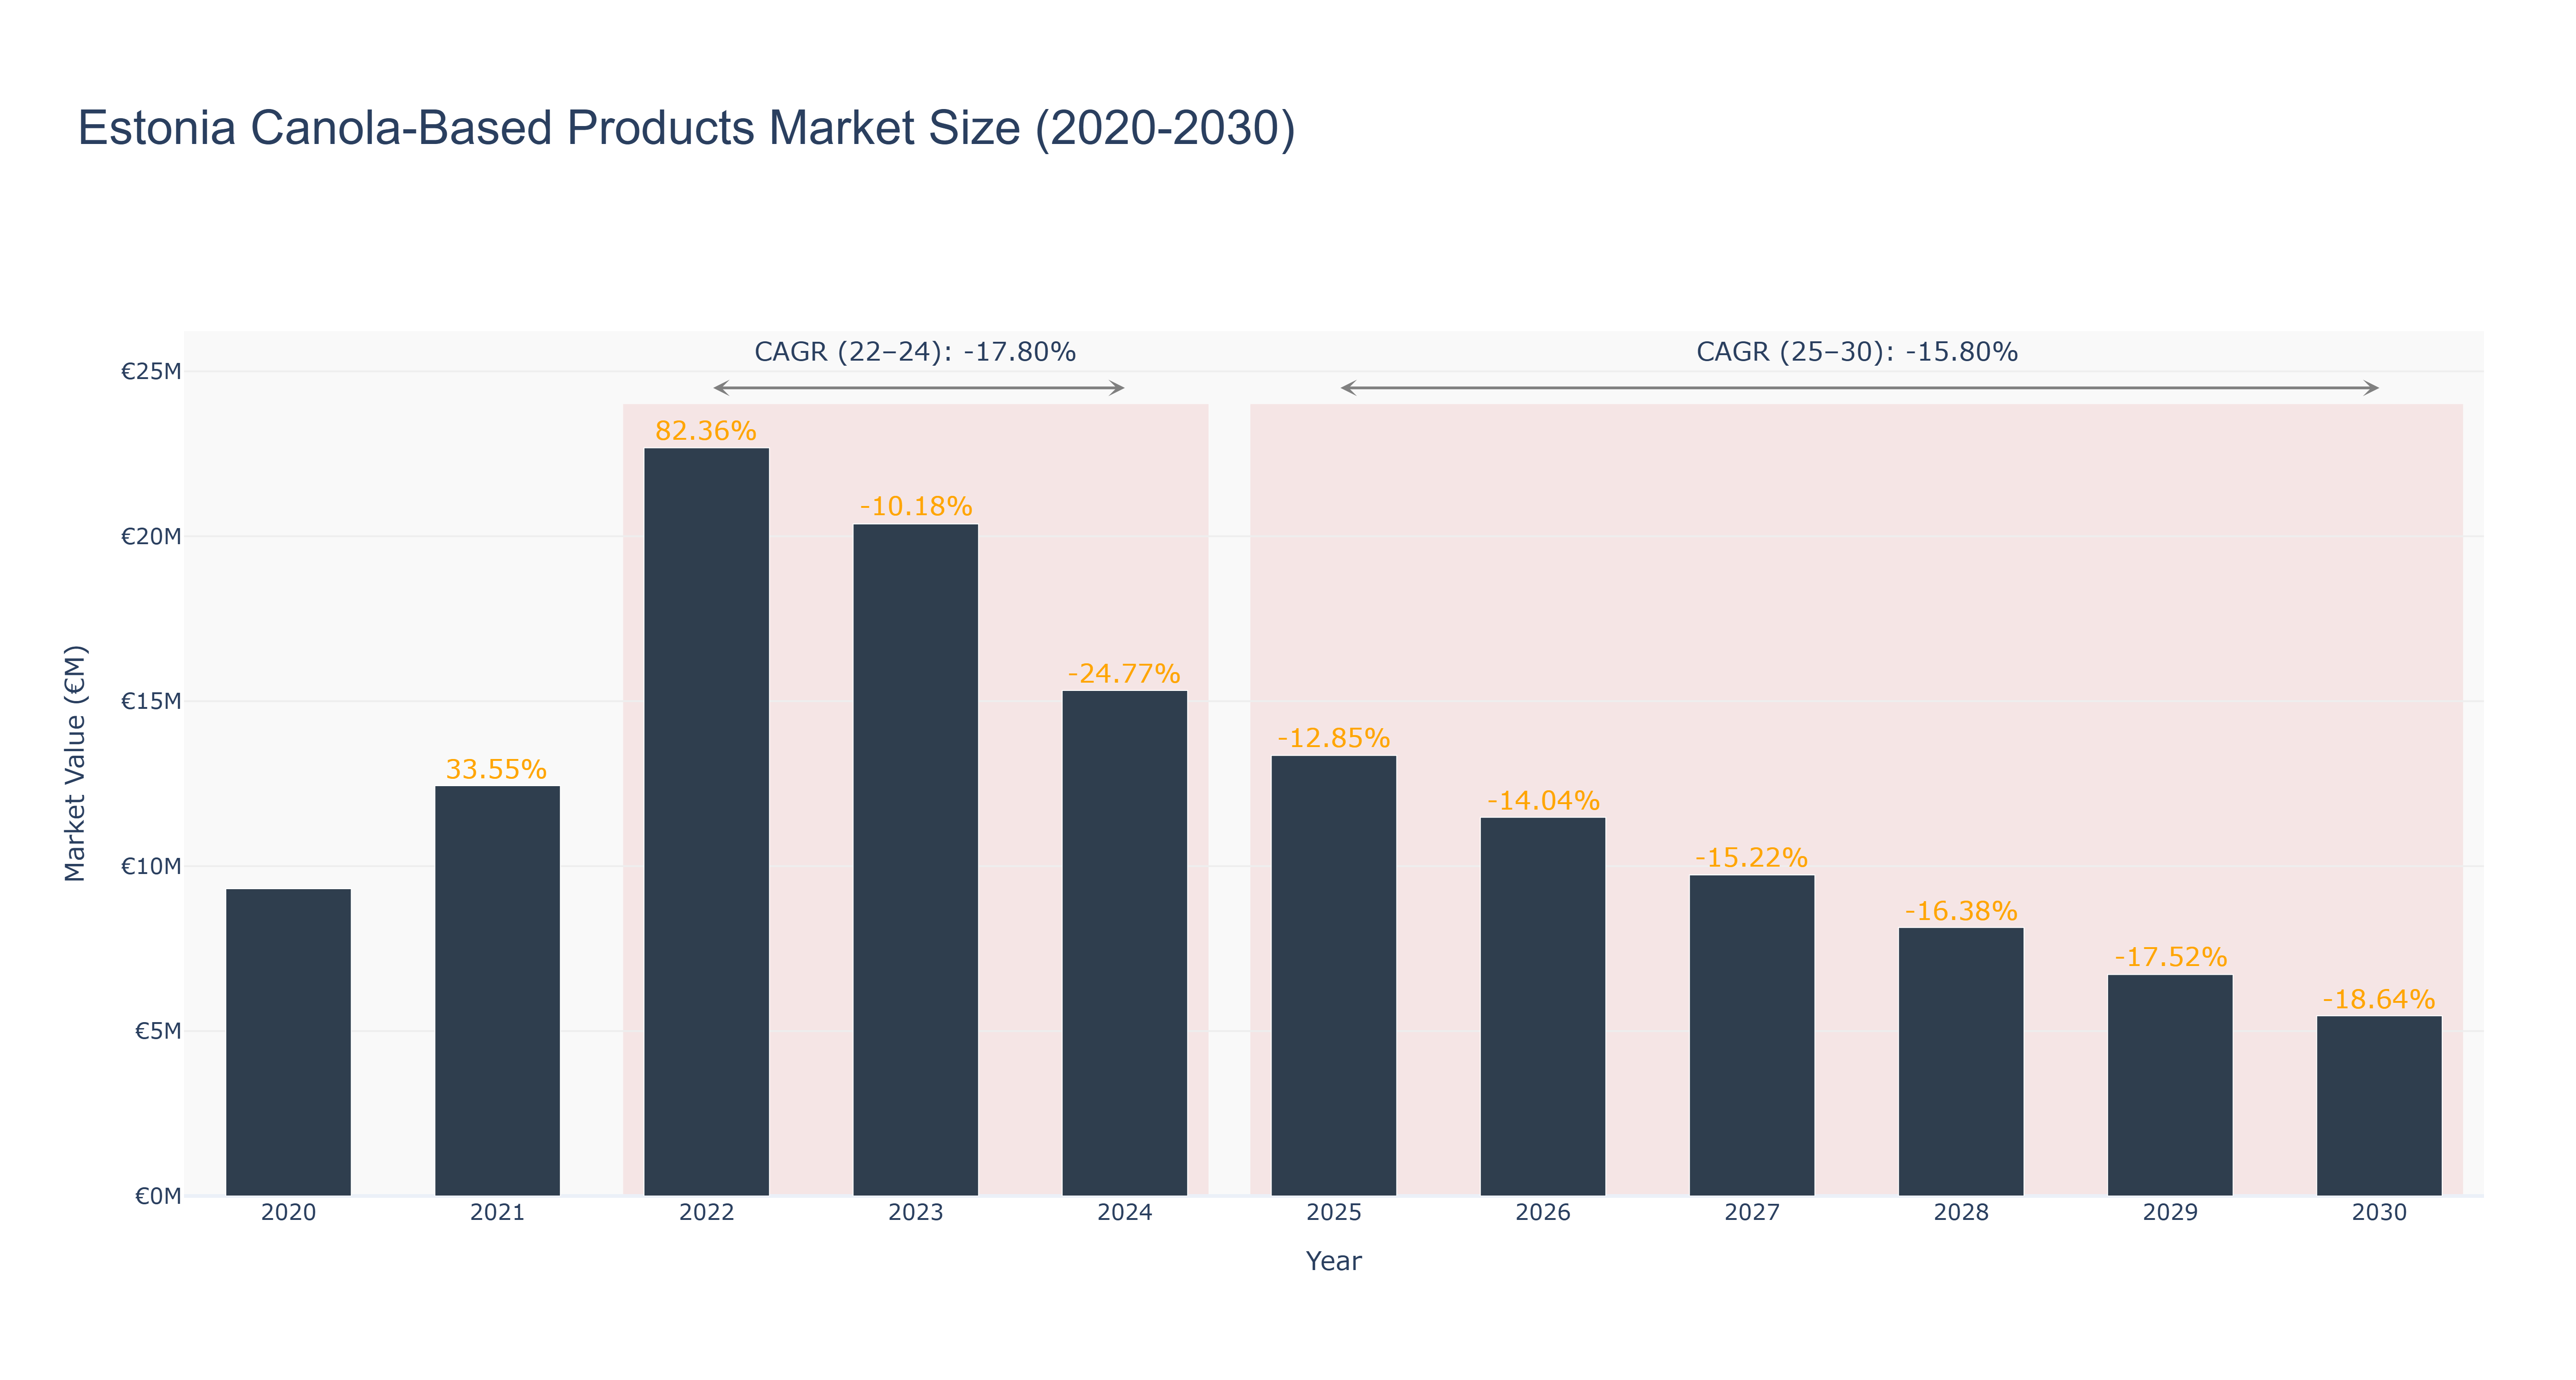
The Estonia Canola-Based Products Market experienced a peak size of €22.68 million in 2022, followed by a steady decline to €5.46 million in 2030. The actual market size decreased from €22.68 million in 2022 to €15.33 million in 2024, with a negative CAGR of -17.80% during this period. The forecasted market size is expected to continue declining from 2025 to 2030 with a CAGR of -15.80%. The market downturn can be attributed to changing consumer preferences, increased competition, and economic factors impacting the agriculture sector. Despite the challenging market conditions, upcoming sustainable farming initiatives and technological advancements in canola cultivation are expected to drive growth in the near future, positioning Estonia as a key player in the global canola-based products market.
Estonia Canola-Based Products Market: Production & Trade Performance (2019-2025)
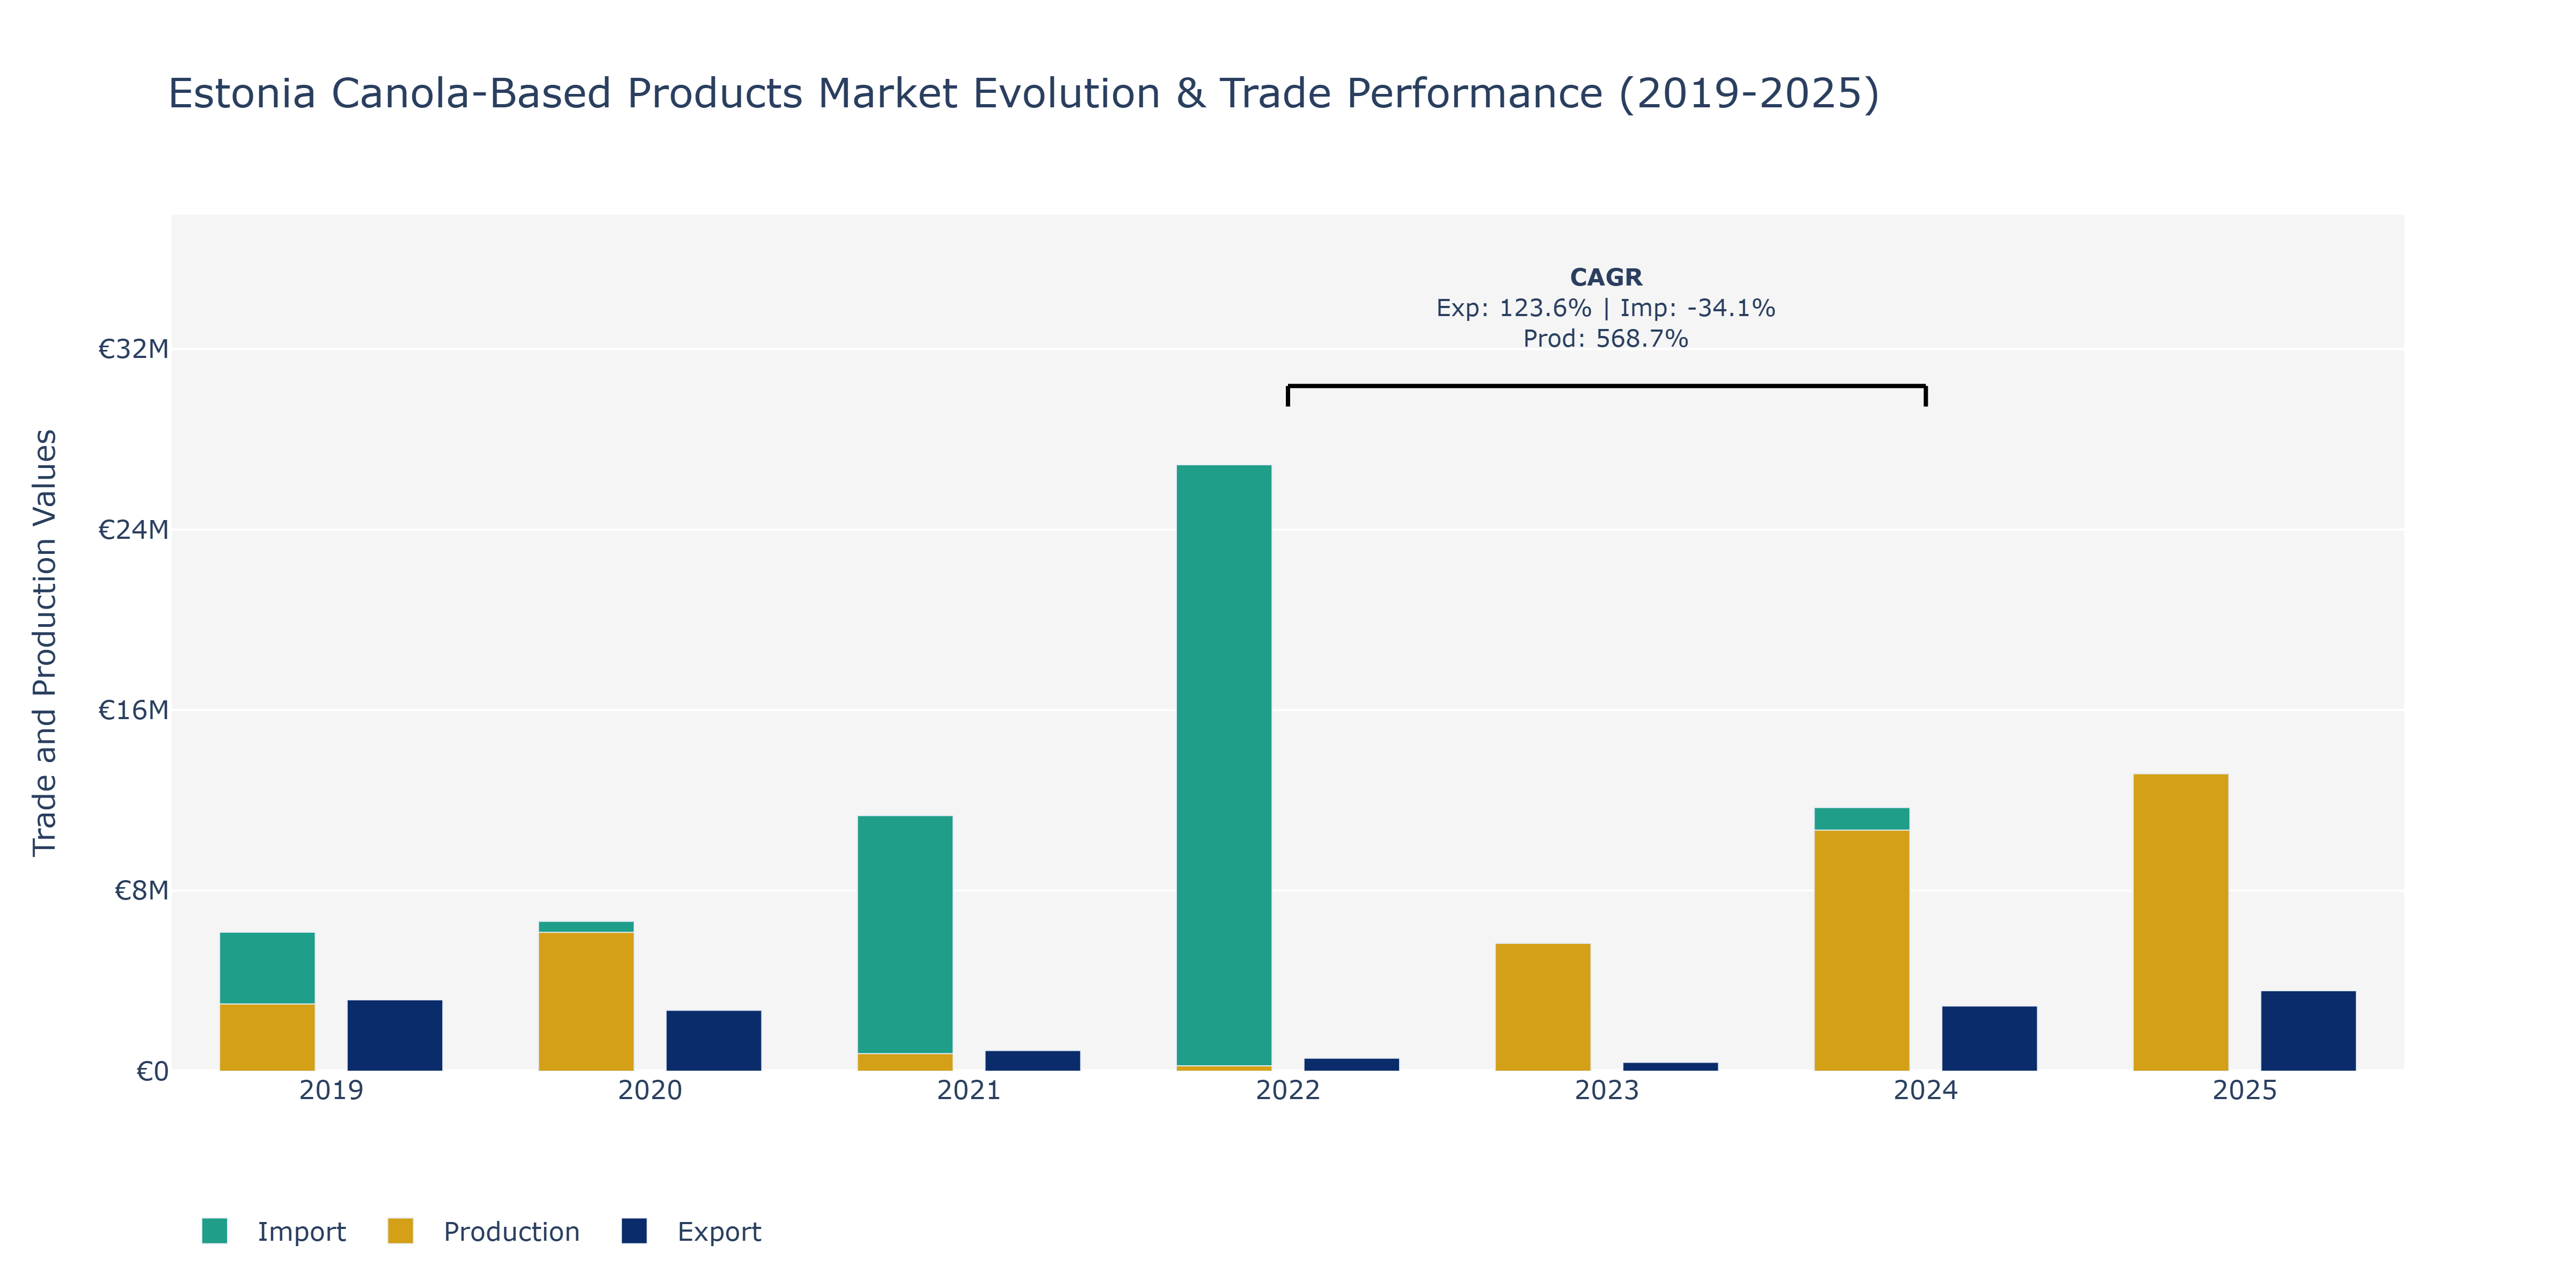
Between 2019 and 2025, the Estonia Canola-Based Products Market displayed dynamic trends in exports, imports, and production. Exports peaked at €3.57 million in 2025, showcasing a steady increase from 2019 levels of €3.16 million. In contrast, imports fluctuated notably, with a peak of €26.87 million in 2022 before decreasing to €8.78 million in 2025. Production also varied significantly, reaching €13.18 million in 2025 from €2.98 million in 2019. The surge in production can be attributed to technological advancements and increased demand for canola-based products globally. The fluctuating import levels may be linked to changing trade agreements or shifts in domestic consumption patterns. The decline in exports in 2021 and 2022 could be influenced by macroeconomic factors affecting global trade dynamics. To sustain growth and capitalize on market opportunities, stakeholders could focus on enhancing production efficiency and diversifying export destinations to mitigate the impacts of fluctuating import levels.
Key Highlights of the Report:
- Estonia Canola-based Products Market Outlook
- Market Size of Estonia Canola-based Products Market, 2025
- Forecast of Estonia Canola-based Products Market, 2032
- Historical Data and Forecast of Estonia Canola-based Products Revenues & Volume for the Period 2022 - 2032
- Estonia Canola-based Products Market Trend Evolution
- Estonia Canola-based Products Market Drivers and Challenges
- Estonia Canola-based Products Price Trends
- Estonia Canola-based Products Porter's Five Forces
- Estonia Canola-based Products Industry Life Cycle
- Historical Data and Forecast of Estonia Canola-based Products Market Revenues & Volume By Uses for the Period 2022 - 2032
- Historical Data and Forecast of Estonia Canola-based Products Market Revenues & Volume By High Protein Meal for the Period 2022 - 2032
- Historical Data and Forecast of Estonia Canola-based Products Market Revenues & Volume By BloFuel Feedstock for the Period 2022 - 2032
- Historical Data and Forecast of Estonia Canola-based Products Market Revenues & Volume By Packaging Type for the Period 2022 - 2032
- Historical Data and Forecast of Estonia Canola-based Products Market Revenues & Volume By Bottles for the Period 2022 - 2032
- Historical Data and Forecast of Estonia Canola-based Products Market Revenues & Volume By Cans for the Period 2022 - 2032
- Historical Data and Forecast of Estonia Canola-based Products Market Revenues & Volume By Drums for the Period 2022 - 2032
- Historical Data and Forecast of Estonia Canola-based Products Market Revenues & Volume By Pouches for the Period 2022 - 2032
- Historical Data and Forecast of Estonia Canola-based Products Market Revenues & Volume By Distribution Channel for the Period 2022 - 2032
- Historical Data and Forecast of Estonia Canola-based Products Market Revenues & Volume By Store- Based for the Period 2022 - 2032
- Historical Data and Forecast of Estonia Canola-based Products Market Revenues & Volume By Supermarkets and Hypermarkets for the Period 2022 - 2032
- Historical Data and Forecast of Estonia Canola-based Products Market Revenues & Volume By Convenience Stores for the Period 2022 - 2032
- Historical Data and Forecast of Estonia Canola-based Products Market Revenues & Volume By Non-Store Based for the Period 2022 - 2032
- Historical Data and Forecast of Estonia Canola-based Products Market Revenues & Volume By Application for the Period 2022 - 2032
- Historical Data and Forecast of Estonia Canola-based Products Market Revenues & Volume By Cooking for the Period 2022 - 2032
- Historical Data and Forecast of Estonia Canola-based Products Market Revenues & Volume By Processed Food for the Period 2022 - 2032
- Historical Data and Forecast of Estonia Canola-based Products Market Revenues & Volume By Lubricants for the Period 2022 - 2032
- Historical Data and Forecast of Estonia Canola-based Products Market Revenues & Volume By Personal Care for the Period 2022 - 2032
- Historical Data and Forecast of Estonia Canola-based Products Market Revenues & Volume By Biofuels for the Period 2022 - 2032
- Estonia Canola-based Products Import Export Trade Statistics
- Market Opportunity Assessment By Uses
- Market Opportunity Assessment By Packaging Type
- Market Opportunity Assessment By Distribution Channel
- Market Opportunity Assessment By Application
- Estonia Canola-based Products Top Companies Market Share
- Estonia Canola-based Products Competitive Benchmarking By Technical and Operational Parameters
- Estonia Canola-based Products Company Profiles
- Estonia Canola-based Products Key Strategic Recommendations
Frequently Asked Questions About the Market Study (FAQs):
6Wresearch actively monitors the Estonia Canola-based Products Market and publishes its comprehensive annual report, highlighting emerging trends, growth drivers, revenue analysis, and forecast outlook. Our insights help businesses to make data-backed strategic decisions with ongoing market dynamics. Our analysts track relevent industries related to the Estonia Canola-based Products Market, allowing our clients with actionable intelligence and reliable forecasts tailored to emerging regional needs.
Yes, we provide customisation as per your requirements. To learn more, feel free to contact us on sales@6wresearch.com
1 Executive Summary |
2 Introduction |
2.1 Key Highlights of the Report |
2.2 Report Description |
2.3 Market Scope & Segmentation |
2.4 Research Methodology |
2.5 Assumptions |
3 Estonia Canola-based Products Market Overview |
3.1 Estonia Country Macro Economic Indicators |
3.2 Estonia Canola-based Products Market Revenues & Volume, 2022 & 2032F |
3.3 Estonia Canola-based Products Market - Industry Life Cycle |
3.4 Estonia Canola-based Products Market - Porter's Five Forces |
3.5 Estonia Canola-based Products Market Revenues & Volume Share, By Uses, 2022 & 2032F |
3.6 Estonia Canola-based Products Market Revenues & Volume Share, By Packaging Type, 2022 & 2032F |
3.7 Estonia Canola-based Products Market Revenues & Volume Share, By Distribution Channel, 2022 & 2032F |
3.8 Estonia Canola-based Products Market Revenues & Volume Share, By Application, 2022 & 2032F |
4 Estonia Canola-based Products Market Dynamics |
4.1 Impact Analysis |
4.2 Market Drivers |
4.2.1 Increasing consumer awareness about the health benefits of canola-based products |
4.2.2 Growing demand for natural and organic food products |
4.2.3 Favorable government regulations promoting the production and consumption of canola-based products |
4.3 Market Restraints |
4.3.1 Price volatility of canola crops impacting product pricing |
4.3.2 Weather-related risks affecting canola production and supply |
4.3.3 Competition from other vegetable oils in the market |
5 Estonia Canola-based Products Market Trends |
6 Estonia Canola-based Products Market, By Types |
6.1 Estonia Canola-based Products Market, By Uses |
6.1.1 Overview and Analysis |
6.1.2 Estonia Canola-based Products Market Revenues & Volume, By Uses, 2022 - 2032F |
6.1.3 Estonia Canola-based Products Market Revenues & Volume, By High Protein Meal, 2022 - 2032F |
6.1.4 Estonia Canola-based Products Market Revenues & Volume, By BloFuel Feedstock, 2022 - 2032F |
6.2 Estonia Canola-based Products Market, By Packaging Type |
6.2.1 Overview and Analysis |
6.2.2 Estonia Canola-based Products Market Revenues & Volume, By Bottles, 2022 - 2032F |
6.2.3 Estonia Canola-based Products Market Revenues & Volume, By Cans, 2022 - 2032F |
6.2.4 Estonia Canola-based Products Market Revenues & Volume, By Drums, 2022 - 2032F |
6.2.5 Estonia Canola-based Products Market Revenues & Volume, By Pouches, 2022 - 2032F |
6.3 Estonia Canola-based Products Market, By Distribution Channel |
6.3.1 Overview and Analysis |
6.3.2 Estonia Canola-based Products Market Revenues & Volume, By Store- Based, 2022 - 2032F |
6.3.3 Estonia Canola-based Products Market Revenues & Volume, By Supermarkets and Hypermarkets, 2022 - 2032F |
6.3.4 Estonia Canola-based Products Market Revenues & Volume, By Convenience Stores, 2022 - 2032F |
6.3.5 Estonia Canola-based Products Market Revenues & Volume, By Non-Store Based, 2022 - 2032F |
6.4 Estonia Canola-based Products Market, By Application |
6.4.1 Overview and Analysis |
6.4.2 Estonia Canola-based Products Market Revenues & Volume, By Cooking, 2022 - 2032F |
6.4.3 Estonia Canola-based Products Market Revenues & Volume, By Processed Food, 2022 - 2032F |
6.4.4 Estonia Canola-based Products Market Revenues & Volume, By Lubricants, 2022 - 2032F |
6.4.5 Estonia Canola-based Products Market Revenues & Volume, By Personal Care, 2022 - 2032F |
6.4.6 Estonia Canola-based Products Market Revenues & Volume, By Biofuels, 2022 - 2032F |
7 Estonia Canola-based Products Market Import-Export Trade Statistics |
7.1 Estonia Canola-based Products Market Export to Major Countries |
7.2 Estonia Canola-based Products Market Imports from Major Countries |
8 Estonia Canola-based Products Market Key Performance Indicators |
8.1 Consumer preference and perception surveys regarding canola-based products |
8.2 Number of new product launches and innovations in the canola product category |
8.3 Adoption rate of canola-based products by food manufacturers and restaurants |
8.4 Sustainability practices in canola production and processing |
8.5 Investment trends in research and development for canola-based products |
9 Estonia Canola-based Products Market - Opportunity Assessment |
9.1 Estonia Canola-based Products Market Opportunity Assessment, By Uses, 2022 & 2032F |
9.2 Estonia Canola-based Products Market Opportunity Assessment, By Packaging Type, 2022 & 2032F |
9.3 Estonia Canola-based Products Market Opportunity Assessment, By Distribution Channel, 2022 & 2032F |
9.4 Estonia Canola-based Products Market Opportunity Assessment, By Application, 2022 & 2032F |
10 Estonia Canola-based Products Market - Competitive Landscape |
10.1 Estonia Canola-based Products Market Revenue Share, By Companies, 2025 |
10.2 Estonia Canola-based Products Market Competitive Benchmarking, By Operating and Technical Parameters |
11 Company Profiles |
12 Recommendations |
13 Disclaimer |
Export potential assessment - trade Analytics for 2030
Export potential enables firms to identify high-growth global markets with greater confidence by combining advanced trade intelligence with a structured quantitative methodology. The framework analyzes emerging demand trends and country-level import patterns while integrating macroeconomic and trade datasets such as GDP and population forecasts, bilateral import–export flows, tariff structures, elasticity differentials between developed and developing economies, geographic distance, and import demand projections. Using weighted trade values from 2020–2024 as the base period to project country-to-country export potential for 2030, these inputs are operationalized through calculated drivers such as gravity model parameters, tariff impact factors, and projected GDP per-capita growth. Through an analysis of hidden potentials, demand hotspots, and market conditions that are most favorable to success, this method enables firms to focus on target countries, maximize returns, and global expansion with data, backed by accuracy.
By factoring in the projected importer demand gap that is currently unmet and could be potential opportunity, it identifies the potential for the Exporter (Country) among 190 countries, against the general trade analysis, which identifies the biggest importer or exporter.
To discover high-growth global markets and optimize your business strategy:
Click Here
Pricing
- Single User License$ 1,995
- Department License$ 2,400
- Site License$ 3,120
- Global License$ 3,795

Search
Thought Leadership and Analyst Meet


Our Clients
Latest Reports
- India Ultrasonic Smart Water Meter Market (2026-2032) | Outlook, Competition, Drivers, Trends, Demand, Competitive, Strategic Insights, Companies, Challenges, Strategy, Consumer Insights, Analysis, Opportunities, Growth, Size, Share, Industry, Revenue, Segments, Value, Segmentation, Supply, Forecast, Restraints,
- India Electromagnetic Bulk Flow Meter Market (2026-2032) | Analysis, Challenges, Strategic Insights, Supply, Forecast, Growth, Share, Consumer Insights, Competitive, Value, Outlook, Size & Demand,
- India Battery Powered Bulk Flow Meter Market (2026-2032) | Outlook, Analysis, Competitive Landscape, Growth, Size, Trends, Value, Revenue, Companies, Segmentation, Share & Forecast
- Bosnia and Herzegovina Fuel-Efficient Winglets Market (2026-2032) | Growth, Competition, Strategy, Restraints, Trends, Challenges, segmentation, Value, Outlook, Investment Opportunities, Analysis, Revenue, Companies, Insights, Pricing, Size, Drivers, Demand, Share, Forecast
- Canada Cloud CFD Market (2026-2032) | Size & Revenue, Industry, Growth, Competitive Landscape, Forecast, Segmentation, Value, Outlook, Trends, Share, Analysis, Companies
- Taiwan Food Delivery Platform Market (2026-2032) | Companies, Outlook, Analysis, Trends, Value, Revenue, Segmentation, Share, Forecast, Competitive Landscape, Growth, Size & Forecast
- United Kingdom (UK) Long-term Care Insurance Market (2026-2032) | Growth, Share, Consumer Insights, Drivers, Opportunities, Competition, Pricing Analysis, Segments, Restraints, Companies, Competitive, Value, Outlook, Size, Demand, Analysis, Challenges, Strategic Insights, Investment Trends, Revenue, Trends, Supply, Forecast
- United Kingdom (UK) Long Term Care Market (2026-2032) | Companies, Outlook, Analysis, Trends, Value, Revenue, Segmentation, Share, Forecast, Competitive Landscape, Growth, Size & Forecast
- Iraq Insulation and Waterproofing Market (2026-2032) | Outlook, Drivers, Growth, Size, Share, Industry, Revenue, Trends, Demand, Competitive, Strategic Insights, Opportunities, Segments, Companies, Challenges, Strategy, Consumer Insights, Analysis, Investment Trends, Value, Segmentation, Forecast, Restraints
- India Switchgear Market Outlook (2026-2032) | Size, Share, Trends, Growth, Revenue, Forecast, Analysis, Value, Outlook
Industry Events and Analyst Meet

India EV Show 2026

EV tech India Expo 2026

Auto Tech Asia 2026

Battery Tech India 2026

Smart Production Solutions Guangzhou 2026
Whitepaper
- Middle East & Africa Commercial Security Market Click here to view more.
- Middle East & Africa Fire Safety Systems & Equipment Market Click here to view more.
- GCC Drone Market Click here to view more.
- Middle East Lighting Fixture Market Click here to view more.
- GCC Physical & Perimeter Security Market Click here to view more.
6WResearch In News
- Doha a strategic location for EV manufacturing hub: IPA Qatar
- Demand for luxury TVs surging in the GCC, says Samsung
- Empowering Growth: The Thriving Journey of Bangladesh’s Cable Industry
- Demand for luxury TVs surging in the GCC, says Samsung
- Video call with a traditional healer? Once unthinkable, it’s now common in South Africa
- Intelligent Buildings To Smooth GCC’s Path To Net Zero