Estonia Marine Ingredients Market (2026-2032) | Supply, Pricing Analysis, Companies, Demand, Growth, Forecast, Drivers, Segments, Segmentation, Challenges, Analysis, Strategy, Restraints, Strategic Insights, Revenue, Competition, Investment Trends, Competitive, Size, Opportunities, Trends, Consumer Insights, Industry, Value, Share, Outlook
Market Forecast By Type (Fish Protein, Omega-3 Oils, Marine Collagen), By Source (Fish, Marine Algae, Shellfish), By Application (Supplements, Pharmaceuticals, Cosmetics), By End User (Food Industry, Healthcare, Beauty & Personal Care) And Competitive Landscape
| Product Code: ETC12919071 | Publication Date: Apr 2025 | Updated Date: Apr 2026 | Product Type: Market Research Report | |
| Publisher: 6Wresearch | Author: Sachin Kumar Rai | No. of Pages: 65 | No. of Figures: 34 | No. of Tables: 19 |
Estonia Marine Ingredients Market Size (2020-2030)
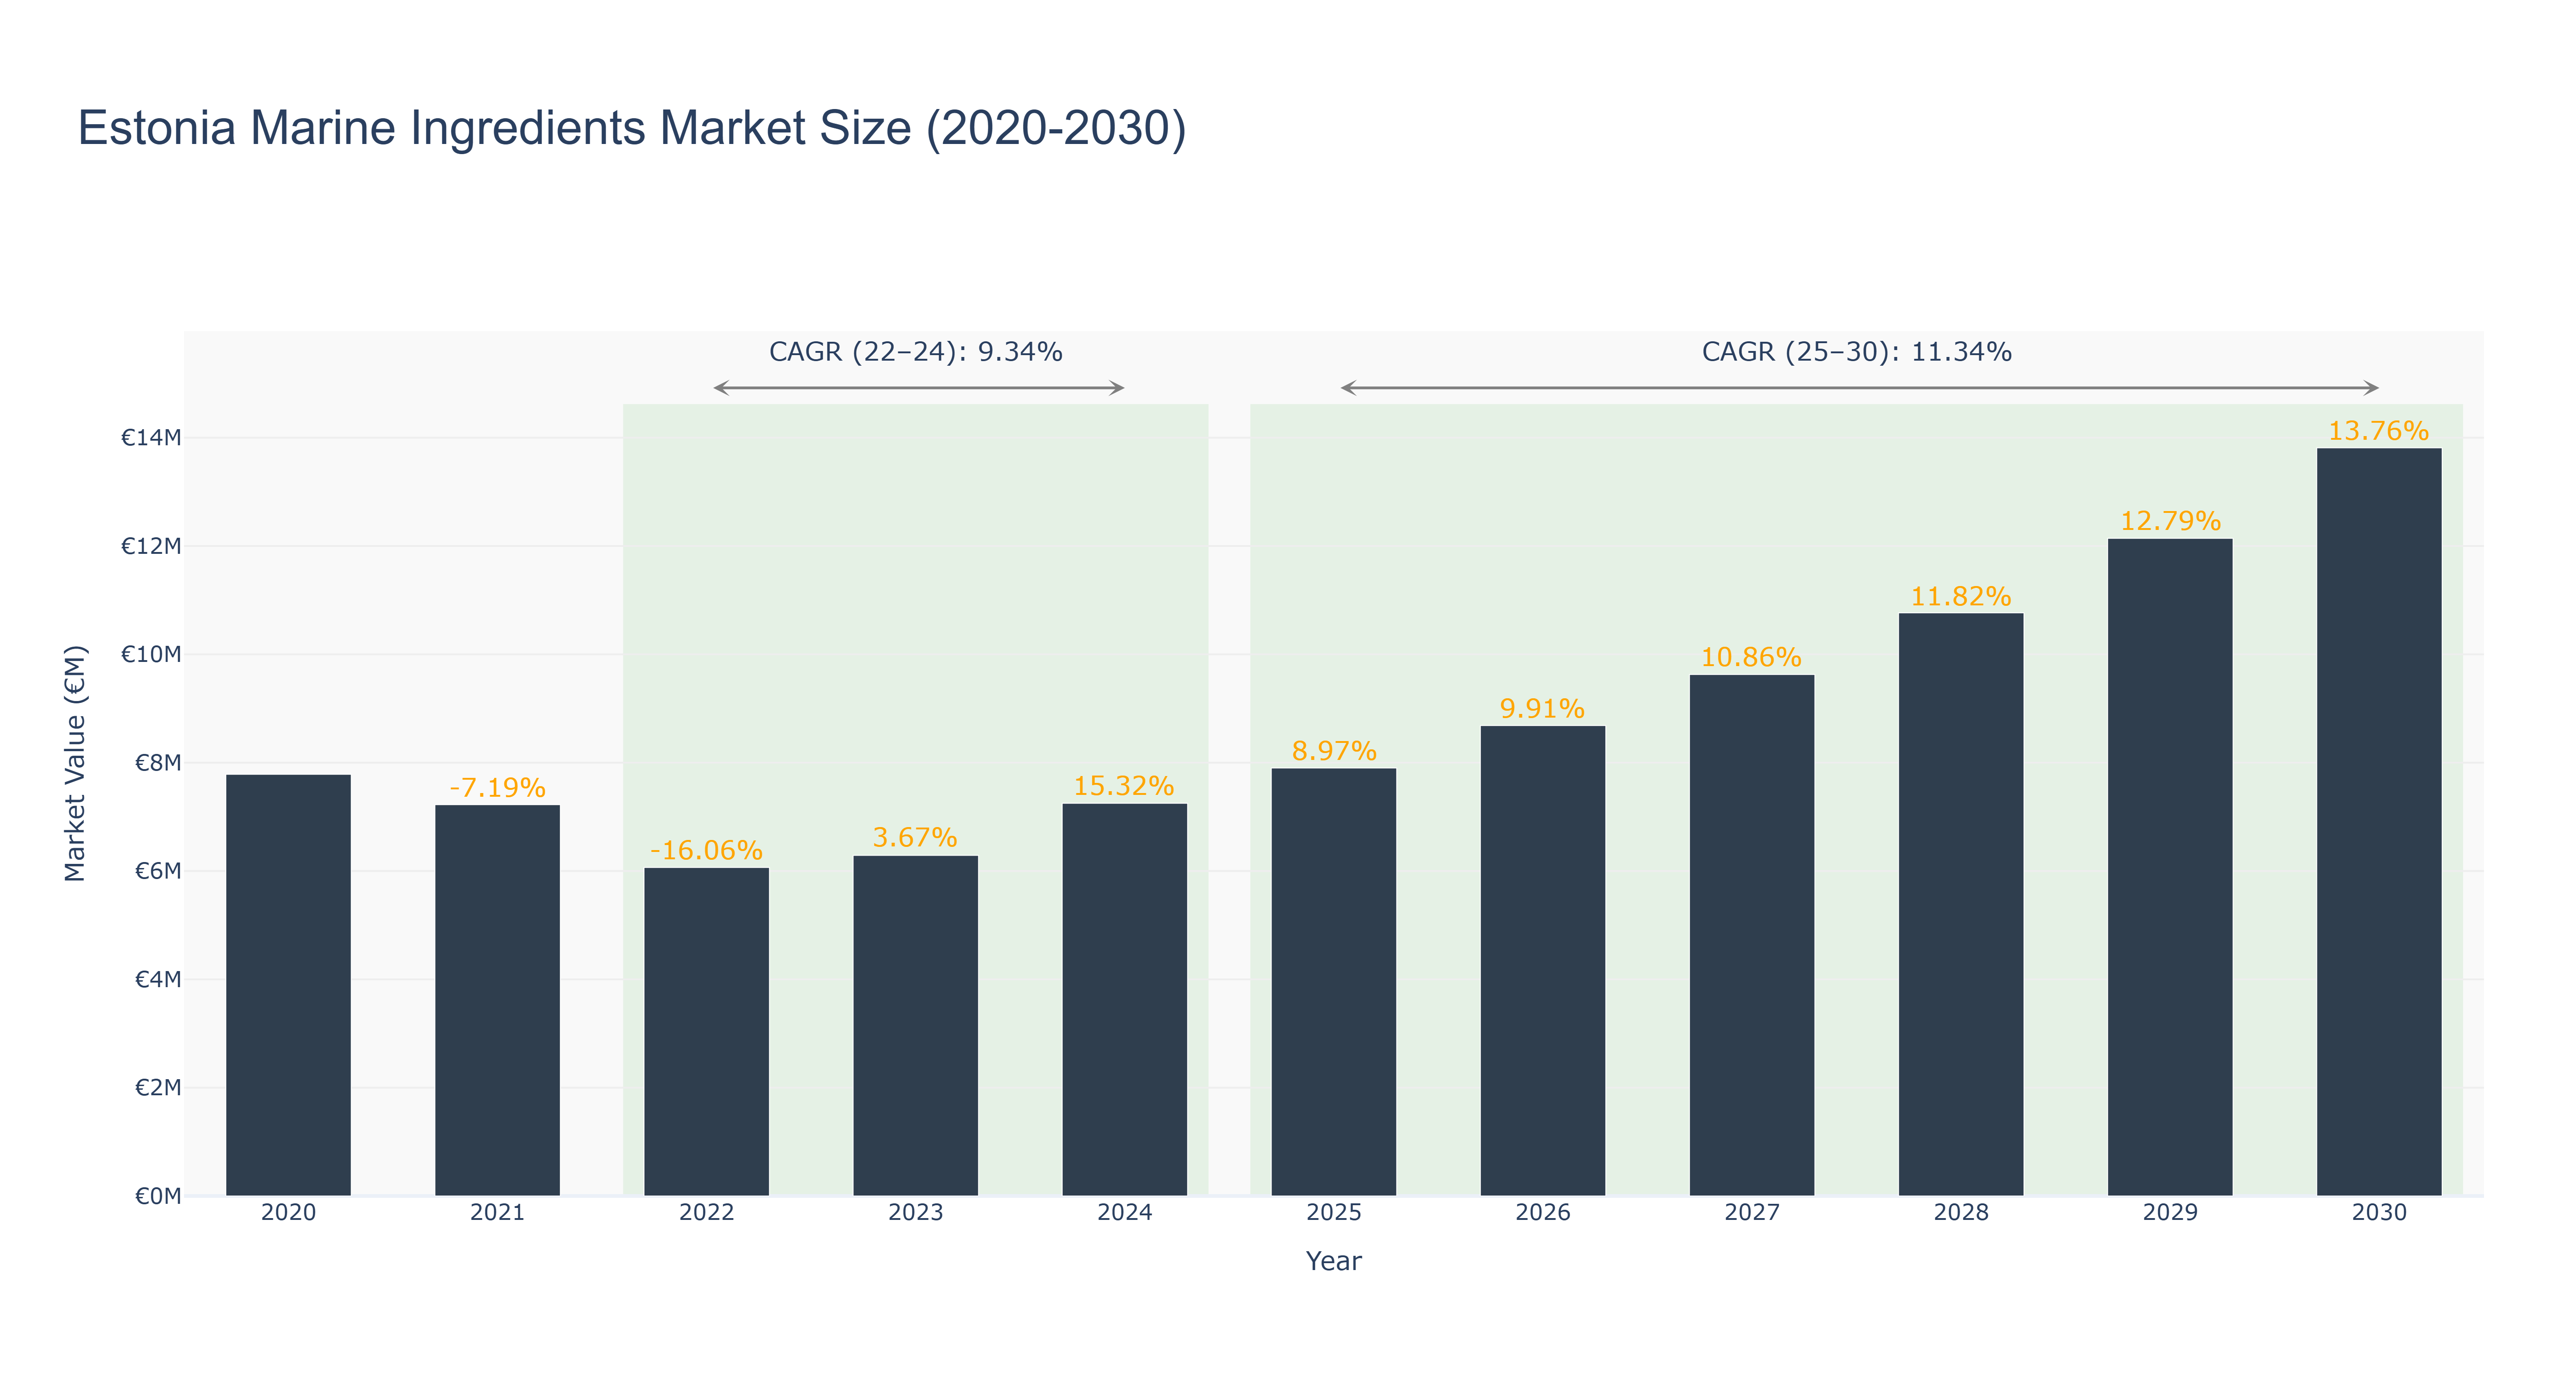
Estonia Marine Ingredients Market has shown a notable trend over the years. The peak market size of €13.81 million is forecasted for 2030, with impressive growth rates. From 2020 to 2024, the market size saw a decline before rebounding, reflecting market fluctuations and potential industry challenges during that period. The forecasted growth from 2025 to 2030 indicates a steady upward trajectory, driven by increasing demand for marine ingredients in various sectors. The CAGR values of 9.34% (2022-24) and 11.34% (2025-30) further highlight the market's resilience and potential for sustained growth. Recent developments in sustainable sourcing and innovative product offerings are expected to drive further market expansion, positioning Estonia as a key player in the marine ingredients industry.
Estonia Marine Ingredients Market: Production & Trade Performance (2019-2025)
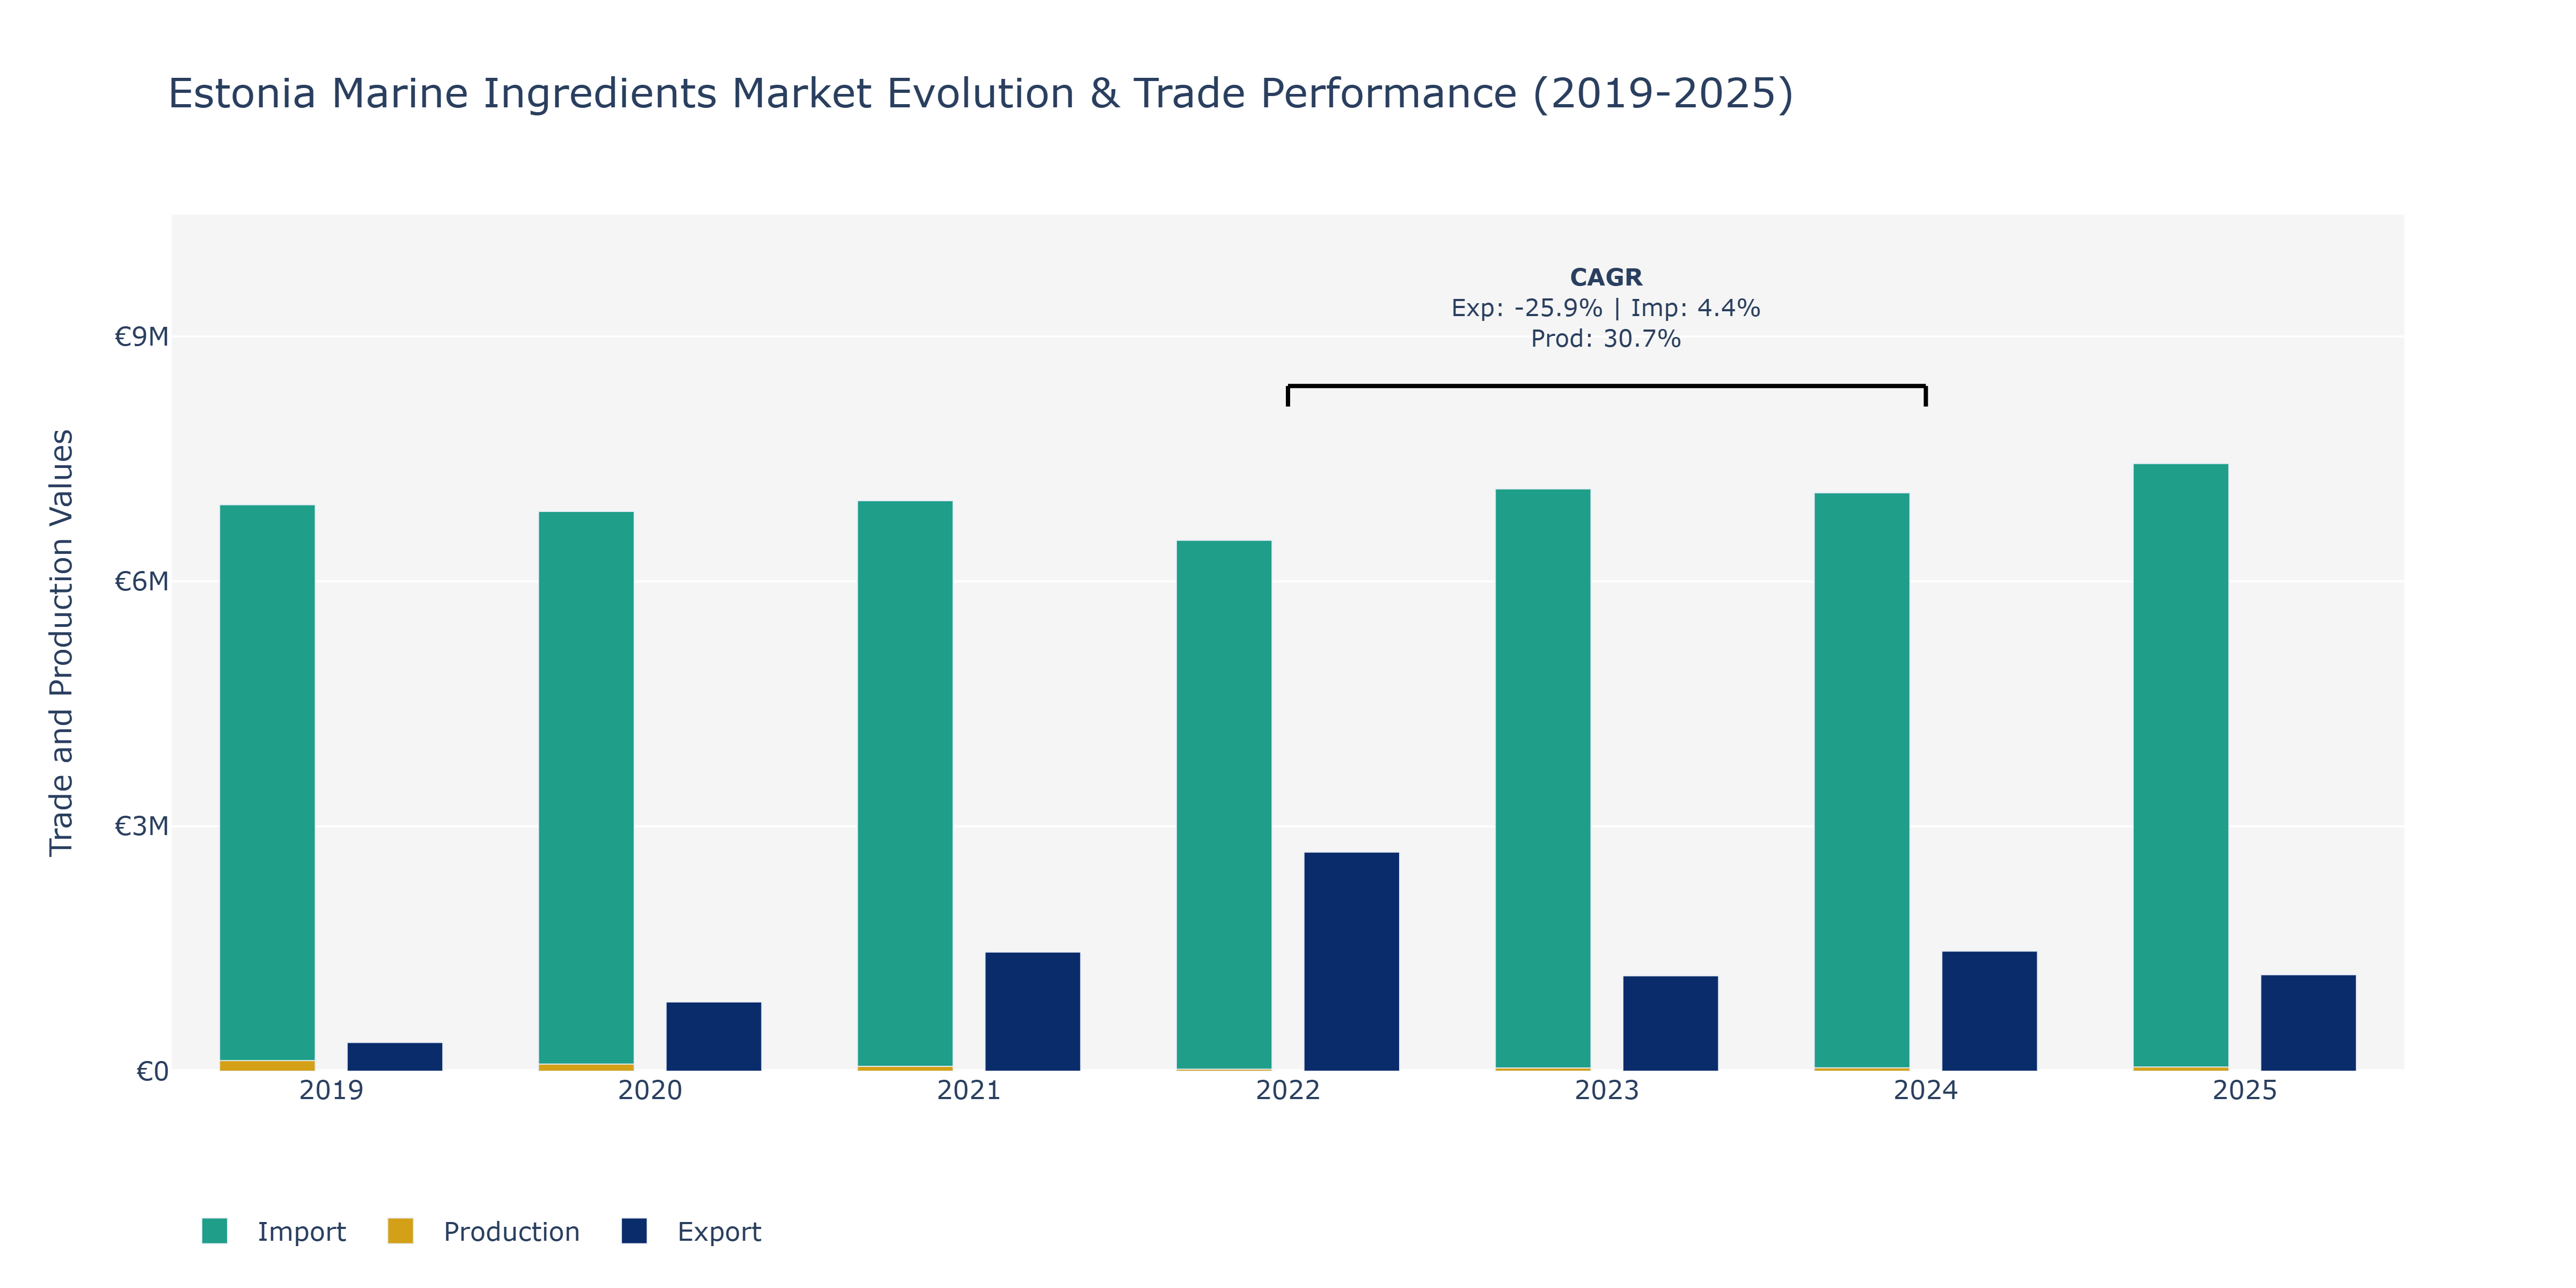
In the Estonia Marine Ingredients Market, exports experienced an upward trajectory from 2019 to 2022, peaking at €2.68 million in 2022 before decreasing in subsequent years. Imports remained relatively stable around €6.5 million to €7.1 million from 2020 to 2023, with a slight decline in 2024. Production levels fluctuated, with a notable increase to €59 million in 2021, followed by a decrease in the following years. These trends could be attributed to various factors, such as changes in global demand for marine ingredients, shifts in international trade agreements affecting import levels, and domestic production capacity adjustments. The decrease in exports post-2022 could be influenced by market saturation or intensified competition. To sustain market competitiveness, stakeholders may consider diversifying product offerings or enhancing operational efficiencies to capitalize on the growing demand for marine ingredients in the food and pharmaceutical industries.
Key Highlights of the Report:
- Estonia Marine Ingredients Market Outlook
- Market Size of Estonia Marine Ingredients Market, 2025
- Forecast of Estonia Marine Ingredients Market, 2032
- Historical Data and Forecast of Estonia Marine Ingredients Revenues & Volume for the Period 2022 - 2032F
- Estonia Marine Ingredients Market Trend Evolution
- Estonia Marine Ingredients Market Drivers and Challenges
- Estonia Marine Ingredients Price Trends
- Estonia Marine Ingredients Porter's Five Forces
- Estonia Marine Ingredients Industry Life Cycle
- Historical Data and Forecast of Estonia Marine Ingredients Market Revenues & Volume By Type for the Period 2022 - 2032F
- Historical Data and Forecast of Estonia Marine Ingredients Market Revenues & Volume By Fish Protein for the Period 2022 - 2032F
- Historical Data and Forecast of Estonia Marine Ingredients Market Revenues & Volume By Omega-3 Oils for the Period 2022 - 2032F
- Historical Data and Forecast of Estonia Marine Ingredients Market Revenues & Volume By Marine Collagen for the Period 2022 - 2032F
- Historical Data and Forecast of Estonia Marine Ingredients Market Revenues & Volume By Source for the Period 2022 - 2032F
- Historical Data and Forecast of Estonia Marine Ingredients Market Revenues & Volume By Fish for the Period 2022 - 2032F
- Historical Data and Forecast of Estonia Marine Ingredients Market Revenues & Volume By Marine Algae for the Period 2022 - 2032F
- Historical Data and Forecast of Estonia Marine Ingredients Market Revenues & Volume By Shellfish for the Period 2022 - 2032F
- Historical Data and Forecast of Estonia Marine Ingredients Market Revenues & Volume By Application for the Period 2022 - 2032F
- Historical Data and Forecast of Estonia Marine Ingredients Market Revenues & Volume By Supplements for the Period 2022 - 2032F
- Historical Data and Forecast of Estonia Marine Ingredients Market Revenues & Volume By Pharmaceuticals for the Period 2022 - 2032F
- Historical Data and Forecast of Estonia Marine Ingredients Market Revenues & Volume By Cosmetics for the Period 2022 - 2032F
- Historical Data and Forecast of Estonia Marine Ingredients Market Revenues & Volume By End User for the Period 2022 - 2032F
- Historical Data and Forecast of Estonia Marine Ingredients Market Revenues & Volume By Food Industry for the Period 2022 - 2032F
- Historical Data and Forecast of Estonia Marine Ingredients Market Revenues & Volume By Healthcare for the Period 2022 - 2032F
- Historical Data and Forecast of Estonia Marine Ingredients Market Revenues & Volume By Beauty & Personal Care for the Period 2022 - 2032F
- Estonia Marine Ingredients Import Export Trade Statistics
- Market Opportunity Assessment By Type
- Market Opportunity Assessment By Source
- Market Opportunity Assessment By Application
- Market Opportunity Assessment By End User
- Estonia Marine Ingredients Top Companies Market Share
- Estonia Marine Ingredients Competitive Benchmarking By Technical and Operational Parameters
- Estonia Marine Ingredients Company Profiles
- Estonia Marine Ingredients Key Strategic Recommendations
Frequently Asked Questions About the Market Study (FAQs):
6Wresearch actively monitors the Estonia Marine Ingredients Market and publishes its comprehensive annual report, highlighting emerging trends, growth drivers, revenue analysis, and forecast outlook. Our insights help businesses to make data-backed strategic decisions with ongoing market dynamics. Our analysts track relevent industries related to the Estonia Marine Ingredients Market, allowing our clients with actionable intelligence and reliable forecasts tailored to emerging regional needs.
Yes, we provide customisation as per your requirements. To learn more, feel free to contact us on sales@6wresearch.com
1 Executive Summary |
2 Introduction |
2.1 Key Highlights of the Report |
2.2 Report Description |
2.3 Market Scope & Segmentation |
2.4 Research Methodology |
2.5 Assumptions |
3 Estonia Marine Ingredients Market Overview |
3.1 Estonia Country Macro Economic Indicators |
3.2 Estonia Marine Ingredients Market Revenues & Volume, 2022 & 2032F |
3.3 Estonia Marine Ingredients Market - Industry Life Cycle |
3.4 Estonia Marine Ingredients Market - Porter's Five Forces |
3.5 Estonia Marine Ingredients Market Revenues & Volume Share, By Type, 2022 & 2032F |
3.6 Estonia Marine Ingredients Market Revenues & Volume Share, By Source, 2022 & 2032F |
3.7 Estonia Marine Ingredients Market Revenues & Volume Share, By Application, 2022 & 2032F |
3.8 Estonia Marine Ingredients Market Revenues & Volume Share, By End User, 2022 & 2032F |
4 Estonia Marine Ingredients Market Dynamics |
4.1 Impact Analysis |
4.2 Market Drivers |
4.2.1 Increasing consumer awareness about the health benefits of marine ingredients |
4.2.2 Growing demand for natural and sustainable ingredients in food and cosmetic industries |
4.2.3 Rising popularity of functional food and dietary supplements containing marine ingredients |
4.3 Market Restraints |
4.3.1 Seasonal fluctuations in availability and supply of marine ingredients |
4.3.2 Regulatory challenges related to marine ingredient sourcing and processing |
4.3.3 Competition from alternative sources of ingredients such as plant-based substitutes |
5 Estonia Marine Ingredients Market Trends |
6 Estonia Marine Ingredients Market, By Types |
6.1 Estonia Marine Ingredients Market, By Type |
6.1.1 Overview and Analysis |
6.1.2 Estonia Marine Ingredients Market Revenues & Volume, By Type, 2022 - 2032F |
6.1.3 Estonia Marine Ingredients Market Revenues & Volume, By Fish Protein, 2022 - 2032F |
6.1.4 Estonia Marine Ingredients Market Revenues & Volume, By Omega-3 Oils, 2022 - 2032F |
6.1.5 Estonia Marine Ingredients Market Revenues & Volume, By Marine Collagen, 2022 - 2032F |
6.2 Estonia Marine Ingredients Market, By Source |
6.2.1 Overview and Analysis |
6.2.2 Estonia Marine Ingredients Market Revenues & Volume, By Fish, 2022 - 2032F |
6.2.3 Estonia Marine Ingredients Market Revenues & Volume, By Marine Algae, 2022 - 2032F |
6.2.4 Estonia Marine Ingredients Market Revenues & Volume, By Shellfish, 2022 - 2032F |
6.3 Estonia Marine Ingredients Market, By Application |
6.3.1 Overview and Analysis |
6.3.2 Estonia Marine Ingredients Market Revenues & Volume, By Supplements, 2022 - 2032F |
6.3.3 Estonia Marine Ingredients Market Revenues & Volume, By Pharmaceuticals, 2022 - 2032F |
6.3.4 Estonia Marine Ingredients Market Revenues & Volume, By Cosmetics, 2022 - 2032F |
6.4 Estonia Marine Ingredients Market, By End User |
6.4.1 Overview and Analysis |
6.4.2 Estonia Marine Ingredients Market Revenues & Volume, By Food Industry, 2022 - 2032F |
6.4.3 Estonia Marine Ingredients Market Revenues & Volume, By Healthcare, 2022 - 2032F |
6.4.4 Estonia Marine Ingredients Market Revenues & Volume, By Beauty & Personal Care, 2022 - 2032F |
7 Estonia Marine Ingredients Market Import-Export Trade Statistics |
7.1 Estonia Marine Ingredients Market Export to Major Countries |
7.2 Estonia Marine Ingredients Market Imports from Major Countries |
8 Estonia Marine Ingredients Market Key Performance Indicators |
8.1 Sustainability metrics related to responsible sourcing and harvesting practices |
8.2 Quality control measures to ensure the purity and efficacy of marine ingredients |
8.3 Research and development investment in innovative marine ingredient products |
9 Estonia Marine Ingredients Market - Opportunity Assessment |
9.1 Estonia Marine Ingredients Market Opportunity Assessment, By Type, 2022 & 2032F |
9.2 Estonia Marine Ingredients Market Opportunity Assessment, By Source, 2022 & 2032F |
9.3 Estonia Marine Ingredients Market Opportunity Assessment, By Application, 2022 & 2032F |
9.4 Estonia Marine Ingredients Market Opportunity Assessment, By End User, 2022 & 2032F |
10 Estonia Marine Ingredients Market - Competitive Landscape |
10.1 Estonia Marine Ingredients Market Revenue Share, By Companies, 2025 |
10.2 Estonia Marine Ingredients Market Competitive Benchmarking, By Operating and Technical Parameters |
11 Company Profiles |
12 Recommendations |
13 Disclaimer |
Export potential assessment - trade Analytics for 2030
Export potential enables firms to identify high-growth global markets with greater confidence by combining advanced trade intelligence with a structured quantitative methodology. The framework analyzes emerging demand trends and country-level import patterns while integrating macroeconomic and trade datasets such as GDP and population forecasts, bilateral import–export flows, tariff structures, elasticity differentials between developed and developing economies, geographic distance, and import demand projections. Using weighted trade values from 2020–2024 as the base period to project country-to-country export potential for 2030, these inputs are operationalized through calculated drivers such as gravity model parameters, tariff impact factors, and projected GDP per-capita growth. Through an analysis of hidden potentials, demand hotspots, and market conditions that are most favorable to success, this method enables firms to focus on target countries, maximize returns, and global expansion with data, backed by accuracy.
By factoring in the projected importer demand gap that is currently unmet and could be potential opportunity, it identifies the potential for the Exporter (Country) among 190 countries, against the general trade analysis, which identifies the biggest importer or exporter.
To discover high-growth global markets and optimize your business strategy:
Click Here
Pricing
- Single User License$ 1,995
- Department License$ 2,400
- Site License$ 3,120
- Global License$ 3,795

Search
Thought Leadership and Analyst Meet


Our Clients
Latest Reports
- Canada Cloud CFD Market (2026-2032) | Size & Revenue, Industry, Growth, Competitive Landscape, Forecast, Segmentation, Value, Outlook, Trends, Share, Analysis, Companies
- Taiwan Food Delivery Platform Market (2026-2032) | Companies, Outlook, Analysis, Trends, Value, Revenue, Segmentation, Share, Forecast, Competitive Landscape, Growth, Size & Forecast
- United Kingdom (UK) Long-term Care Insurance Market (2026-2032) | Growth, Share, Consumer Insights, Drivers, Opportunities, Competition, Pricing Analysis, Segments, Restraints, Companies, Competitive, Value, Outlook, Size, Demand, Analysis, Challenges, Strategic Insights, Investment Trends, Revenue, Trends, Supply, Forecast
- United Kingdom (UK) Long Term Care Market (2026-2032) | Companies, Outlook, Analysis, Trends, Value, Revenue, Segmentation, Share, Forecast, Competitive Landscape, Growth, Size & Forecast
- Iraq Insulation and Waterproofing Market (2026-2032) | Outlook, Drivers, Growth, Size, Share, Industry, Revenue, Trends, Demand, Competitive, Strategic Insights, Opportunities, Segments, Companies, Challenges, Strategy, Consumer Insights, Analysis, Investment Trends, Value, Segmentation, Forecast, Restraints
- India Switchgear Market Outlook (2026-2032) | Size, Share, Trends, Growth, Revenue, Forecast, Analysis, Value, Outlook
- Pakistan Contraceptive Implants Market (2025-2031) | Demand, Growth, Size, Share, Industry, Pricing Analysis, Competitive, Strategic Insights, Strategy, Consumer Insights, Analysis, Investment Trends, Opportunities, Revenue, Segments, Value, Segmentation, Supply, Forecast, Restraints, Outlook, Competition, Drivers, Trends, Companies, Challenges
- Sri Lanka Packaging Market (2026-2032) | Outlook, Competition, Drivers, Trends, Demand, Pricing Analysis, Competitive, Strategic Insights, Companies, Challenges, Strategy, Consumer Insights, Analysis, Investment Trends, Opportunities, Growth, Size, Share, Industry, Revenue, Segments, Value, Segmentation, Supply, Forecast, Restraints
- India Kids Watches Market (2026-2032) | Strategy, Consumer Insights, Analysis, Investment Trends, Opportunities, Growth, Size, Share, Industry, Revenue, Segments, Value, Segmentation, Supply, Forecast, Restraints, Outlook, Competition, Drivers, Trends, Demand, Pricing Analysis, Competitive, Strategic Insights, Companies, Challenges
- Saudi Arabia Core Assurance Service Market (2025-2031) | Strategy, Consumer Insights, Analysis, Investment Trends, Opportunities, Growth, Size, Share, Industry, Revenue, Segments, Value, Segmentation, Supply, Forecast, Restraints, Outlook, Competition, Drivers, Trends, Demand, Pricing Analysis, Competitive, Strategic Insights, Companies, Challenges
Industry Events and Analyst Meet

India EV Show 2026

EV tech India Expo 2026

Auto Tech Asia 2026

Battery Tech India 2026

Smart Production Solutions Guangzhou 2026
Whitepaper
- Middle East & Africa Commercial Security Market Click here to view more.
- Middle East & Africa Fire Safety Systems & Equipment Market Click here to view more.
- GCC Drone Market Click here to view more.
- Middle East Lighting Fixture Market Click here to view more.
- GCC Physical & Perimeter Security Market Click here to view more.
6WResearch In News
- Doha a strategic location for EV manufacturing hub: IPA Qatar
- Demand for luxury TVs surging in the GCC, says Samsung
- Empowering Growth: The Thriving Journey of Bangladesh’s Cable Industry
- Demand for luxury TVs surging in the GCC, says Samsung
- Video call with a traditional healer? Once unthinkable, it’s now common in South Africa
- Intelligent Buildings To Smooth GCC’s Path To Net Zero