Finland Marine Ingredients Market (2026-2032) | Drivers, Growth, Forecast, Companies, Industry, Share, Demand, Supply, Strategy, Restraints, Investment Trends, Value, Pricing Analysis, Trends, Segments, Revenue, Analysis, Size, Strategic Insights, Opportunities, Outlook, Competitive, Challenges, Competition, Segmentation, Consumer Insights
Market Forecast By Type (Fish Protein, Omega-3 Oils, Marine Collagen), By Source (Fish, Marine Algae, Shellfish), By Application (Supplements, Pharmaceuticals, Cosmetics), By End User (Food Industry, Healthcare, Beauty & Personal Care) And Competitive Landscape
| Product Code: ETC12919074 | Publication Date: Apr 2025 | Updated Date: Apr 2026 | Product Type: Market Research Report | |
| Publisher: 6Wresearch | Author: Sachin Kumar Rai | No. of Pages: 65 | No. of Figures: 34 | No. of Tables: 19 |
Finland Marine Ingredients Market Size (2020-2030)
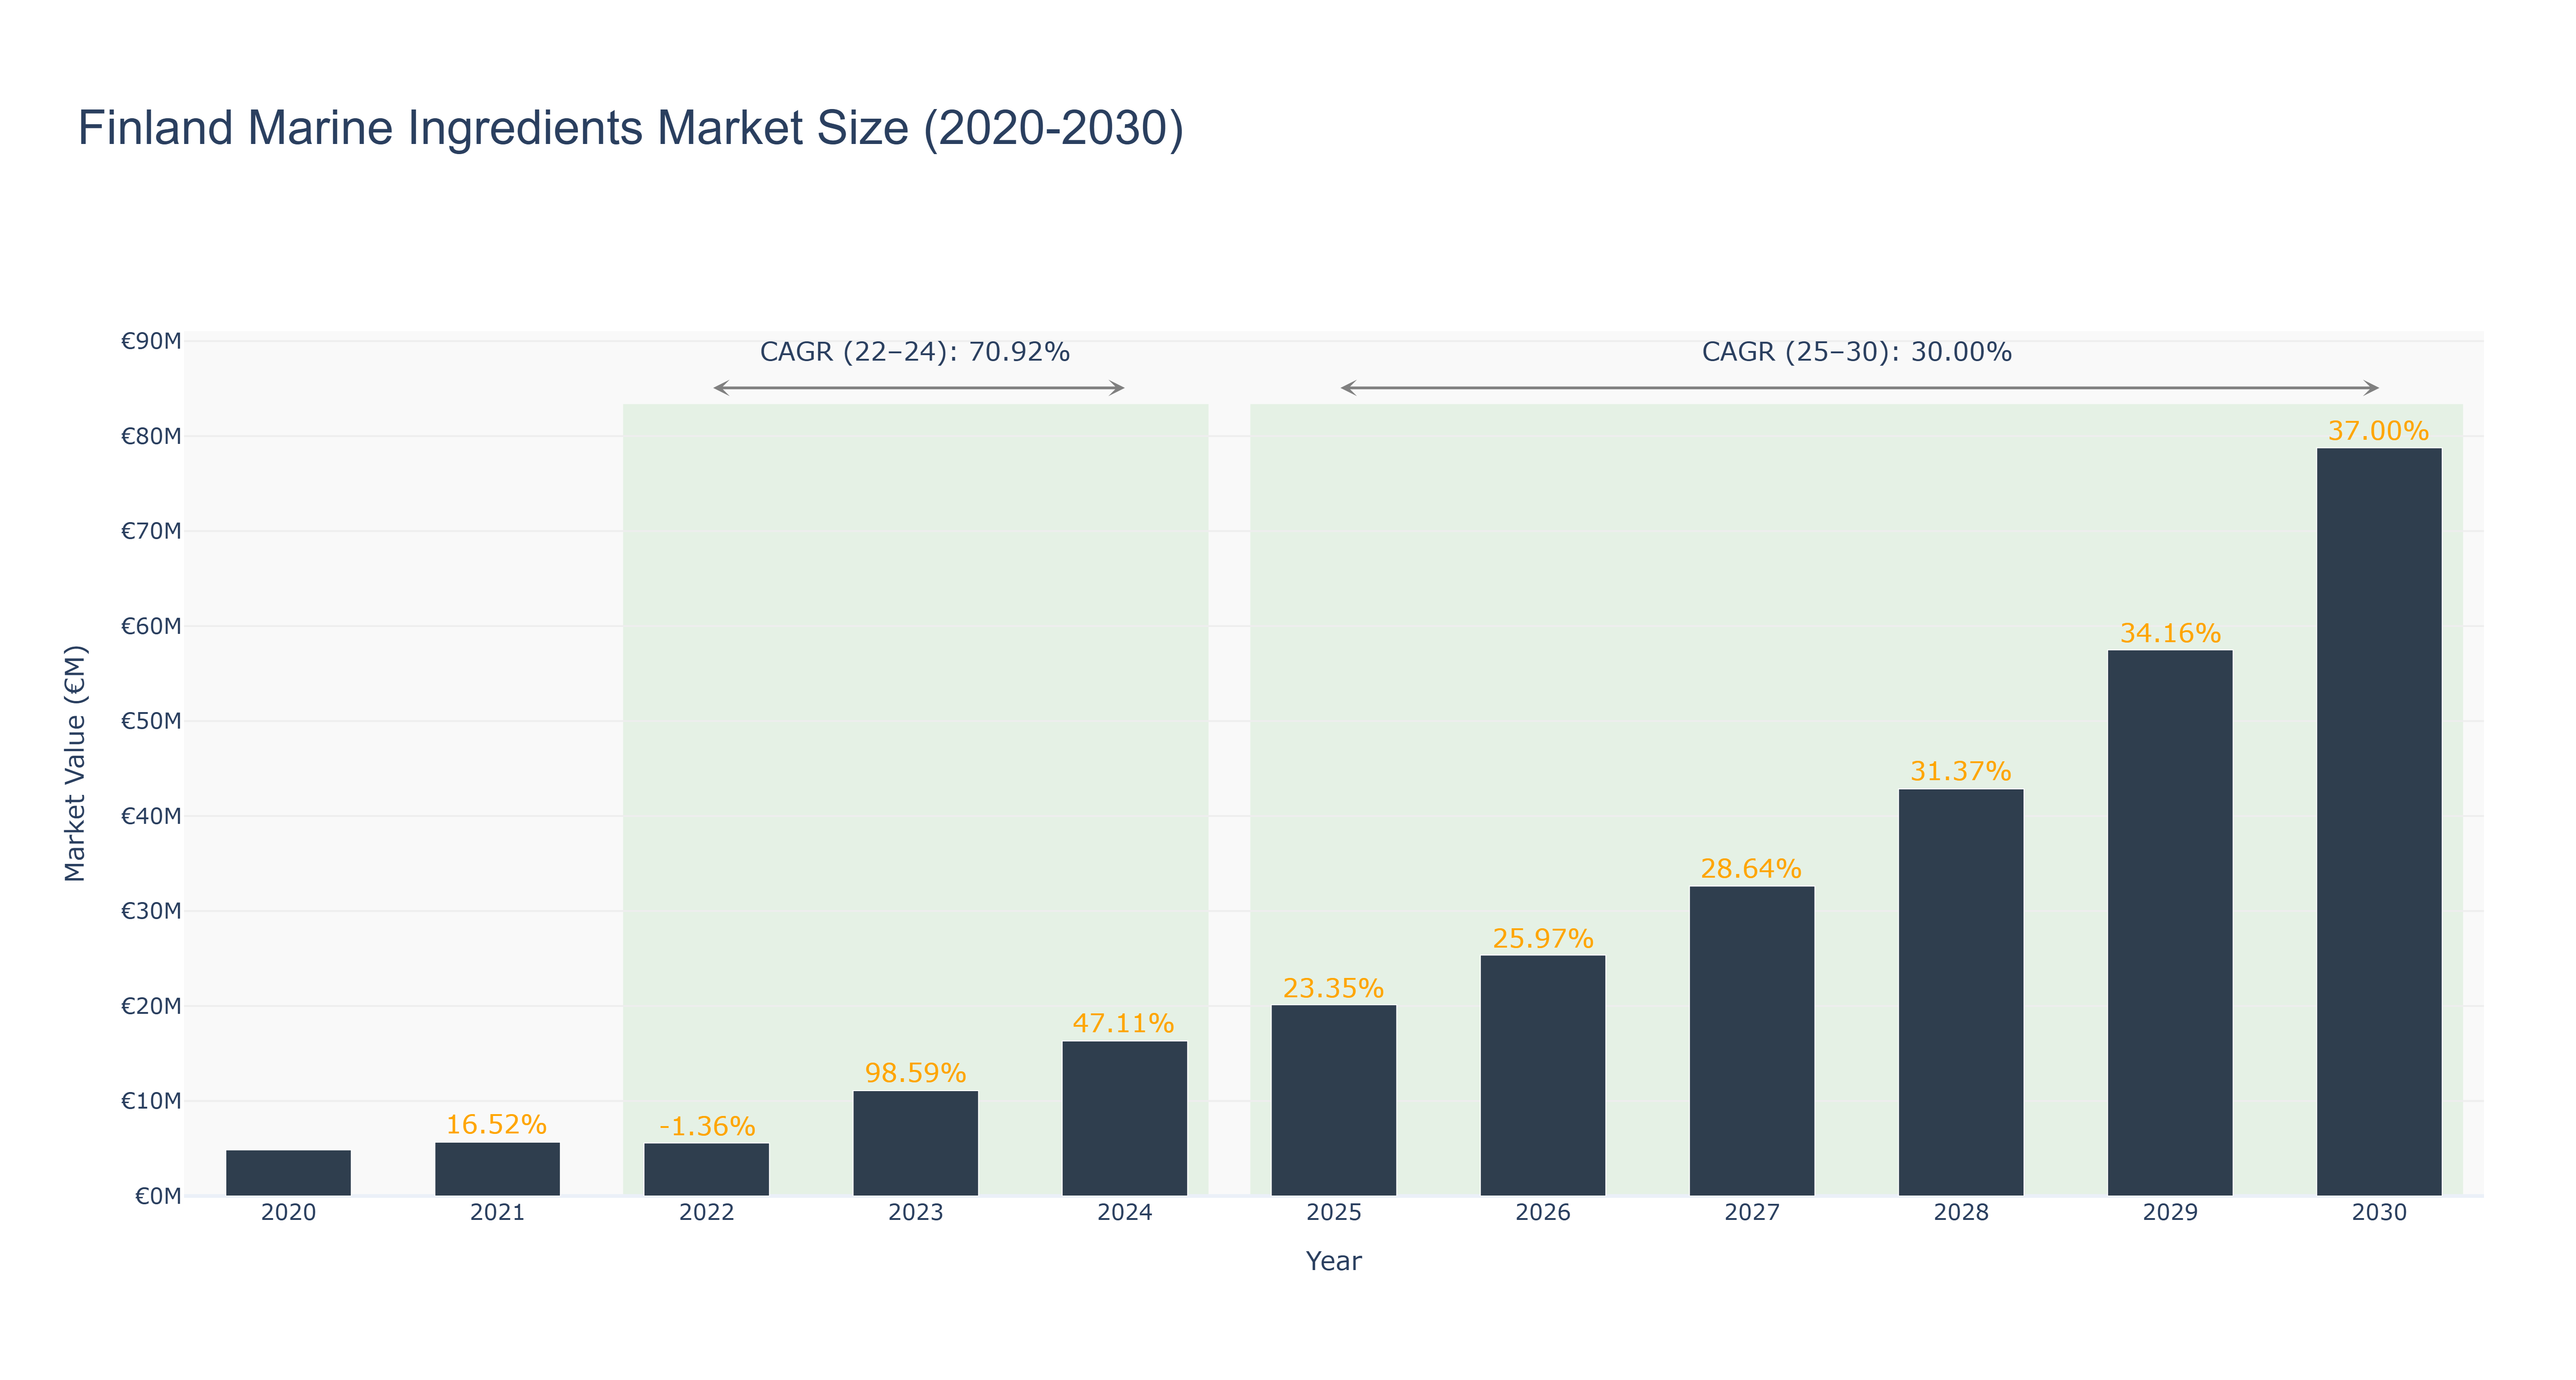
Finland Marine Ingredients Market has shown a remarkable growth trend over the years. The market size peaked at €78.77 million in 2030, with a consistent increase from €4.86 million in 2020. Noteworthy growth phases include a substantial jump in market size from 2022 to 2024, driven by a high CAGR of 70.92%. The forecasted market size from 2025 to 2030 is expected to maintain a strong growth trajectory, with a CAGR of 30.0%. The market's growth can be attributed to increasing consumer awareness of the health benefits of marine ingredients and the rising demand for functional food products. Looking ahead, Finland is set to witness the launch of innovative marine ingredient products catering to diverse consumer preferences, further boosting market growth and competitiveness.
Finland Marine Ingredients Market: Production & Trade Performance (2019-2025)
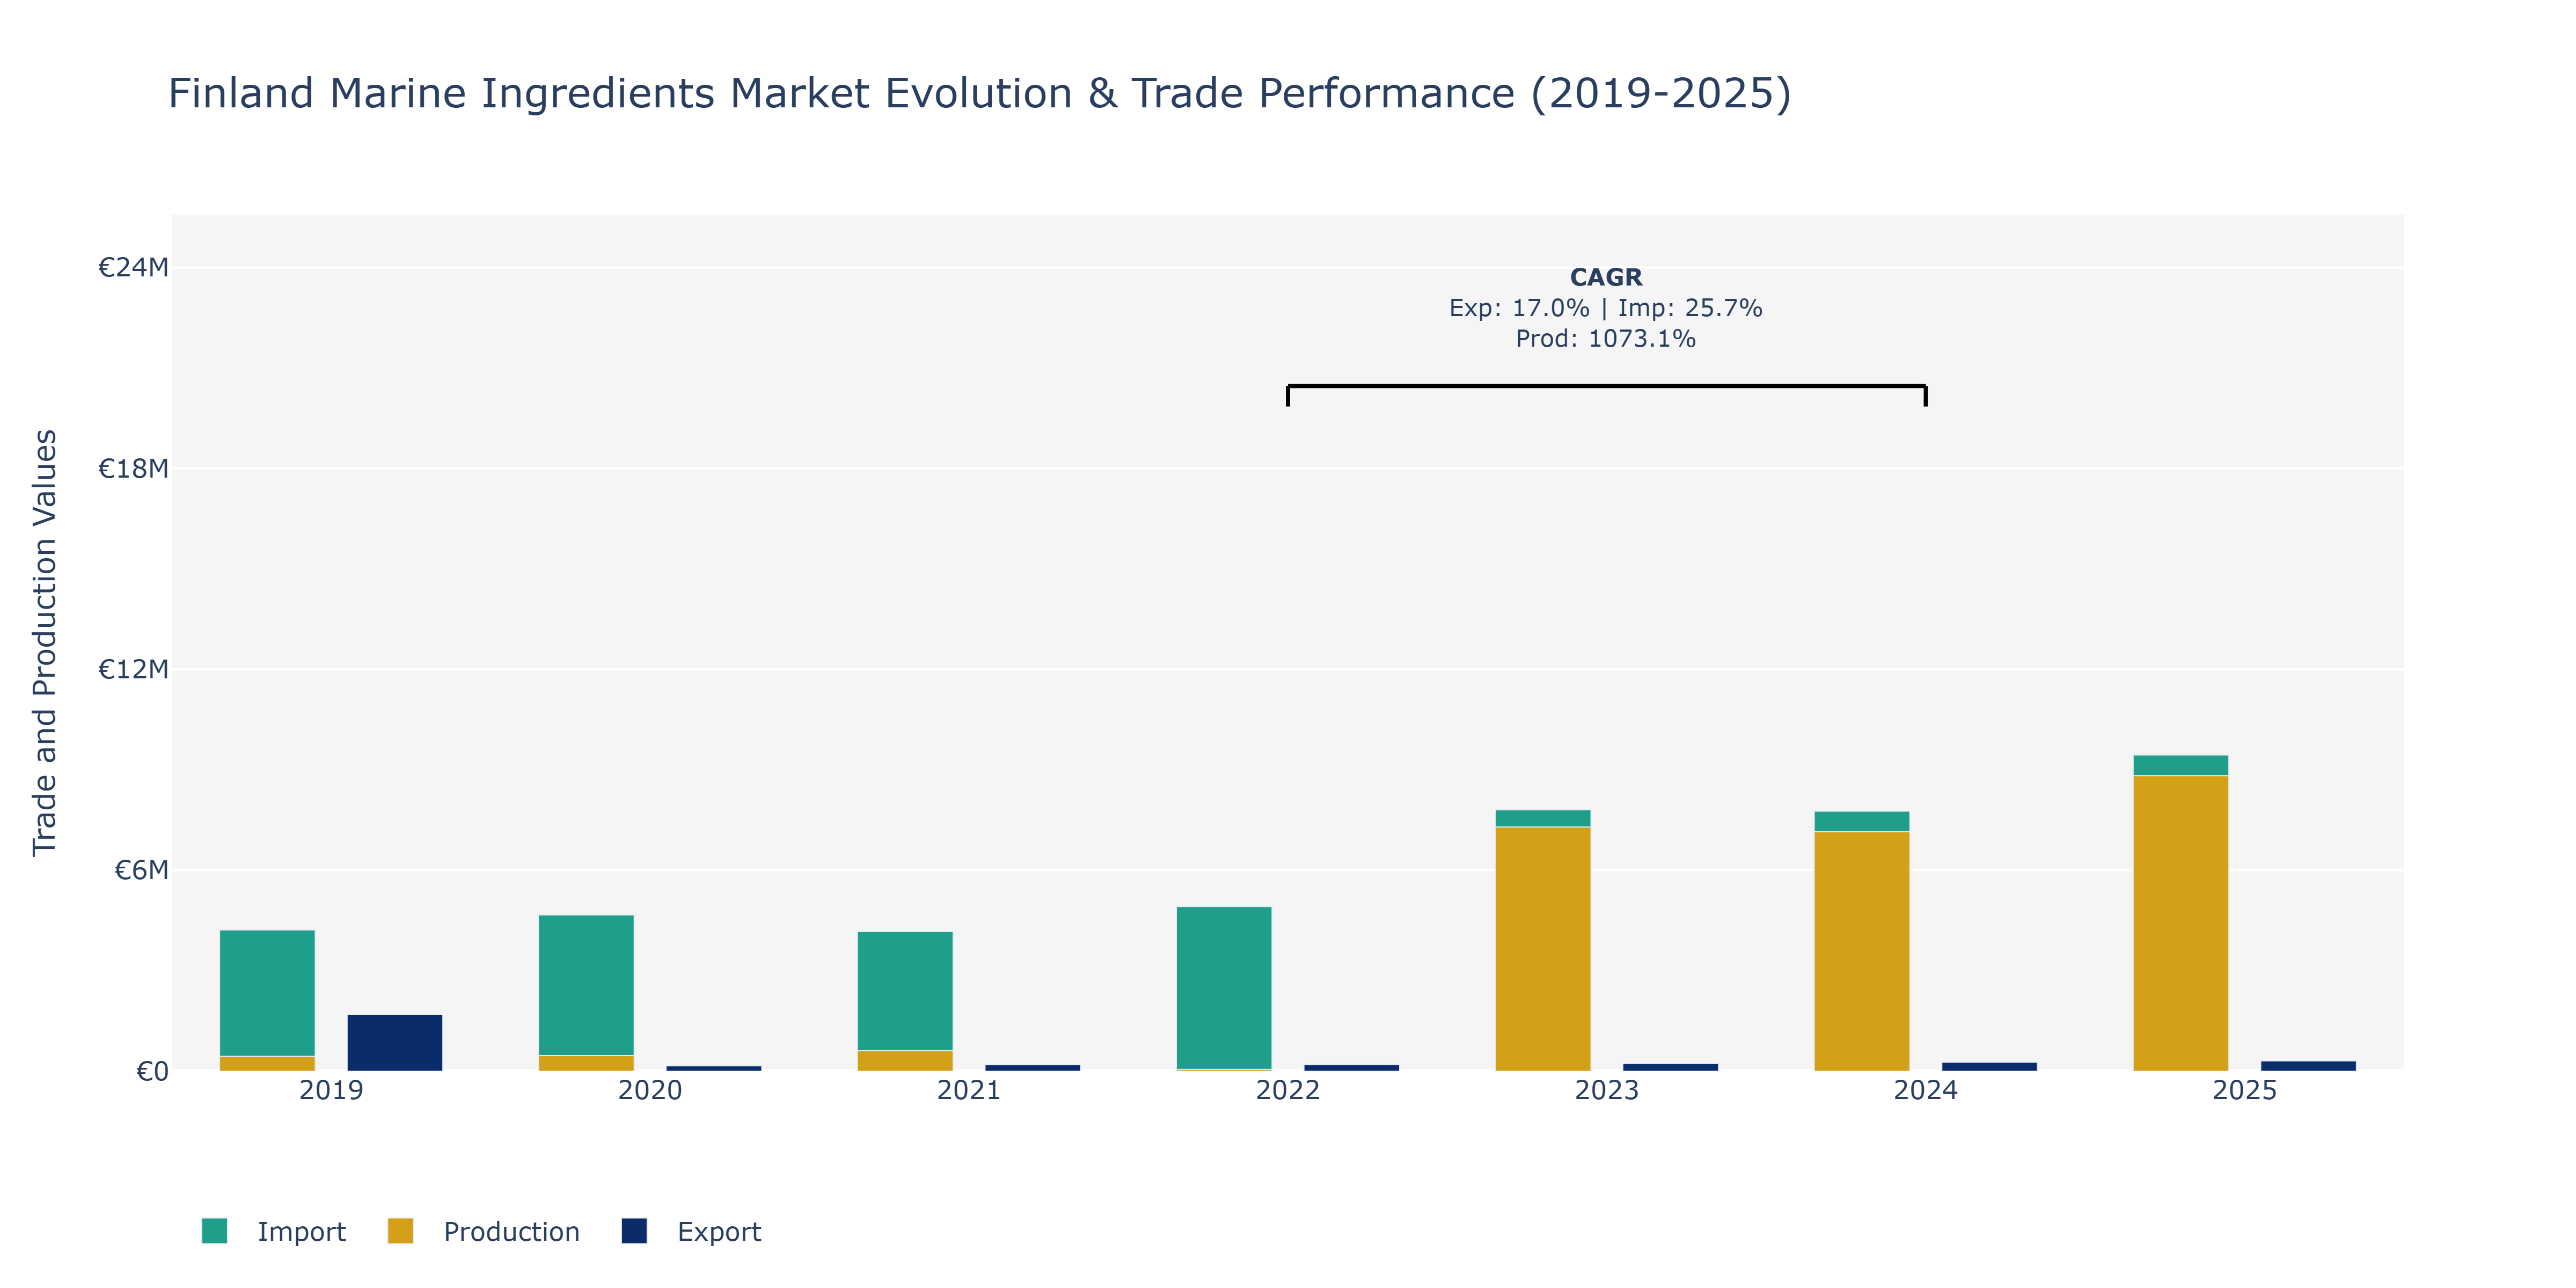
In the Finland Marine Ingredients Market, exports experienced a gradual increase from €1.7 million in 2019 to €308.3 thousand in 2025, reflecting a consistent upward trend. Conversely, imports fluctuated, peaking in 2025 at €9.44 million after reaching a low of €4.16 million in 2021. Production saw a substantial surge, rising from €443.79 million in 2019 to €8,827.24 million in 2025, with a notable peak in 2023 at €7.29 million. The growth in exports can be attributed to the rising global demand for sustainable marine ingredients, coupled with Finland's reputation for high-quality products. Import fluctuations may have been influenced by shifts in international trade agreements and changing consumer preferences. The remarkable spike in production in 2023 could be linked to increased investments in technology and processes enhancing efficiency and output in the sector, aligning with the industry's focus on innovation and sustainability efforts.
Key Highlights of the Report:
- Finland Marine Ingredients Market Outlook
- Market Size of Finland Marine Ingredients Market, 2025
- Forecast of Finland Marine Ingredients Market, 2032
- Historical Data and Forecast of Finland Marine Ingredients Revenues & Volume for the Period 2022 - 2032F
- Finland Marine Ingredients Market Trend Evolution
- Finland Marine Ingredients Market Drivers and Challenges
- Finland Marine Ingredients Price Trends
- Finland Marine Ingredients Porter's Five Forces
- Finland Marine Ingredients Industry Life Cycle
- Historical Data and Forecast of Finland Marine Ingredients Market Revenues & Volume By Type for the Period 2022 - 2032F
- Historical Data and Forecast of Finland Marine Ingredients Market Revenues & Volume By Fish Protein for the Period 2022 - 2032F
- Historical Data and Forecast of Finland Marine Ingredients Market Revenues & Volume By Omega-3 Oils for the Period 2022 - 2032F
- Historical Data and Forecast of Finland Marine Ingredients Market Revenues & Volume By Marine Collagen for the Period 2022 - 2032F
- Historical Data and Forecast of Finland Marine Ingredients Market Revenues & Volume By Source for the Period 2022 - 2032F
- Historical Data and Forecast of Finland Marine Ingredients Market Revenues & Volume By Fish for the Period 2022 - 2032F
- Historical Data and Forecast of Finland Marine Ingredients Market Revenues & Volume By Marine Algae for the Period 2022 - 2032F
- Historical Data and Forecast of Finland Marine Ingredients Market Revenues & Volume By Shellfish for the Period 2022 - 2032F
- Historical Data and Forecast of Finland Marine Ingredients Market Revenues & Volume By Application for the Period 2022 - 2032F
- Historical Data and Forecast of Finland Marine Ingredients Market Revenues & Volume By Supplements for the Period 2022 - 2032F
- Historical Data and Forecast of Finland Marine Ingredients Market Revenues & Volume By Pharmaceuticals for the Period 2022 - 2032F
- Historical Data and Forecast of Finland Marine Ingredients Market Revenues & Volume By Cosmetics for the Period 2022 - 2032F
- Historical Data and Forecast of Finland Marine Ingredients Market Revenues & Volume By End User for the Period 2022 - 2032F
- Historical Data and Forecast of Finland Marine Ingredients Market Revenues & Volume By Food Industry for the Period 2022 - 2032F
- Historical Data and Forecast of Finland Marine Ingredients Market Revenues & Volume By Healthcare for the Period 2022 - 2032F
- Historical Data and Forecast of Finland Marine Ingredients Market Revenues & Volume By Beauty & Personal Care for the Period 2022 - 2032F
- Finland Marine Ingredients Import Export Trade Statistics
- Market Opportunity Assessment By Type
- Market Opportunity Assessment By Source
- Market Opportunity Assessment By Application
- Market Opportunity Assessment By End User
- Finland Marine Ingredients Top Companies Market Share
- Finland Marine Ingredients Competitive Benchmarking By Technical and Operational Parameters
- Finland Marine Ingredients Company Profiles
- Finland Marine Ingredients Key Strategic Recommendations
Frequently Asked Questions About the Market Study (FAQs):
6Wresearch actively monitors the Finland Marine Ingredients Market and publishes its comprehensive annual report, highlighting emerging trends, growth drivers, revenue analysis, and forecast outlook. Our insights help businesses to make data-backed strategic decisions with ongoing market dynamics. Our analysts track relevent industries related to the Finland Marine Ingredients Market, allowing our clients with actionable intelligence and reliable forecasts tailored to emerging regional needs.
Yes, we provide customisation as per your requirements. To learn more, feel free to contact us on sales@6wresearch.com
1 Executive Summary |
2 Introduction |
2.1 Key Highlights of the Report |
2.2 Report Description |
2.3 Market Scope & Segmentation |
2.4 Research Methodology |
2.5 Assumptions |
3 Finland Marine Ingredients Market Overview |
3.1 Finland Country Macro Economic Indicators |
3.2 Finland Marine Ingredients Market Revenues & Volume, 2022 & 2032F |
3.3 Finland Marine Ingredients Market - Industry Life Cycle |
3.4 Finland Marine Ingredients Market - Porter's Five Forces |
3.5 Finland Marine Ingredients Market Revenues & Volume Share, By Type, 2022 & 2032F |
3.6 Finland Marine Ingredients Market Revenues & Volume Share, By Source, 2022 & 2032F |
3.7 Finland Marine Ingredients Market Revenues & Volume Share, By Application, 2022 & 2032F |
3.8 Finland Marine Ingredients Market Revenues & Volume Share, By End User, 2022 & 2032F |
4 Finland Marine Ingredients Market Dynamics |
4.1 Impact Analysis |
4.2 Market Drivers |
4.2.1 Increasing consumer awareness about the health benefits of marine ingredients |
4.2.2 Growing demand for natural and sustainable ingredients in food and dietary supplements |
4.2.3 Rising popularity of clean label products in the food industry |
4.3 Market Restraints |
4.3.1 Seasonal variations and weather conditions affecting fishing and harvesting of marine ingredients |
4.3.2 Regulatory challenges related to sustainability and traceability of marine ingredients |
4.3.3 Competition from alternative sources of protein and nutrients |
5 Finland Marine Ingredients Market Trends |
6 Finland Marine Ingredients Market, By Types |
6.1 Finland Marine Ingredients Market, By Type |
6.1.1 Overview and Analysis |
6.1.2 Finland Marine Ingredients Market Revenues & Volume, By Type, 2022 - 2032F |
6.1.3 Finland Marine Ingredients Market Revenues & Volume, By Fish Protein, 2022 - 2032F |
6.1.4 Finland Marine Ingredients Market Revenues & Volume, By Omega-3 Oils, 2022 - 2032F |
6.1.5 Finland Marine Ingredients Market Revenues & Volume, By Marine Collagen, 2022 - 2032F |
6.2 Finland Marine Ingredients Market, By Source |
6.2.1 Overview and Analysis |
6.2.2 Finland Marine Ingredients Market Revenues & Volume, By Fish, 2022 - 2032F |
6.2.3 Finland Marine Ingredients Market Revenues & Volume, By Marine Algae, 2022 - 2032F |
6.2.4 Finland Marine Ingredients Market Revenues & Volume, By Shellfish, 2022 - 2032F |
6.3 Finland Marine Ingredients Market, By Application |
6.3.1 Overview and Analysis |
6.3.2 Finland Marine Ingredients Market Revenues & Volume, By Supplements, 2022 - 2032F |
6.3.3 Finland Marine Ingredients Market Revenues & Volume, By Pharmaceuticals, 2022 - 2032F |
6.3.4 Finland Marine Ingredients Market Revenues & Volume, By Cosmetics, 2022 - 2032F |
6.4 Finland Marine Ingredients Market, By End User |
6.4.1 Overview and Analysis |
6.4.2 Finland Marine Ingredients Market Revenues & Volume, By Food Industry, 2022 - 2032F |
6.4.3 Finland Marine Ingredients Market Revenues & Volume, By Healthcare, 2022 - 2032F |
6.4.4 Finland Marine Ingredients Market Revenues & Volume, By Beauty & Personal Care, 2022 - 2032F |
7 Finland Marine Ingredients Market Import-Export Trade Statistics |
7.1 Finland Marine Ingredients Market Export to Major Countries |
7.2 Finland Marine Ingredients Market Imports from Major Countries |
8 Finland Marine Ingredients Market Key Performance Indicators |
8.1 Percentage of food products containing marine ingredients in the Finnish market |
8.2 Number of new product launches with marine ingredients |
8.3 Level of investment in research and development for marine ingredient extraction technologies |
9 Finland Marine Ingredients Market - Opportunity Assessment |
9.1 Finland Marine Ingredients Market Opportunity Assessment, By Type, 2022 & 2032F |
9.2 Finland Marine Ingredients Market Opportunity Assessment, By Source, 2022 & 2032F |
9.3 Finland Marine Ingredients Market Opportunity Assessment, By Application, 2022 & 2032F |
9.4 Finland Marine Ingredients Market Opportunity Assessment, By End User, 2022 & 2032F |
10 Finland Marine Ingredients Market - Competitive Landscape |
10.1 Finland Marine Ingredients Market Revenue Share, By Companies, 2025 |
10.2 Finland Marine Ingredients Market Competitive Benchmarking, By Operating and Technical Parameters |
11 Company Profiles |
12 Recommendations |
13 Disclaimer |
Export potential assessment - trade Analytics for 2030
Export potential enables firms to identify high-growth global markets with greater confidence by combining advanced trade intelligence with a structured quantitative methodology. The framework analyzes emerging demand trends and country-level import patterns while integrating macroeconomic and trade datasets such as GDP and population forecasts, bilateral import–export flows, tariff structures, elasticity differentials between developed and developing economies, geographic distance, and import demand projections. Using weighted trade values from 2020–2024 as the base period to project country-to-country export potential for 2030, these inputs are operationalized through calculated drivers such as gravity model parameters, tariff impact factors, and projected GDP per-capita growth. Through an analysis of hidden potentials, demand hotspots, and market conditions that are most favorable to success, this method enables firms to focus on target countries, maximize returns, and global expansion with data, backed by accuracy.
By factoring in the projected importer demand gap that is currently unmet and could be potential opportunity, it identifies the potential for the Exporter (Country) among 190 countries, against the general trade analysis, which identifies the biggest importer or exporter.
To discover high-growth global markets and optimize your business strategy:
Click Here
Pricing
- Single User License$ 1,995
- Department License$ 2,400
- Site License$ 3,120
- Global License$ 3,795

Search
Thought Leadership and Analyst Meet


Our Clients
Latest Reports
- India Ultrasonic Smart Water Meter Market (2026-2032) | Outlook, Competition, Drivers, Trends, Demand, Competitive, Strategic Insights, Companies, Challenges, Strategy, Consumer Insights, Analysis, Opportunities, Growth, Size, Share, Industry, Revenue, Segments, Value, Segmentation, Supply, Forecast, Restraints,
- India Electromagnetic Bulk Flow Meter Market (2026-2032) | Analysis, Challenges, Strategic Insights, Supply, Forecast, Growth, Share, Consumer Insights, Competitive, Value, Outlook, Size & Demand,
- India Battery Powered Bulk Flow Meter Market (2026-2032) | Outlook, Analysis, Competitive Landscape, Growth, Size, Trends, Value, Revenue, Companies, Segmentation, Share & Forecast
- Bosnia and Herzegovina Fuel-Efficient Winglets Market (2026-2032) | Growth, Competition, Strategy, Restraints, Trends, Challenges, segmentation, Value, Outlook, Investment Opportunities, Analysis, Revenue, Companies, Insights, Pricing, Size, Drivers, Demand, Share, Forecast
- Canada Cloud CFD Market (2026-2032) | Size & Revenue, Industry, Growth, Competitive Landscape, Forecast, Segmentation, Value, Outlook, Trends, Share, Analysis, Companies
- Taiwan Food Delivery Platform Market (2026-2032) | Companies, Outlook, Analysis, Trends, Value, Revenue, Segmentation, Share, Forecast, Competitive Landscape, Growth, Size & Forecast
- United Kingdom (UK) Long-term Care Insurance Market (2026-2032) | Growth, Share, Consumer Insights, Drivers, Opportunities, Competition, Pricing Analysis, Segments, Restraints, Companies, Competitive, Value, Outlook, Size, Demand, Analysis, Challenges, Strategic Insights, Investment Trends, Revenue, Trends, Supply, Forecast
- United Kingdom (UK) Long Term Care Market (2026-2032) | Companies, Outlook, Analysis, Trends, Value, Revenue, Segmentation, Share, Forecast, Competitive Landscape, Growth, Size & Forecast
- Iraq Insulation and Waterproofing Market (2026-2032) | Outlook, Drivers, Growth, Size, Share, Industry, Revenue, Trends, Demand, Competitive, Strategic Insights, Opportunities, Segments, Companies, Challenges, Strategy, Consumer Insights, Analysis, Investment Trends, Value, Segmentation, Forecast, Restraints
- India Switchgear Market Outlook (2026-2032) | Size, Share, Trends, Growth, Revenue, Forecast, Analysis, Value, Outlook
Industry Events and Analyst Meet

HIMTEX 2026

India Refining Summit 2026

India EV Show 2026

EV tech India Expo 2026

Auto Tech Asia 2026
Whitepaper
- Middle East & Africa Commercial Security Market Click here to view more.
- Middle East & Africa Fire Safety Systems & Equipment Market Click here to view more.
- GCC Drone Market Click here to view more.
- Middle East Lighting Fixture Market Click here to view more.
- GCC Physical & Perimeter Security Market Click here to view more.
6WResearch In News
- Doha a strategic location for EV manufacturing hub: IPA Qatar
- Demand for luxury TVs surging in the GCC, says Samsung
- Empowering Growth: The Thriving Journey of Bangladesh’s Cable Industry
- Demand for luxury TVs surging in the GCC, says Samsung
- Video call with a traditional healer? Once unthinkable, it’s now common in South Africa
- Intelligent Buildings To Smooth GCC’s Path To Net Zero