Estonia Paperboard Jar Market (2026-2032) | Outlook, Segmentation, Industry, Companies, Analysis, Value, Forecast, Size & Revenue, Competitive Landscape, Trends, Share, Growth
Market Forecast By Neck Diameter (Up to 50 mm, 51 mm 100 mm, 101 mm & Above), By Closure Type (Caps, Snap-on, Plug, Lids, Metal, Plastic, Paperboard Ends), By End Use (Personal Care & Cosmetics, Coffee and Tea, Food & Beverages, Snacks & Confectionery, Industrial Goods, Consumer Goods, Others) And Competitive Landscape
| Product Code: ETC7139314 | Publication Date: Sep 2024 | Updated Date: Apr 2026 | Product Type: Market Research Report | |
| Publisher: 6Wresearch | Author: Summon Dutta | No. of Pages: 75 | No. of Figures: 35 | No. of Tables: 20 |
Estonia Paperboard Jar Market Size (2020-2030)
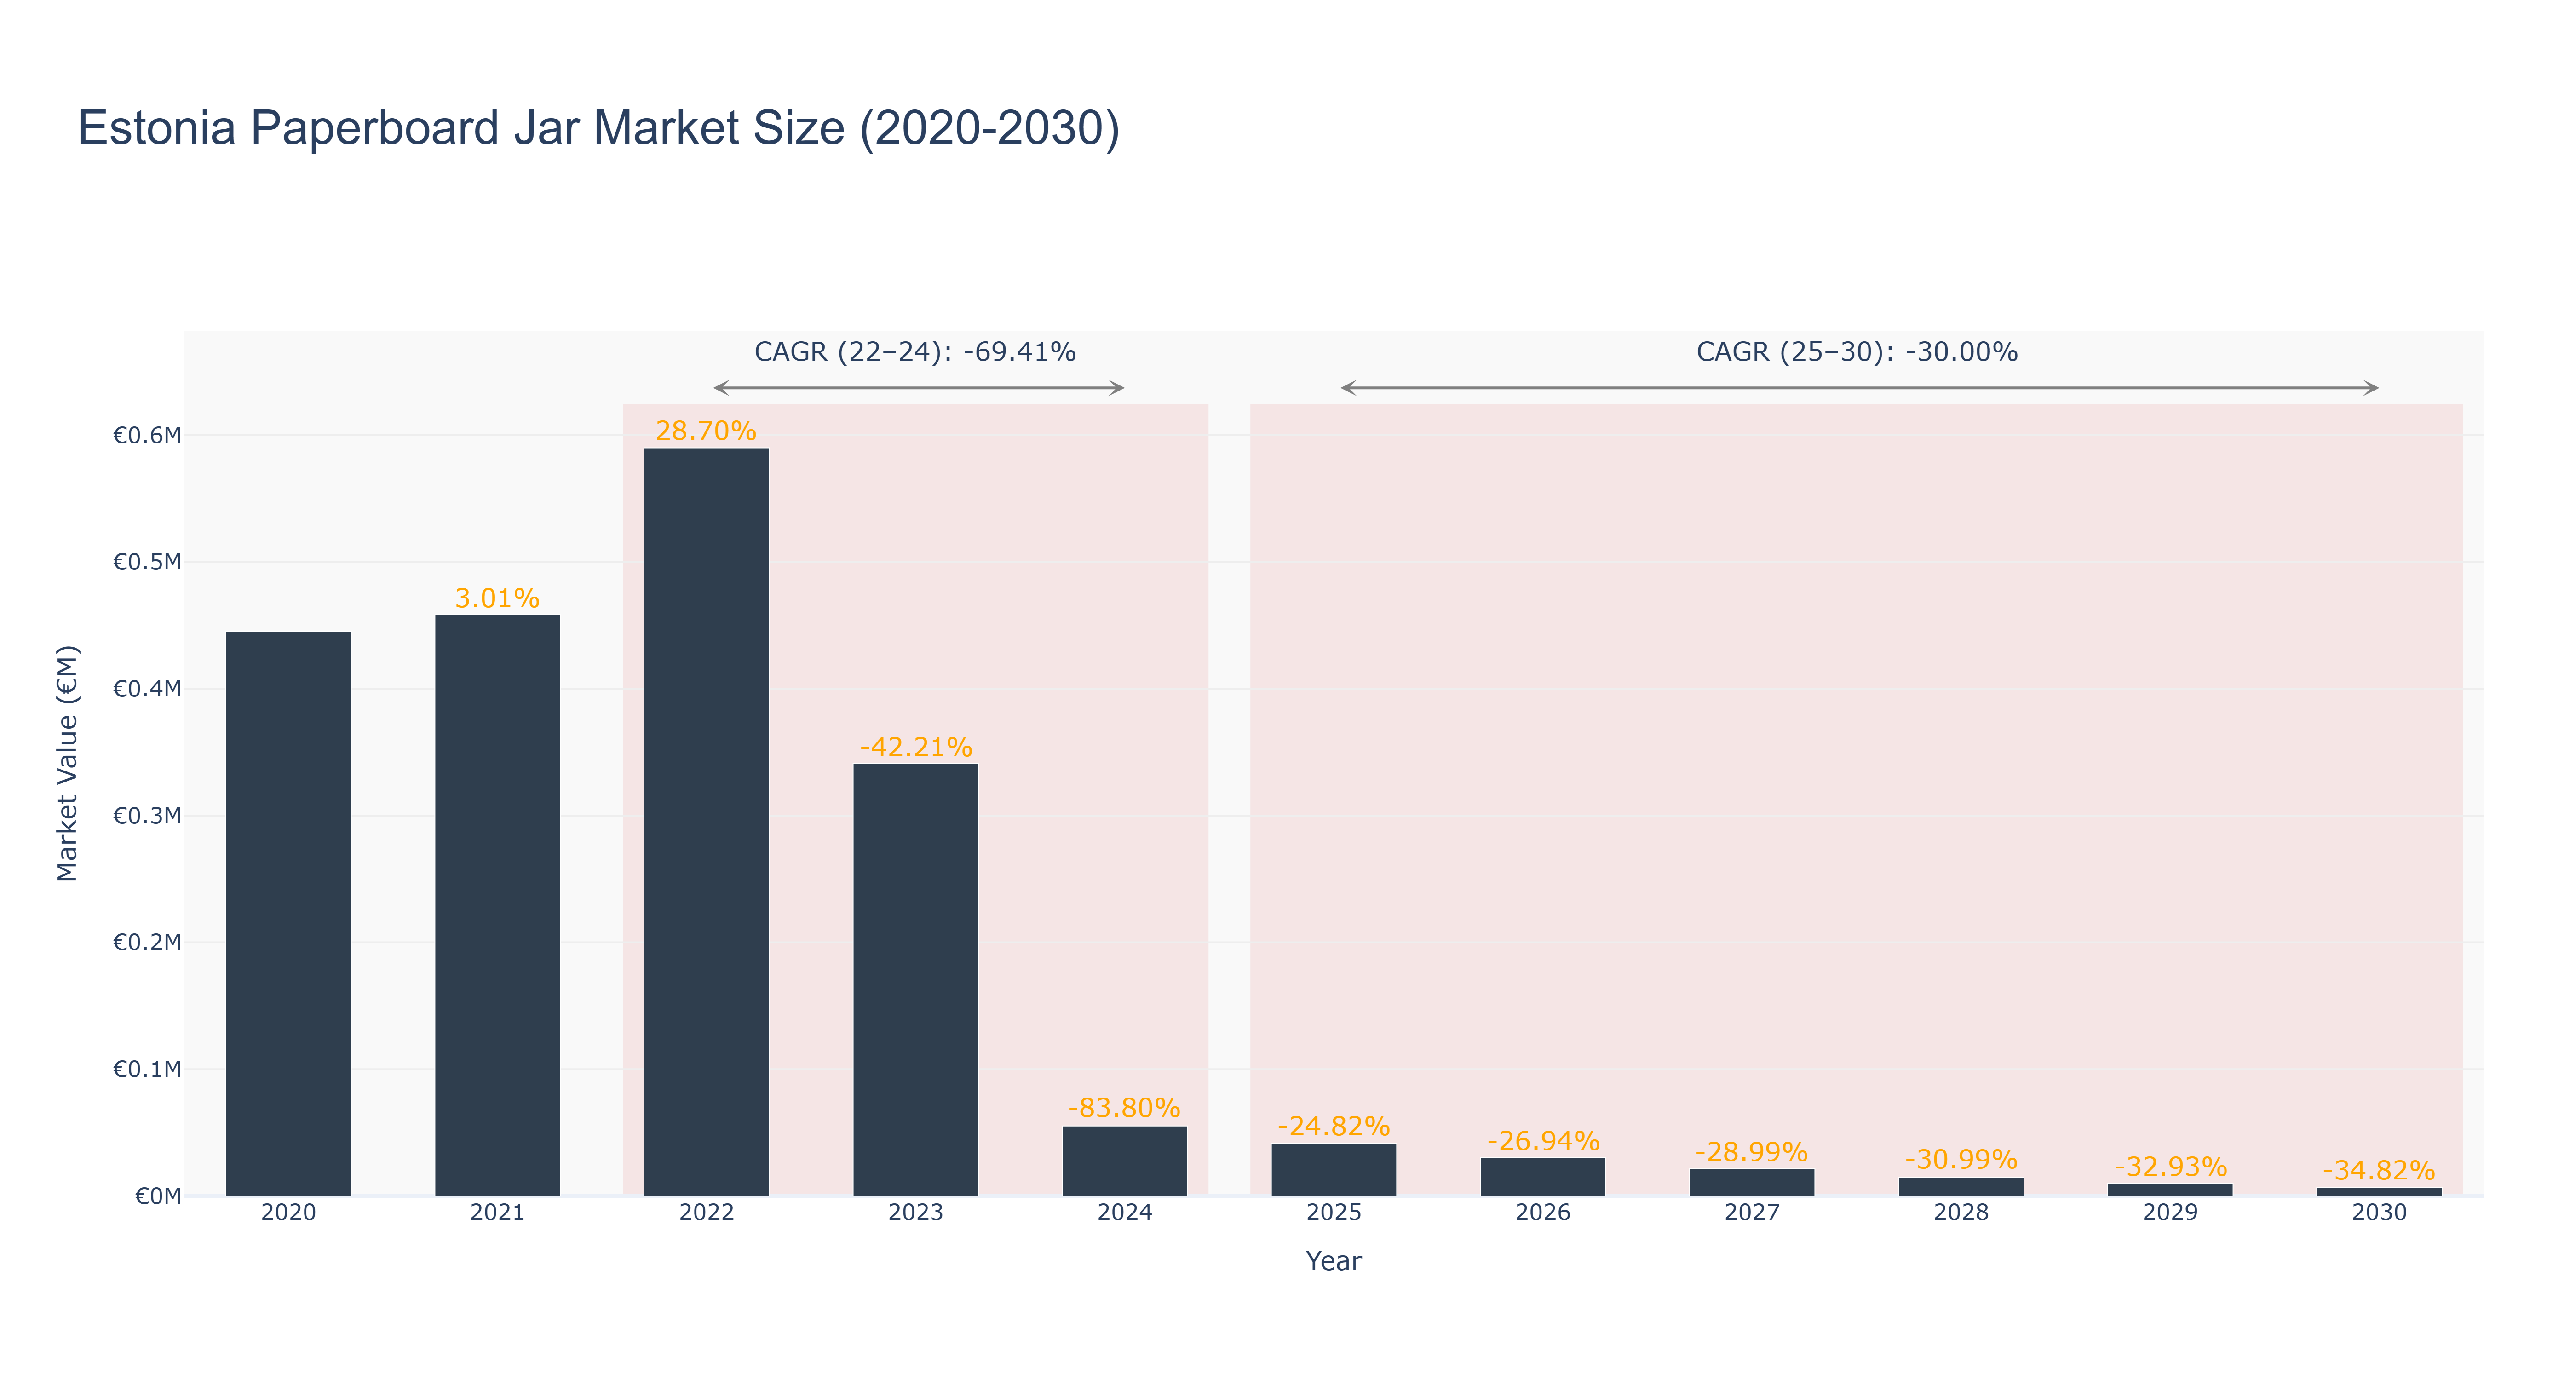
The Estonia Paperboard Jar Market has experienced a significant decline since 2022, with the peak market size of €0.59 million in 2022. The actual market size decreased to €0.06 million in 2024, reflecting a sharp downward trend. The forecasted market size from 2025 to 2030 is expected to continue this decline, reaching €0.01 million by 2030. The CAGR values further illustrate this trend, with a CAGR of -69.41% from 2022 to 2024 and -30.0% from 2025 to 2030. The downturn can be attributed to changing consumer preferences towards alternative packaging materials and a shift towards sustainable packaging solutions. Looking ahead, Estonia is focusing on promoting eco-friendly packaging solutions to align with global sustainability initiatives. The market is expected to see increased investments in research and development for innovative packaging technologies to meet evolving consumer demands and environmental regulations. This strategic approach aims to revitalize the market and drive future growth in the paperboard jar segment.
Estonia Paperboard Jar Market: Production & Trade Performance (2019-2025)
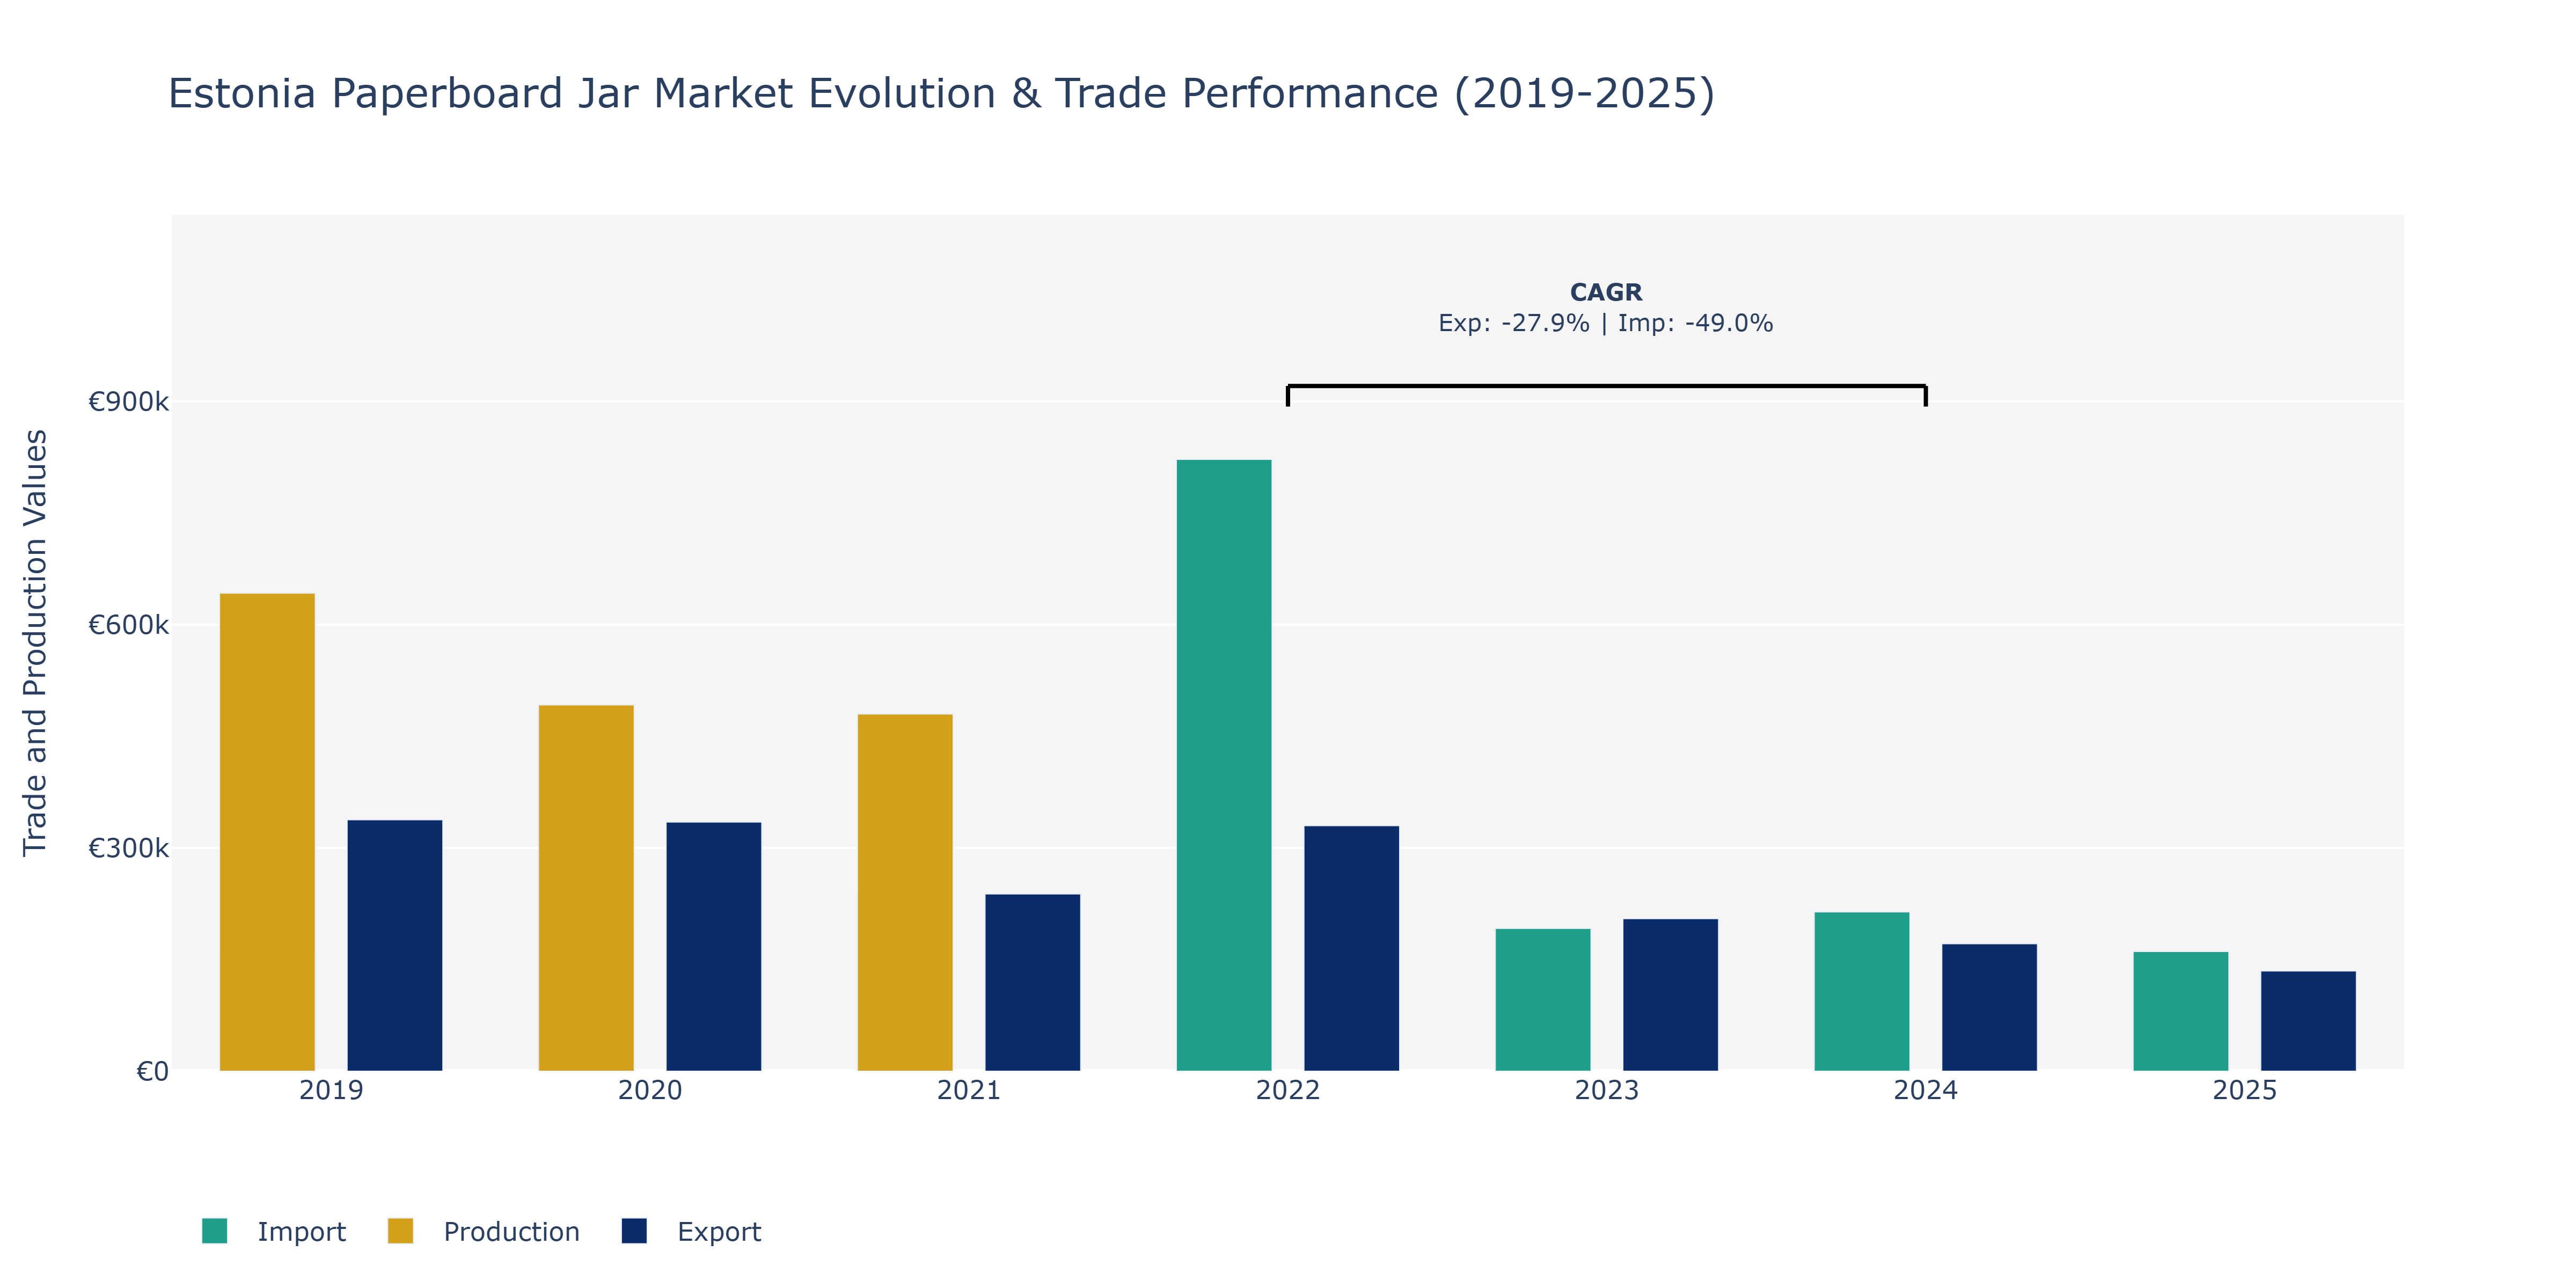
In the Estonia Paperboard Jar Market, from 2019 to 2025, the exports witnessed a fluctuating trend. Starting at €337.96 thousand in 2019, there was a slight decrease in 2020 to €334.91 thousand. However, the exports peaked again in 2022 at €330.02 thousand before gradually declining in the following years, reaching €134.73 thousand in 2025. On the other hand, imports showcased a contrasting pattern, with a significant increase from €159.83 thousand in 2019 to €822.36 thousand in 2022 before stabilizing at around €160.86 thousand in 2025. Production value experienced a consistent decline from €642.49 thousand in 2019 to €480 thousand in 2021. This downward trend can be attributed to shifts in consumer preferences towards more sustainable packaging materials, impacting the overall demand for paperboard jars. The decrease in exports can be linked to global economic fluctuations and evolving trade policies affecting market competitiveness. The rise in imports might indicate a growing reliance on foreign suppliers due to cost considerations or domestic production challenges. Such market dynamics emphasize the importance of strategic planning and adaptation to maintain competitiveness in the Estonia Paperboard Jar Market.
Key Highlights of the Report:
- Estonia Paperboard Jar Market Outlook
- Market Size of Estonia Paperboard Jar Market, 2025
- Forecast of Estonia Paperboard Jar Market, 2032
- Historical Data and Forecast of Estonia Paperboard Jar Revenues & Volume for the Period 2022 - 2032
- Estonia Paperboard Jar Market Trend Evolution
- Estonia Paperboard Jar Market Drivers and Challenges
- Estonia Paperboard Jar Price Trends
- Estonia Paperboard Jar Porter's Five Forces
- Estonia Paperboard Jar Industry Life Cycle
- Historical Data and Forecast of Estonia Paperboard Jar Market Revenues & Volume By Neck Diameter for the Period 2022 - 2032
- Historical Data and Forecast of Estonia Paperboard Jar Market Revenues & Volume By Up to 50 mm for the Period 2022 - 2032
- Historical Data and Forecast of Estonia Paperboard Jar Market Revenues & Volume By 51 mm 100 mm for the Period 2022 - 2032
- Historical Data and Forecast of Estonia Paperboard Jar Market Revenues & Volume By 101 mm & Above for the Period 2022 - 2032
- Historical Data and Forecast of Estonia Paperboard Jar Market Revenues & Volume By Closure Type for the Period 2022 - 2032
- Historical Data and Forecast of Estonia Paperboard Jar Market Revenues & Volume By Caps for the Period 2022 - 2032
- Historical Data and Forecast of Estonia Paperboard Jar Market Revenues & Volume By Snap-on for the Period 2022 - 2032
- Historical Data and Forecast of Estonia Paperboard Jar Market Revenues & Volume By Plug for the Period 2022 - 2032
- Historical Data and Forecast of Estonia Paperboard Jar Market Revenues & Volume By Lids for the Period 2022 - 2032
- Historical Data and Forecast of Estonia Paperboard Jar Market Revenues & Volume By Metal for the Period 2022 - 2032
- Historical Data and Forecast of Estonia Paperboard Jar Market Revenues & Volume By Plastic for the Period 2022 - 2032
- Historical Data and Forecast of Estonia Paperboard Jar Market Revenues & Volume By Paperboard Ends for the Period 2022 - 2032
- Historical Data and Forecast of Estonia Paperboard Jar Market Revenues & Volume By End Use for the Period 2022 - 2032
- Historical Data and Forecast of Estonia Paperboard Jar Market Revenues & Volume By Personal Care & Cosmetics for the Period 2022 - 2032
- Historical Data and Forecast of Estonia Paperboard Jar Market Revenues & Volume By Coffee and Tea for the Period 2022 - 2032
- Historical Data and Forecast of Estonia Paperboard Jar Market Revenues & Volume By Food & Beverages for the Period 2022 - 2032
- Historical Data and Forecast of Estonia Paperboard Jar Market Revenues & Volume By Snacks & Confectionery for the Period 2022 - 2032
- Historical Data and Forecast of Estonia Paperboard Jar Market Revenues & Volume By Industrial Goods for the Period 2022 - 2032
- Historical Data and Forecast of Estonia Paperboard Jar Market Revenues & Volume By Consumer Goods for the Period 2022 - 2032
- Historical Data and Forecast of Estonia Paperboard Jar Market Revenues & Volume By Others for the Period 2022 - 2032
- Estonia Paperboard Jar Import Export Trade Statistics
- Market Opportunity Assessment By Neck Diameter
- Market Opportunity Assessment By Closure Type
- Market Opportunity Assessment By End Use
- Estonia Paperboard Jar Top Companies Market Share
- Estonia Paperboard Jar Competitive Benchmarking By Technical and Operational Parameters
- Estonia Paperboard Jar Company Profiles
- Estonia Paperboard Jar Key Strategic Recommendations
Frequently Asked Questions About the Market Study (FAQs):
6Wresearch actively monitors the Estonia Paperboard Jar Market and publishes its comprehensive annual report, highlighting emerging trends, growth drivers, revenue analysis, and forecast outlook. Our insights help businesses to make data-backed strategic decisions with ongoing market dynamics. Our analysts track relevent industries related to the Estonia Paperboard Jar Market, allowing our clients with actionable intelligence and reliable forecasts tailored to emerging regional needs.
Yes, we provide customisation as per your requirements. To learn more, feel free to contact us on sales@6wresearch.com
1 Executive Summary |
2 Introduction |
2.1 Key Highlights of the Report |
2.2 Report Description |
2.3 Market Scope & Segmentation |
2.4 Research Methodology |
2.5 Assumptions |
3 Estonia Paperboard Jar Market Overview |
3.1 Estonia Country Macro Economic Indicators |
3.2 Estonia Paperboard Jar Market Revenues & Volume, 2022 & 2032F |
3.3 Estonia Paperboard Jar Market - Industry Life Cycle |
3.4 Estonia Paperboard Jar Market - Porter's Five Forces |
3.5 Estonia Paperboard Jar Market Revenues & Volume Share, By Neck Diameter, 2022 & 2032F |
3.6 Estonia Paperboard Jar Market Revenues & Volume Share, By Closure Type, 2022 & 2032F |
3.7 Estonia Paperboard Jar Market Revenues & Volume Share, By End Use, 2022 & 2032F |
4 Estonia Paperboard Jar Market Dynamics |
4.1 Impact Analysis |
4.2 Market Drivers |
4.3 Market Restraints |
5 Estonia Paperboard Jar Market Trends |
6 Estonia Paperboard Jar Market, By Types |
6.1 Estonia Paperboard Jar Market, By Neck Diameter |
6.1.1 Overview and Analysis |
6.1.2 Estonia Paperboard Jar Market Revenues & Volume, By Neck Diameter, 2022 - 2032F |
6.1.3 Estonia Paperboard Jar Market Revenues & Volume, By Up to 50 mm, 2022 - 2032F |
6.1.4 Estonia Paperboard Jar Market Revenues & Volume, By 51 mm 100 mm, 2022 - 2032F |
6.1.5 Estonia Paperboard Jar Market Revenues & Volume, By 101 mm & Above, 2022 - 2032F |
6.2 Estonia Paperboard Jar Market, By Closure Type |
6.2.1 Overview and Analysis |
6.2.2 Estonia Paperboard Jar Market Revenues & Volume, By Caps, 2022 - 2032F |
6.2.3 Estonia Paperboard Jar Market Revenues & Volume, By Snap-on, 2022 - 2032F |
6.2.4 Estonia Paperboard Jar Market Revenues & Volume, By Plug, 2022 - 2032F |
6.2.5 Estonia Paperboard Jar Market Revenues & Volume, By Lids, 2022 - 2032F |
6.2.6 Estonia Paperboard Jar Market Revenues & Volume, By Metal, 2022 - 2032F |
6.2.7 Estonia Paperboard Jar Market Revenues & Volume, By Plastic, 2022 - 2032F |
6.3 Estonia Paperboard Jar Market, By End Use |
6.3.1 Overview and Analysis |
6.3.2 Estonia Paperboard Jar Market Revenues & Volume, By Personal Care & Cosmetics, 2022 - 2032F |
6.3.3 Estonia Paperboard Jar Market Revenues & Volume, By Coffee and Tea, 2022 - 2032F |
6.3.4 Estonia Paperboard Jar Market Revenues & Volume, By Food & Beverages, 2022 - 2032F |
6.3.5 Estonia Paperboard Jar Market Revenues & Volume, By Snacks & Confectionery, 2022 - 2032F |
6.3.6 Estonia Paperboard Jar Market Revenues & Volume, By Industrial Goods, 2022 - 2032F |
6.3.7 Estonia Paperboard Jar Market Revenues & Volume, By Consumer Goods, 2022 - 2032F |
7 Estonia Paperboard Jar Market Import-Export Trade Statistics |
7.1 Estonia Paperboard Jar Market Export to Major Countries |
7.2 Estonia Paperboard Jar Market Imports from Major Countries |
8 Estonia Paperboard Jar Market Key Performance Indicators |
9 Estonia Paperboard Jar Market - Opportunity Assessment |
9.1 Estonia Paperboard Jar Market Opportunity Assessment, By Neck Diameter, 2022 & 2032F |
9.2 Estonia Paperboard Jar Market Opportunity Assessment, By Closure Type, 2022 & 2032F |
9.3 Estonia Paperboard Jar Market Opportunity Assessment, By End Use, 2022 & 2032F |
10 Estonia Paperboard Jar Market - Competitive Landscape |
10.1 Estonia Paperboard Jar Market Revenue Share, By Companies, 2025 |
10.2 Estonia Paperboard Jar Market Competitive Benchmarking, By Operating and Technical Parameters |
11 Company Profiles |
12 Recommendations |
13 Disclaimer |
Export potential assessment - trade Analytics for 2030
Export potential enables firms to identify high-growth global markets with greater confidence by combining advanced trade intelligence with a structured quantitative methodology. The framework analyzes emerging demand trends and country-level import patterns while integrating macroeconomic and trade datasets such as GDP and population forecasts, bilateral import–export flows, tariff structures, elasticity differentials between developed and developing economies, geographic distance, and import demand projections. Using weighted trade values from 2020–2024 as the base period to project country-to-country export potential for 2030, these inputs are operationalized through calculated drivers such as gravity model parameters, tariff impact factors, and projected GDP per-capita growth. Through an analysis of hidden potentials, demand hotspots, and market conditions that are most favorable to success, this method enables firms to focus on target countries, maximize returns, and global expansion with data, backed by accuracy.
By factoring in the projected importer demand gap that is currently unmet and could be potential opportunity, it identifies the potential for the Exporter (Country) among 190 countries, against the general trade analysis, which identifies the biggest importer or exporter.
To discover high-growth global markets and optimize your business strategy:
Click Here
Pricing
- Single User License$ 1,995
- Department License$ 2,400
- Site License$ 3,120
- Global License$ 3,795

Search
Thought Leadership and Analyst Meet


Our Clients
Latest Reports
- India Electromagnetic Bulk Flow Meter Market (2026-2032) | Analysis, Challenges, Strategic Insights, Supply, Forecast, Growth, Share, Consumer Insights, Competitive, Value, Outlook, Size & Demand,
- India Battery Powered Bulk Flow Meter Market (2026-2032) | Outlook, Analysis, Competitive Landscape, Growth, Size, Trends, Value, Revenue, Companies, Segmentation, Share & Forecast
- Bosnia and Herzegovina Fuel-Efficient Winglets Market (2026-2032) | Growth, Competition, Strategy, Restraints, Trends, Challenges, segmentation, Value, Outlook, Investment Opportunities, Analysis, Revenue, Companies, Insights, Pricing, Size, Drivers, Demand, Share, Forecast
- Canada Cloud CFD Market (2026-2032) | Size & Revenue, Industry, Growth, Competitive Landscape, Forecast, Segmentation, Value, Outlook, Trends, Share, Analysis, Companies
- Taiwan Food Delivery Platform Market (2026-2032) | Companies, Outlook, Analysis, Trends, Value, Revenue, Segmentation, Share, Forecast, Competitive Landscape, Growth, Size & Forecast
- United Kingdom (UK) Long-term Care Insurance Market (2026-2032) | Growth, Share, Consumer Insights, Drivers, Opportunities, Competition, Pricing Analysis, Segments, Restraints, Companies, Competitive, Value, Outlook, Size, Demand, Analysis, Challenges, Strategic Insights, Investment Trends, Revenue, Trends, Supply, Forecast
- United Kingdom (UK) Long Term Care Market (2026-2032) | Companies, Outlook, Analysis, Trends, Value, Revenue, Segmentation, Share, Forecast, Competitive Landscape, Growth, Size & Forecast
- Iraq Insulation and Waterproofing Market (2026-2032) | Outlook, Drivers, Growth, Size, Share, Industry, Revenue, Trends, Demand, Competitive, Strategic Insights, Opportunities, Segments, Companies, Challenges, Strategy, Consumer Insights, Analysis, Investment Trends, Value, Segmentation, Forecast, Restraints
- India Switchgear Market Outlook (2026-2032) | Size, Share, Trends, Growth, Revenue, Forecast, Analysis, Value, Outlook
- Pakistan Contraceptive Implants Market (2025-2031) | Demand, Growth, Size, Share, Industry, Pricing Analysis, Competitive, Strategic Insights, Strategy, Consumer Insights, Analysis, Investment Trends, Opportunities, Revenue, Segments, Value, Segmentation, Supply, Forecast, Restraints, Outlook, Competition, Drivers, Trends, Companies, Challenges
Industry Events and Analyst Meet

India EV Show 2026

EV tech India Expo 2026

Auto Tech Asia 2026

Battery Tech India 2026

Smart Production Solutions Guangzhou 2026
Whitepaper
- Middle East & Africa Commercial Security Market Click here to view more.
- Middle East & Africa Fire Safety Systems & Equipment Market Click here to view more.
- GCC Drone Market Click here to view more.
- Middle East Lighting Fixture Market Click here to view more.
- GCC Physical & Perimeter Security Market Click here to view more.
6WResearch In News
- Doha a strategic location for EV manufacturing hub: IPA Qatar
- Demand for luxury TVs surging in the GCC, says Samsung
- Empowering Growth: The Thriving Journey of Bangladesh’s Cable Industry
- Demand for luxury TVs surging in the GCC, says Samsung
- Video call with a traditional healer? Once unthinkable, it’s now common in South Africa
- Intelligent Buildings To Smooth GCC’s Path To Net Zero