Europe Blockchain Technology Market (2018-2024) | Trends, Analysis, Outlook, Share, Size, Value, Revenue, Industry, Companies, Forecast & Growth
Market Forecast By Technology Types (Public Blockchain, Private and Permissioned Blockchain and Hybrid Blockchain), By Applications (Financial and Non-Financial), By End- Users (BFSI, Government and Public Sector, Transportation and Logistics, Healthcare and Pharmaceuticals, Real Estate and Others), By Countries (United Kingdom, Germany, Netherland, Malta, Switzerland, Nordic Countries and Rest of Europe), and Competitive Landscape
| Product Code: ETC000506 | Publication Date: Nov 2021 | Product Type: Report | ||
| Publisher: 6Wresearch | Author: Ravi Bhandari | No. of Pages: 151 | No. of Figures: 109 | No. of Tables: 8 |
Blockchain technology is getting widely accepted among European countries owing to increasing government initiatives planned to improve the technology coupled with surging demand for the secured database. These factors have buoyed the overall growth in the Europe blockchain technology market. Blockchain technology is further anticipated to register high growth on account of potential benefits including transparency, immutability, and security from cyber-attacks which acts as an alternative to traditional financial solutions over the coming years.According to 6Wresearch, Europe blockchain technology market size is projected to grow at a CAGR of 52.4% during 2018-24. The market registered healthy growth in revenues during 2014-17, attributed to the surge in demand from end-users such as BFSI, government, public sector, and real estate segments. BFSI industry has seen a shift from centralized infrastructure to a decentralized distributed ledger ecosystem. Even the real estate segment has inclined towards blockchain technology as blockchain constantly records and shares information which makes the process less time-consuming and reduces the risk of fraud.
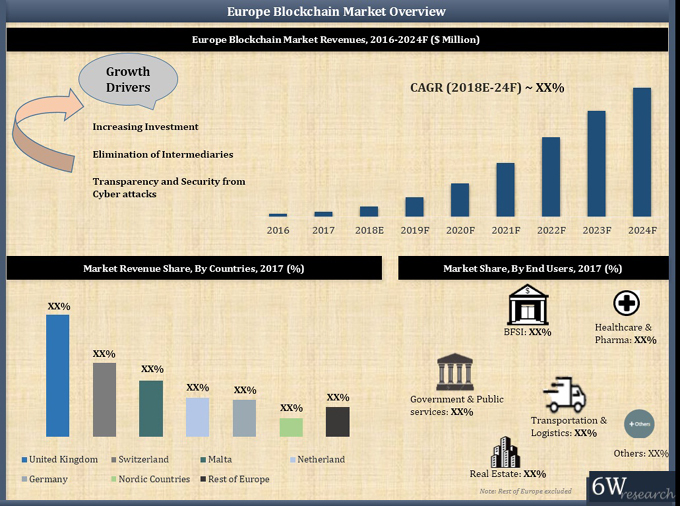
In Europe, Switzerland holds the majority of the Europe blockchain technology market share in terms of revenues due to the establishment of the crypto valley and the development of various blockchain projects in the country. Malta also contributed significantly to the overall blockchain technology and is anticipated to register healthy growth during the forecast period owing to the relocation of a few big company offices to Malta.
Some of the key players in Europe blockchain technology market include- IBM, R3, Intellectsoft, Limechain, Bitfury, N-iX, Digital Asset Holdings, and Microsoft.
The Europe blockchain technology market report thoroughly covers the Europe Blockchain Technology Market by technology type, applications, end-user, and countries. The Europe blockchain technology market outlook report also provides an unbiased and detailed analysis of the Europe blockchain technology market trends, opportunities/high growth areas, and market drivers which would help the stakeholders to device and align market strategies according to the current and future market dynamics.
Europe Blockchain Technology Market government planned to improve the technology by providing surging. Blockchain technology is register high growth in Europe. Europe blockchain is going to register high growth including transparency, immutability, and security from cyber attacks. Europe Blockchain technology market is increasing by the government initiatives planned to improve the technology. These factors going to help in the growth of the Blockchain technology market in Europe. The Blockchain technology registers a high growth rate including in the security from cyber-attacks, immutability, and transparency and used the traditional financial solution in the upcoming years. According to the research, the Europe Blockchain technology market generated more revenues and healthy growth during forecast years. There are different attributes such as the public sector, BFSI, real estate segments, and government. In Europe blockchain technology market records and share the information will help to reduce the risk of fraud.
In Europe blockchain technology is the database of the market research collaterals of the overall market and for the future prospects growth and growth strategies used by different key players in the market to increase the growth rate in Europe of blockchain technology. There are many factors that used blockchain technology in the market such as mergers, growth analysis and recent trends, and many more. According to the report in Europe the blockchain technology, the growth rate will increase in the forecast period. The government has been the plan to achieve the target of sustainable development goals in a different region so that everyone can use blockchain technology in the market.
Europe blockchain technology market is estimated to register sound revenues in the coming years on the back of rising digitalization coupled with the penetration of the internet. Further, the emerging real estate segment is estimated to bolster the use of blockchain technology owing to the capability of the technology product of recording, and sharing information quickly along with increased emphasis over time efficiency. Additionally, the rise in the need for smooth supply chains where blockchain technology is designed to monitor the inefficiency quickly during the supply chain is estimated to spur the potential growth of the European blockchain technology market in the coming timeframe.
Key Highlights of the Report:
• Europe Blockchain Technology Market Overview
• Europe Blockchain Technology Market Outlook
• Europe Blockchain Technology Market Forecast
• Historical Data of Europe Blockchain Technology Market Revenues for the Period, 2016-2017
• Europe Blockchain Technology Market Size and Europe Blockchain Technology Market Forecast, until 2024F
• Historical Data & Forecast of United Kingdom Blockchain Technology Market for the Period, 2016-2024F.
• Historical Data & Forecast of Switzerland Blockchain Technology Market for the Period, 2016-2024F.
• Historical Data & Forecast of Netherland Blockchain Technology Market for the Period, 2016-2024F.
• Historical Data & Forecast of Germany Blockchain Technology Market for the Period, 2016-2024F.
• Historical Data & Forecast of Malta Blockchain Technology Market for the Period, 2016-2024F.
• Historical Data & Forecast of Nordic Countries Blockchain Technology Market for the Period, 2016-2024F.
• Historical Data & Forecast of Rest of Europe Blockchain Technology Market Revenues for the Period, 2016-2024F.
• Market Drivers and Restraints
• Europe Blockchain Technology Market Trends and Opportunities
• Europe Blockchain Technology Market Overview on Competitive Landscape
• Europe Blockchain Technology Market Share, By Players
• Competitive Benchmarking
• Recommendations
Markets Covered:
The Europe blockchain technology market report provides a detailed analysis of the following market segments:
• By Technology Types
o Public Blockchain
o Private and Permissioned Blockchain
o Hybrid Blockchain
• By Applications
o Financial
o Non-Financial
• By End- Users
o BFSI
o Government and Public Sector
o Transportation and Logistics
o Healthcare and Pharmaceuticals
o Real Estate
o Others
• By Countries
o the United Kingdom
o Germany
o the Netherlands
o Malta
o Switzerland
o Nordic Countries
o Rest of Europe
Other Key Reports Available:
• United Kingdom Blockchain Technology Market Report
• Germany Blockchain Technology Market Report
• Netherlands Blockchain Technology Market Report
• Malta Blockchain Technology Market Report
• Switzerland Blockchain Technology Market Report
• India Blockchain Technology Market Report
Frequently Asked Questions About the Market Study (FAQs):
6Wresearch actively monitors the Europe Blockchain Technology Market and publishes its comprehensive annual report, highlighting emerging trends, growth drivers, revenue analysis, and forecast outlook. Our insights help businesses to make data-backed strategic decisions with ongoing market dynamics. Our analysts track relevent industries related to the Europe Blockchain Technology Market, allowing our clients with actionable intelligence and reliable forecasts tailored to emerging regional needs.
Yes, we provide customisation as per your requirements. To learn more, feel free to contact us on sales@6wresearch.com
1 Executive Summary
2 Introduction
2.1 Key Highlights of the Report
2.2 Report Description
2.3 Market Scope & Segmentation
2.4 Research Methodology
2.5 Assumptions
3 Europe Blockchain Technology Market Overview
3.1 Europe Blockchain Technology Market Revenues (2016-2024F)
3.2 Europe Blockchain Technology Market-Working Model
3.3 Europe Blockchain Technology Market- Industry Life Cycle
3.4 Europe Blockchain Technology Market- Porter's Five Forces Model
3.5 Europe Blockchain Technology Market Opportunity Matrix, By Technology Type
3.6 Europe Blockchain Technology Market- Eco System
3.7 Europe Blockchain Technology Market Revenue Share, By Countries (2017 & 2024F)
4 Europe Blockchain Technology Market Dynamics
4.1 Impact Analysis
4.2 Market Drivers
4.3 Market Restraints
5 Europe Blockchain Technology Market Trends
6 United Kingdom Blockchain Technology Market Overview
6.1 United Kingdom Blockchain Technology Market Revenues (2016-2024F)
6.1.1 United Kingdom Public Blockchain Technology Market Revenues (2016-2024F)
6.1.2 United Kingdom Private Blockchain Technology Market Revenues (2016-2024F)
6.1.3 United Kingdom Hybrid Blockchain Technology Market Revenues (2016-2024F)
6.2 United Kingdom Financial And Non-Financial Application Blockchain Technology Market Revenues (2016-2024F)
6.2.1 United Kingdom BFSI Blockchain Technology Market Revenues (2016-2024F)
6.2.2 United Kingdom Government and Public Services Blockchain Technology Market Revenues (2016-2024F)
6.2.3 United Kingdom Transport and Logistics Blockchain Technology Market Revenues (2016-2024F)
6.2.4 United Kingdom Healthcare and Pharmaceuticals Blockchain Technology Market Revenues (2016-2024F)
6.2.5 United Kingdom Real Estate Blockchain Technology Market Revenues (2016-2024F)
6.2.6 United Kingdom Others Blockchain Technology Market Revenues (2016-2024F)
7 Switzerland Blockchain Technology Market Overview.
7.1 Switzerland Blockchain Technology Market Revenues (2016-2024F).
7.1.1 Switzerland Public Blockchain Technology Market Revenues (2016-2024F)
7.1.2 Switzerland Private Blockchain Technology Market Revenues (2016-2024F)
7.1.3 Switzerland Hybrid Blockchain Technology Market Revenues (2016-2024F)
7.2 Switzerland Financial And Non-Financial Application Blockchain Technology Market Revenues (2016-2024F)
7.2.1 Switzerland BFSI Blockchain Technology Market Revenues (2016-2024F)
7.2.2 Switzerland Government and Public Services Blockchain Technology Market Revenues (2016-2024F)
7.2.3 Switzerland Transport and Logistics Blockchain Technology Market Revenues (2016-2024F)
7.2.4 Switzerland Healthcare and Pharmaceuticals Blockchain Technology Market Revenues (2016-2024F)
7.2.5 Switzerland Real Estate Blockchain Technology Market Revenues (2016-2024F)
7.2.6 Switzerland Others Blockchain Technology Market Revenues (2016-2024F)
8 Netherland Blockchain Technology Market Overview
8.1 Netherland Blockchain Technology Market Revenues (2016-2024F)
8.1.1 Netherland Public Blockchain Technology Market Revenues (2016-2024F)
8.1.2 Netherland Private Blockchain Technology Market Revenues (2016-2024F)
8.1.3 Netherland Hybrid Blockchain Technology Market Revenues (2016-2024F)
8.2 Netherland Financial And Non-Financial Application Blockchain Technology Market Revenues (2016-2024F)
8.2.1 Netherland BFSI Blockchain Technology Market Revenues (2016-2024F)
8.2.2 Netherland Government and Public Services Blockchain Technology Market Revenues (2016-2024F)
8.2.3 Netherland Transport and Logistics Blockchain Technology Market Revenues (2016-2024F)
8.2.4 Netherland Healthcare and Pharmaceuticals Blockchain Technology Market Revenues (2016-2024F)
8.2.5 Netherland Real Estate Blockchain Technology Market Revenues (2016-2024F)
8.2.6 Netherland Others Blockchain Technology Market Revenues (2016-2024F)
9 Germany Blockchain Technology Market Overview
9.1 Germany Blockchain Technology Market Revenues (2016-2024F)
9.1.1 Germany Public Blockchain Technology Market Revenues (2016-2024F)
9.1.2 Germany Private Blockchain Technology Market Revenues (2016-2024F)
9.1.3 Germany Hybrid Blockchain Technology Market Revenues (2016-2024F)
9.2 Germany Financial And Non-Financial Application Blockchain Technology Market Revenues (2016-2024F)
9.2.1 Germany BFSI Blockchain Technology Market Revenues (2016-2024F)
9.2.2 Germany Government and Public Services Blockchain Technology Market Revenues (2016-2024F)
9.2.3 Germany Transport and Logistics Blockchain Technology Market Revenues (2016-2024F)
9.2.4 Germany Healthcare and Pharmaceuticals Blockchain Technology Market Revenues (2016-2024F)
9.2.5 Germany Real Estate Blockchain Technology Market Revenues (2016-2024F)
9.2.6 Germany Others Blockchain Technology Market Revenues (2016-2024F)
10 Malta Blockchain Technology Market Overview
10.1 Malta Blockchain Technology Market Revenues (2016-2024F)
10.1.1 Malta Public Blockchain Technology Market Revenues (2016-2024F)
10.1.2 Malta Private Blockchain Technology Market Revenues (2016-2024F)
10.1.3 Malta Hybrid Blockchain Technology Market Revenues (2016-2024F)
10.2 Malta Financial And Non-Financial Application Blockchain Technology Market Revenues (2016-2024F)
10.2.1 Malta BFSI Blockchain Technology Market Revenues (2016-2024F)
10.2.2 Malta Government and Public Services Blockchain Technology Market Revenues (2016-2024F)
10.2.3 Malta Transport and Logistics Blockchain Technology Market Revenues (2016-2024F)
10.2.4 Malta Healthcare and Pharmaceuticals Blockchain Technology Market Revenues (2016-2024F)
10.2.5 Malta Real Estate Blockchain Technology Market Revenues (2016-2024F)
10.2.6 Malta Others Blockchain Technology Market Revenues (2016-2024F)
11 Nordic Countries Blockchain Technology Market Overview
11.1 Nordic Countries Blockchain Technology Market Revenues (2016-2024F)
11.1.1 Nordic Countries Public Blockchain Technology Market Revenues (2016-2024F)
11.1.2 Nordic Countries Private Blockchain Technology Market Revenues (2016-2024F)
11.1.3 Nordic Countries Hybrid Blockchain Technology Market Revenues (2016-2024F)
11.2 Nordic Countries Financial And Non-Financial Application Blockchain Technology Market
Revenues (2016-2024F)
11.2.1 Nordic Countries BFSI Blockchain Technology Market Revenues (2016-2024F)
11.2.2 Nordic Countries Government and Public Services Blockchain Technology Market Revenues (2016-2024F)
11.2.3 Nordic Countries Transport and Logistics Blockchain Technology Market Revenues (2016-2024F)
11.2.4 Nordic Countries Healthcare and Pharmaceuticals Blockchain Technology Market Revenues (2016-2024F)
11.2.5 Nordic Countries Real Estate Blockchain Technology Market Revenues (2016-2024F)
11.2.6 Nordic Countries Others Blockchain Technology Market Revenues (2016-2024F)
12 Rest Of Europe Blockchain Technology Market Overview
13 Competitive Landscape
14 Company Profiles
14.1 IntellectSoft
14.2 LimeChain
14.3 N-iX
14.4 Bitfury
14.5 Microsoft UK
14.6 Digital Asset Holdings
14.7 IBM
14.8 Eleks
14.9 R3
15 Strategic Recommendations
16 Disclaimer
List of Figures
1 Europe Blockchain Technology Market Revenues, 2016-2024F ($ Million)
2 Europe Blockchain Technology Market Opportunity Matrix, By End User Vertical (2024F)
3 Europe Blockchain Technology Market Revenue Share, By Countries (2017& 2024F)
4 United Kingdom Blockchain Technology Market Revenues, 2016-2024F ($ Million)
5 United Kingdom Private Blockchain Technology Market Revenues, 2016-2024F ($ Million)
6 United Kingdom Private Blockchain Technology Market Revenue Share (2017 & 2024F)
7 United Kingdom Public Blockchain Technology Market Revenues, 2016-2024F ($ Million)
8 United Kingdom Public Blockchain Technology Market Revenue Share (2017 & 2024F)
9 United Kingdom Hybrid Blockchain Technology Market Revenues, 2016-2024F ($ Million)
10 United Kingdom Hybrid Blockchain Technology Market Revenue Share (2017 & 2024F)
11 United Kingdom Financial Blockchain Technology Market, Revenues, 2016-2024F ($ Million)
12 United Kingdom Non-Financial Blockchain Technology Market Revenue, 2016-2024F ($ Million)
13 United Kingdom Blockchain Technology Revenues, By BFSI, 2016-2024F ($ Million)
14 United Kingdom Value of Credit and Debit card purchases, 2014-2020F ($ Billion)
15 Number of ATM's in United Kingdom (per 1,00,000 adults), 2014-20F
16 United Kingdom Blockchain Technology Revenues, By Government and Public Services, 2016-2024F ($ Million)
17 United Kingdom Blockchain Technology Revenues, By Transport and Logistics, 2016-2024F ($ Million)
18 United Kingdom Major Port Traffic, 2013-2017, Q4 ($ Million Tonnes)
19 United Kingdom Blockchain Technology Revenues, By Healthcare and Pharmaceuticals, 2016-2024F ($ Million)
20 United Kingdom Digital Health market, 2014-2018 ($ Million)
21 United Kingdom Blockchain Technology Revenues, By Real Estate, 2016-2024F ($ Million)
22 United Kingdom Other Blockchain Technology Revenues, 2016-2024F ($ Million)
23 Switzerland Blockchain Technology Market Revenues, 2016-2024F ($ Million)
24 Switzerland Private Blockchain Technology Market Revenues, 2016-2024F ($ Million)
25 Switzerland Private Blockchain Technology Market Revenue Share, (2017 & 2024F)
26 Switzerland Public Blockchain Technology Market Revenues, 2016-2024F ($ Million)
27 Switzerland Public Blockchain Technology Market Revenue Share, (2017 & 2024F)
28 Switzerland Hybrid Blockchain Technology Market Revenues, 2016-2024F ($ Million)
29 Switzerland Hybrid Blockchain Technology Market Revenue Share, (2017 & 2024F)
30 Switzerland Financial Blockchain Technology Market Revenues, 2016-2024F ($ Million)
31 Switzerland Non-Financial Blockchain Technology Market Revenues, 2016-2024F ($ Million)
32 Switzerland Blockchain Technology Revenues, By BFSI, 2016-2024F ($ Million)
33 Transaction And Value Proportion Of Payment Methods In Switzerland (%), 2017
34 Switzerland Blockchain Technology Revenues, By Government and Public Services, 2016-2024F ($ Million)
35 Switzerland Blockchain Technology Revenues, By Transport and Logistics, 2016-2024F ($ Million)
36 Switzerland Air Freight (million ton-km), 2014-2017
37 Switzerland Blockchain Technology Revenues, By Healthcare and Pharmaceuticals, 2016-2024F ($ Million)
38 Switzerland Blockchain Technology Revenues, By Real Estate, 2016-2024F ($ Million)
39 Switzerland Commercial Real Estate Transaction Volume, 2014-2017 ($ million)
40 Switzerland Estimated Real Estate Transaction Volume-By Sector, 2014-2017(%)
41 Switzerland Other Blockchain Technology Revenues, 2016-2024F ($ Million)
42 Netherland Blockchain Technology Market Revenues, 2016-2024F ($ Million)
43 Netherland Private Blockchain Technology Market Revenues, 2016-2024F ($ Million)
44 Netherland Private Blockchain Technology Market Revenue Share (2017 & 2024F)
45 Netherland Public Blockchain Technology Market Revenues, 2016-2024F ($ Million)
46 Netherland Public Blockchain Technology Market Revenue Share (2017 & 2024F)
47 Netherland Hybrid Blockchain Technology Market Revenues, 2016-2024F ($ Million)
48 Netherland Hybrid Blockchain Technology Market Revenue Share (2017 & 2024F)
49 Netherland Financial Blockchain Technology Market, Revenues, 2016-2024F ($ Million)
50 Netherland Non-Financial Blockchain Technology Market Revenue, 2016-2024F ($ Million)
51 Netherland Blockchain Technology Revenues, By BFSI, 2016-2024F ($ Million)
52 Netherland Online Payment Market Revenue Share, By Instruments , 2017
53 Netherland Blockchain Technology Revenues, By Government and Public Services, 2016-2024F ($ Million)
54 Netherland Blockchain Technology Revenues, By Transport and Logistics, 2016-2024F ($ Million)
55 Netherland Total Number of Containers at Port of Rotterdam, 2014-2017
56 Netherland Blockchain Technology Revenues, By Healthcare and Pharmaceuticals, 2016-2024F ($ Million)
57 Netherland Blockchain Technology Revenues, By Real Estate, 2016-2024F ($ Million)
58 Netherland Real Estate Market Investment, 2014-2016 ($ Billion)
59 Netherland Other Blockchain Technology Revenues, 2016-2024F ($ Million)
60 Germany Blockchain Technology Market Revenues, 2016-2024F ($ Million)
61 Germany Private Blockchain Technology Market Revenues, 2016-2024F ($ Million)
62 Germany Private Blockchain Technology Market Revenue Share (2017 & 2024F)
63 Germany Public Blockchain Technology Market Revenues, 2016-2024F ($ Million)
64 Germany Public Blockchain Technology Market Revenue Share (2017 & 2024F)
65 Germany Hybrid Blockchain Technology Market Revenues, 2016-2024F ($ Million)
66 Germany Hybrid Blockchain Technology Market Revenue Share (2017 & 2024F)
67 Germany Financial Blockchain Technology Market, Revenues, 2016-2024F ($ Million)
68 Germany Non -Financial Blockchain Technology Market Revenue, 2016-2024F ($ Million)
69 Germany Blockchain Technology Revenues, By BFSI, 2016-2024F ($ Million)
70 Payment Methods In Germany- By Market Share (2018)
71 Germany Blockchain Technology Revenues, By Government and Public Services, 2016-2024F ($ Million)
72 Germany Blockchain Technology Revenues, By Transport and Logistics, 2016-2024F ($ Million)
73 Germany Blockchain Technology Revenues, By Healthcare and Pharmaceuticals, 2016-2024F ($ Million)
74 Germany Blockchain Technology Revenues, By Real Estate, 2016-2024F ($ Million)
75 Germany Demand For Commercial And Residential Real Estate, 2014-2017 ($ Billion)
76 Germany Other Blockchain Technology Revenues, 2016-2024F ($ Million)
77 Malta Blockchain Technology Market Revenues, 2016-2024F ($ Million)
78 Malta Private Blockchain Technology Market Revenues, 2016-2024F ($ Million)
79 Malta Private Blockchain Technology Market Revenue Share (2017 & 2024F)
80 Malta Public Blockchain Technology Market Revenues, 2016-2024F ($ Million)
81 Malta Public Blockchain Technology Market Revenue Share (2017 & 2024F)
82 Malta Hybrid Blockchain Technology Market Revenues, 2016-2024F ($ Million)
83 Malta Hybrid Blockchain Technology Market Revenue Share (2017 & 2024F)
84 Malta Financial Blockchain Technology Market Revenues, 2016-2024F ($ Million)
85 Malta Non Financial Blockchain Technology Market Revenue, 2016-2024F ($ Million)
86 Malta Blockchain Technology Revenues , By BFSI, 2016-2024F ($ Million)
87 Payment Methods In Malta - By Market Share (2018)
88 Malta Blockchain Technology Revenues, By Government and Public Services, 2016-2024F ($ Million)
89 Malta Blockchain Technology Revenues, By Transport and Logistics, 2016-2024F ($ Million)
90 Malta Blockchain Technology Revenues, By Healthcare and Pharmaceuticals, 2016-2024F ($ Million)
91 Malta Blockchain Technology Revenues, By Real Estate, 2016-2024F ($ Million)
92 Malta Other Blockchain Technology Revenues, 2016-2024F ($ Million)
93 Nordic Countries Blockchain Technology Market Revenues, 2016-2024F ($ Million)
94 Nordic Countries Private Blockchain Technology Market Revenues, 2016-2024F ($ Million)
95 Nordic Countries Private Blockchain Technology Market Revenue Share (2017 & 2024F)
96 Nordic Countries Public Blockchain Technology Market Revenues, 2014-2024F ($ Million)
97 Nordic Countries Public Blockchain Technology Market Revenue Share (2017 & 2024F)
98 Nordic Countries Hybrid Blockchain Technology Market Revenues, 2016-2024F ($ Million)
99 Nordic Countries Hybrid Blockchain Technology Market Revenue Share (2017 & 2024F)
100 Nordic Countries Financial Blockchain Technology Market, Revenues, 2016-2024F ($ Million)
101 Nordic Countries Non Financial Blockchain Technology Market Revenue, 2016-2024F ($ Million)
102 Nordic Countries Blockchain Technology Revenues, By BFSI, 2016-2024F ($ Million)
103 Nordic Countries Blockchain Technology Revenues, By Government and Public Services, 2016-2024F ($ Million)
104 Nordic Countries Blockchain Technology Revenues, By Transport and Logistics, 2016-2024F ($ Million)
105 Nordic Countries Blockchain Technology Revenues, By Healthcare and Pharmaceuticals, 2016-2024F ($ Million)
106 Nordic Countries Blockchain Technology Revenues, By Real Estate, 2016-2024F ($ Million)
107 Nordic Countries Other Blockchain Technology Revenues, 2016-2024F ($ Million)
108 Rest Of Europe Blockchain Technology Market Revenues, 2016-2024F ($ Million)
109 Europe Blockchain Technology Market Ranking, By Companies, 2017
List of Tables
1 United Kingdom Share of Digital Public Services, 2016-2017
2 United Kingdom Digital Public Services Ranking, 2016-2017
3 Netherland Share of Digital Public Services, 2016-2017
4 Netherland Digital Public Services Ranking, 2016-2017
5 Germany Share of Digital Public Services, 2017-2018
6 Germany Digital Public Services Ranking, 2017-2018
7 Malta Share of Digital Public Services, 2016-2017
8 Malta Digital Public Services Ranking, 2016-2017
Global Go To Market Strategy - 2030
Export potential enables firms to identify high-growth global markets with greater confidence by combining advanced trade intelligence with a structured quantitative methodology. The framework analyzes emerging demand trends and country-level import patterns while integrating macroeconomic and trade datasets such as GDP and population forecasts, bilateral import–export flows, tariff structures, elasticity differentials between developed and developing economies, geographic distance, and import demand projections. Using weighted trade values from 2020–2024 as the base period to project country-to-country export potential for 2030, these inputs are operationalized through calculated drivers such as gravity model parameters, tariff impact factors, and projected GDP per-capita growth. Through an analysis of hidden potentials, demand hotspots, and market conditions that are most favorable to success, this method enables firms to focus on target countries, maximize returns, and global expansion with data, backed by accuracy.
By factoring in the projected importer demand gap that is currently unmet and could be potential opportunity, it identifies the potential for the Exporter (Country) among 190 countries, against the general trade analysis, which identifies the biggest importer or exporter.
To discover high-growth global markets and optimize your business strategy:
Click Here
Pricing
- Single User License$ 4,560
- Department License$ 5,055
- Site License$ 5,595
- Global License$ 6,000

Leadership Perspectives from Industry Events
Search
Thought Leadership and Analyst Meet


Our Clients
6WResearch In News
- India Air Conditioner Market Set for Strong Rebound in 2026 After Weather-Led Correction and GST-Driven Recovery: 6Wresearch
- ADAS in India: How Automatic Emergency Braking, Blind Spot Detection & Driver Monitoring are Transforming Road Safety
- Doha a strategic location for EV manufacturing hub: IPA Qatar
- Demand for luxury TVs surging in the GCC, says Samsung
- Empowering Growth: The Thriving Journey of Bangladesh’s Cable Industry
- Demand for luxury TVs surging in the GCC, says Samsung
Latest Reports
- Nicaragua RPG Gaming Market (2026-2032)
- New Zealand RPG Gaming Market (2026-2032)
- Netherlands RPG Gaming Market (2026-2032)
- Nauru RPG Gaming Market (2026-2032)
- Namibia RPG Gaming Market (2026-2032)
- Mozambique RPG Gaming Market (2026-2032)
- Montenegro RPG Gaming Market (2026-2032)
- Mongolia RPG Gaming Market (2026-2032)
- Monaco RPG Gaming Market (2026-2032)
- Micronesia RPG Gaming Market (2026-2032)
Industry Events and Analyst Meet

EV India Expo 2026

HIMTEX 2026

India Refining Summit 2026

India EV Show 2026

EV tech India Expo 2026
Whitepaper
- Middle East & Africa Commercial Security Market Click here to view more.
- Middle East & Africa Fire Safety Systems & Equipment Market Click here to view more.
- GCC Drone Market Click here to view more.
- Middle East Lighting Fixture Market Click here to view more.
- GCC Physical & Perimeter Security Market Click here to view more.