Fiji Disposable Paper Cup Market (2026-2032) | Companies, Segmentation, Forecast, Growth, Trends, Outlook, Size, Industry, Revenue, Share, Value & Analysis
Market Forecast By Type (Air Pocket Insulated, Poly-coated Paper, Wax-coated Paper, Others), By End-user (Residential, Commercial, Cafe & QSR, Transportation Industry, Event Management, Corporate Sector), By Distribution Channel (Online, E-commerce Portal, Company Owned Portal, Offline) And Competitive Landscape
| Product Code: ETC5265903 | Publication Date: Nov 2023 | Updated Date: Apr 2026 | Product Type: Market Research Report | |
| Publisher: 6Wresearch | Author: Ravi Bhandari | No. of Pages: 60 | No. of Figures: 30 | No. of Tables: 5 |
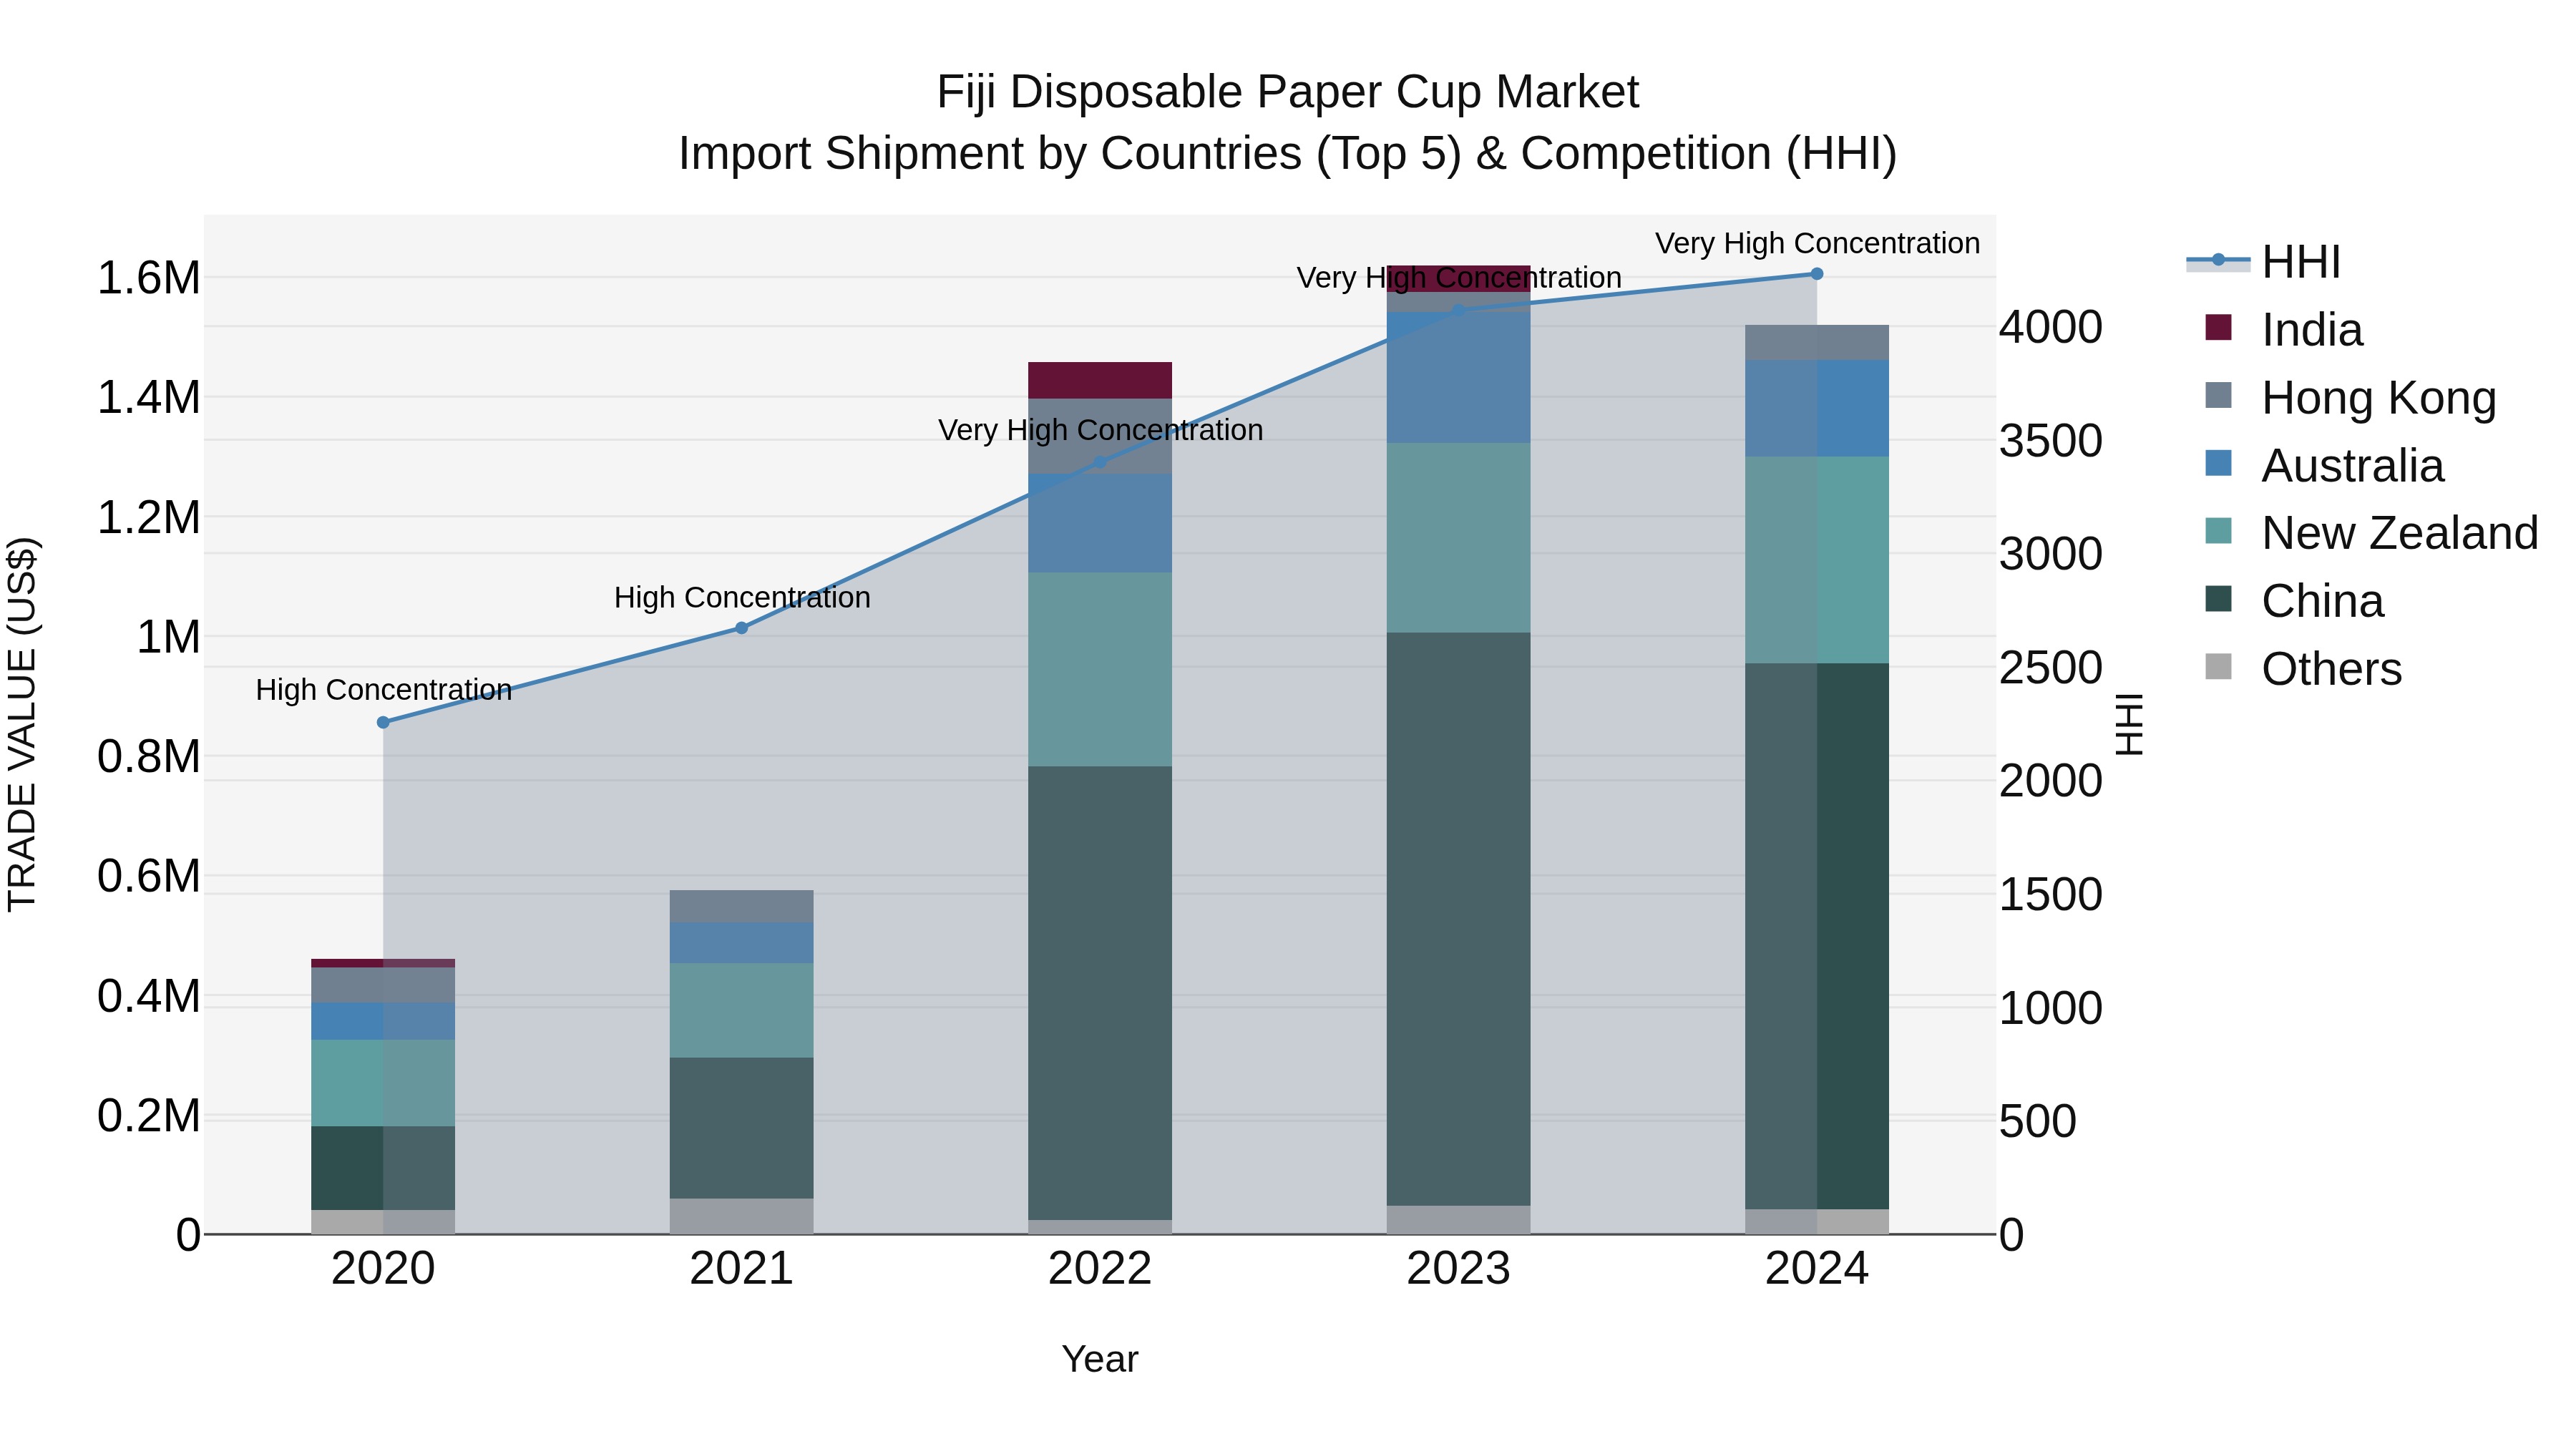
Fiji Disposable Paper Cup Market Top 5 Importing Countries and Market Competition (HHI) Analysis
Despite a slight decline in growth rate in 2024, Fiji`s disposable paper cup import market continues to be dominated by a few key players, with a high Herfindahl-Hirschman Index indicating significant market concentration. Top exporters to Fiji such as China, New Zealand, Australia, Hong Kong, and Singapore are likely to maintain their strong presence in the market. The impressive compound annual growth rate (CAGR) of 34.79% from 2020 to 2024 underscores the increasing demand for disposable paper cups in Fiji, reflecting potential opportunities for both local and international suppliers to explore.
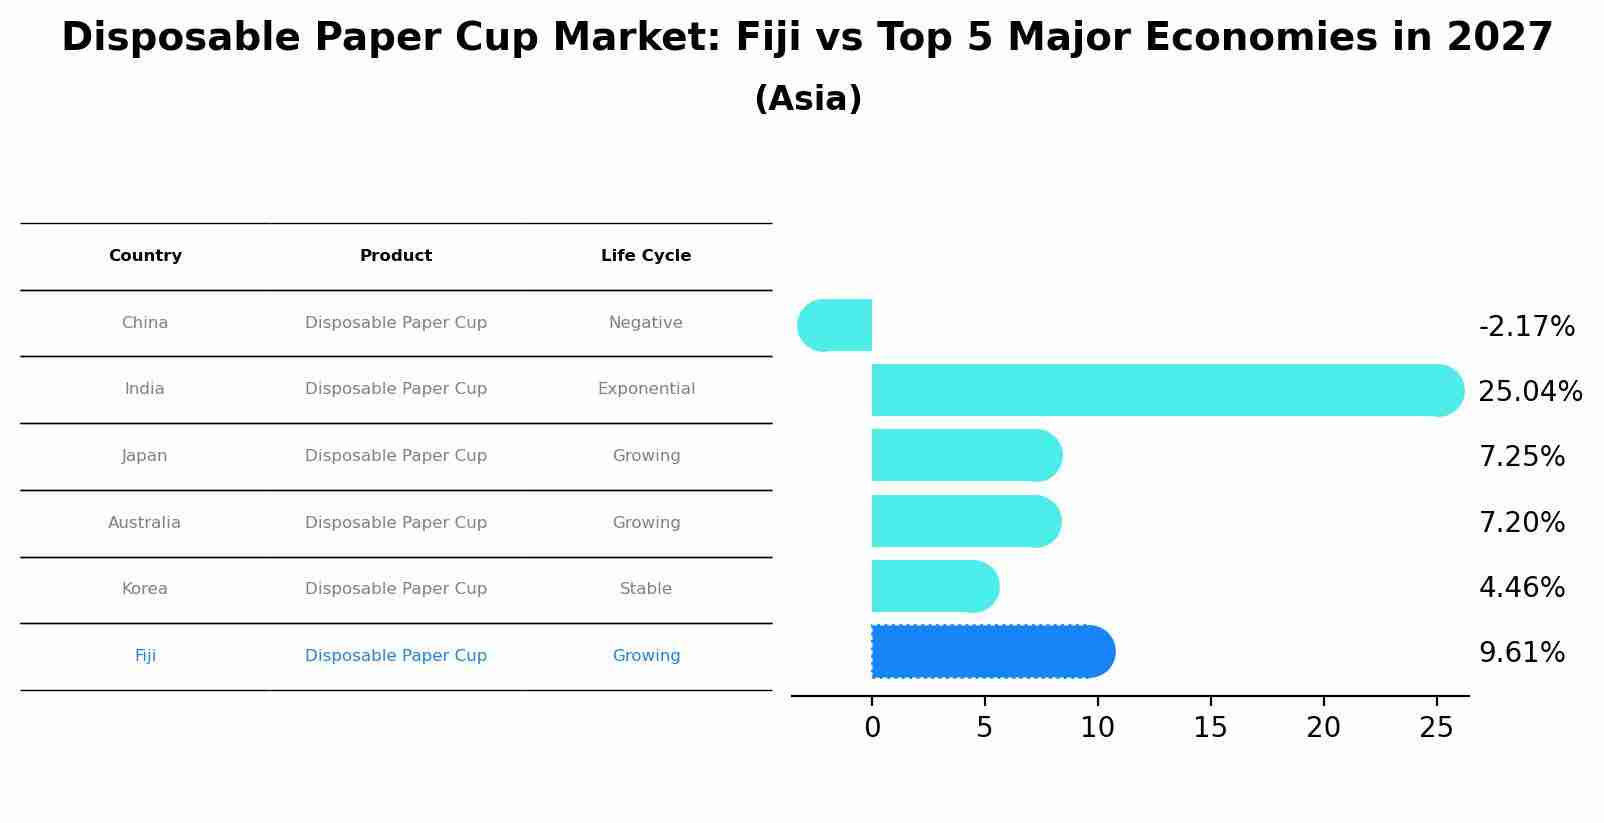
Disposable Paper Cup Market: Fiji vs Top 5 Major Economies in 2027 (Asia)
Fiji's Disposable Paper Cup market is anticipated to experience a growing growth rate of 9.61% by 2027, reflecting trends observed in the largest economy China, followed by India, Japan, Australia and South Korea.
Key Highlights of the Report:
- Fiji Disposable Paper Cup Market Outlook
- Market Size of Fiji Disposable Paper Cup Market, 2025
- Forecast of Fiji Disposable Paper Cup Market, 2032
- Historical Data and Forecast of Fiji Disposable Paper Cup Revenues & Volume for the Period 2022 - 2032F
- Fiji Disposable Paper Cup Market Trend Evolution
- Fiji Disposable Paper Cup Market Drivers and Challenges
- Fiji Disposable Paper Cup Price Trends
- Fiji Disposable Paper Cup Porter`s Five Forces
- Fiji Disposable Paper Cup Industry Life Cycle
- Historical Data and Forecast of Fiji Disposable Paper Cup Market Revenues & Volume By Type for the Period 2022 - 2032F
- Historical Data and Forecast of Fiji Disposable Paper Cup Market Revenues & Volume By Air Pocket Insulated for the Period 2022 - 2032F
- Historical Data and Forecast of Fiji Disposable Paper Cup Market Revenues & Volume By Poly-coated Paper for the Period 2022 - 2032F
- Historical Data and Forecast of Fiji Disposable Paper Cup Market Revenues & Volume By Wax-coated Paper for the Period 2022 - 2032F
- Historical Data and Forecast of Fiji Disposable Paper Cup Market Revenues & Volume By Others for the Period 2022 - 2032F
- Historical Data and Forecast of Fiji Disposable Paper Cup Market Revenues & Volume By End-user for the Period 2022 - 2032F
- Historical Data and Forecast of Fiji Disposable Paper Cup Market Revenues & Volume By Residential for the Period 2022 - 2032F
- Historical Data and Forecast of Fiji Disposable Paper Cup Market Revenues & Volume By Commercial for the Period 2022 - 2032F
- Historical Data and Forecast of Fiji Disposable Paper Cup Market Revenues & Volume By Cafe & QSR for the Period 2022 - 2032F
- Historical Data and Forecast of Fiji Disposable Paper Cup Market Revenues & Volume By Transportation Industry for the Period 2022 - 2032F
- Historical Data and Forecast of Fiji Disposable Paper Cup Market Revenues & Volume By Event Management for the Period 2022 - 2032F
- Historical Data and Forecast of Fiji Disposable Paper Cup Market Revenues & Volume By Corporate Sector for the Period 2022 - 2032F
- Historical Data and Forecast of Fiji Disposable Paper Cup Market Revenues & Volume By Distribution Channel for the Period 2022 - 2032F
- Historical Data and Forecast of Fiji Disposable Paper Cup Market Revenues & Volume By Online for the Period 2022 - 2032F
- Historical Data and Forecast of Fiji Disposable Paper Cup Market Revenues & Volume By E-commerce Portal for the Period 2022 - 2032F
- Historical Data and Forecast of Fiji Disposable Paper Cup Market Revenues & Volume By Company Owned Portal for the Period 2022 - 2032F
- Historical Data and Forecast of Fiji Disposable Paper Cup Market Revenues & Volume By Offline for the Period 2022 - 2032F
- Fiji Disposable Paper Cup Import Export Trade Statistics
- Market Opportunity Assessment By Type
- Market Opportunity Assessment By End-user
- Market Opportunity Assessment By Distribution Channel
- Fiji Disposable Paper Cup Top Companies Market Share
- Fiji Disposable Paper Cup Competitive Benchmarking By Technical and Operational Parameters
- Fiji Disposable Paper Cup Company Profiles
- Fiji Disposable Paper Cup Key Strategic Recommendations
Frequently Asked Questions About the Market Study (FAQs):
6Wresearch actively monitors the Fiji Disposable Paper Cup Market and publishes its comprehensive annual report, highlighting emerging trends, growth drivers, revenue analysis, and forecast outlook. Our insights help businesses to make data-backed strategic decisions with ongoing market dynamics. Our analysts track relevent industries related to the Fiji Disposable Paper Cup Market, allowing our clients with actionable intelligence and reliable forecasts tailored to emerging regional needs.
Yes, we provide customisation as per your requirements. To learn more, feel free to contact us on sales@6wresearch.com
1 Executive Summary |
2 Introduction |
2.1 Key Highlights of the Report |
2.2 Report Description |
2.3 Market Scope & Segmentation |
2.4 Research Methodology |
2.5 Assumptions |
3 Fiji Disposable Paper Cup Market Overview |
3.1 Fiji Country Macro Economic Indicators |
3.2 Fiji Disposable Paper Cup Market Revenues & Volume, 2022 & 2032F |
3.3 Fiji Disposable Paper Cup Market - Industry Life Cycle |
3.4 Fiji Disposable Paper Cup Market - Porter's Five Forces |
3.5 Fiji Disposable Paper Cup Market Revenues & Volume Share, By Type, 2022 & 2032F |
3.6 Fiji Disposable Paper Cup Market Revenues & Volume Share, By End-user, 2022 & 2032F |
3.7 Fiji Disposable Paper Cup Market Revenues & Volume Share, By Distribution Channel, 2022 & 2032F |
4 Fiji Disposable Paper Cup Market Dynamics |
4.1 Impact Analysis |
4.2 Market Drivers |
4.2.1 Increasing awareness about environmental sustainability leading to a shift towards eco-friendly disposable paper cups |
4.2.2 Growth in the food and beverage industry in Fiji driving the demand for disposable paper cups |
4.2.3 Rise in disposable income and changing consumer lifestyles increasing the consumption of on-the-go beverages |
4.3 Market Restraints |
4.3.1 Fluctuating raw material prices affecting the production cost of disposable paper cups |
4.3.2 Lack of recycling infrastructure in Fiji leading to environmental concerns associated with disposable paper cup waste |
5 Fiji Disposable Paper Cup Market Trends |
6 Fiji Disposable Paper Cup Market Segmentations |
6.1 Fiji Disposable Paper Cup Market, By Type |
6.1.1 Overview and Analysis |
6.1.2 Fiji Disposable Paper Cup Market Revenues & Volume, By Air Pocket Insulated, 2022 - 2032F |
6.1.3 Fiji Disposable Paper Cup Market Revenues & Volume, By Poly-coated Paper, 2022 - 2032F |
6.1.4 Fiji Disposable Paper Cup Market Revenues & Volume, By Wax-coated Paper, 2022 - 2032F |
6.1.5 Fiji Disposable Paper Cup Market Revenues & Volume, By Others, 2022 - 2032F |
6.2 Fiji Disposable Paper Cup Market, By End-user |
6.2.1 Overview and Analysis |
6.2.2 Fiji Disposable Paper Cup Market Revenues & Volume, By Residential, 2022 - 2032F |
6.2.3 Fiji Disposable Paper Cup Market Revenues & Volume, By Commercial, 2022 - 2032F |
6.2.4 Fiji Disposable Paper Cup Market Revenues & Volume, By Cafe & QSR, 2022 - 2032F |
6.2.5 Fiji Disposable Paper Cup Market Revenues & Volume, By Transportation Industry, 2022 - 2032F |
6.2.6 Fiji Disposable Paper Cup Market Revenues & Volume, By Event Management, 2022 - 2032F |
6.2.7 Fiji Disposable Paper Cup Market Revenues & Volume, By Corporate Sector, 2022 - 2032F |
6.3 Fiji Disposable Paper Cup Market, By Distribution Channel |
6.3.1 Overview and Analysis |
6.3.2 Fiji Disposable Paper Cup Market Revenues & Volume, By Online, 2022 - 2032F |
6.3.3 Fiji Disposable Paper Cup Market Revenues & Volume, By E-commerce Portal, 2022 - 2032F |
6.3.4 Fiji Disposable Paper Cup Market Revenues & Volume, By Company Owned Portal, 2022 - 2032F |
6.3.5 Fiji Disposable Paper Cup Market Revenues & Volume, By Offline, 2022 - 2032F |
7 Fiji Disposable Paper Cup Market Import-Export Trade Statistics |
7.1 Fiji Disposable Paper Cup Market Export to Major Countries |
7.2 Fiji Disposable Paper Cup Market Imports from Major Countries |
8 Fiji Disposable Paper Cup Market Key Performance Indicators |
8.1 Percentage of disposable paper cups made from sustainable or recycled materials |
8.2 Adoption rate of eco-friendly disposable paper cup alternatives in Fiji |
8.3 Growth in the number of cafes/restaurants promoting the use of disposable paper cups for takeaways |
9 Fiji Disposable Paper Cup Market - Opportunity Assessment |
9.1 Fiji Disposable Paper Cup Market Opportunity Assessment, By Type, 2022 & 2032F |
9.2 Fiji Disposable Paper Cup Market Opportunity Assessment, By End-user, 2022 & 2032F |
9.3 Fiji Disposable Paper Cup Market Opportunity Assessment, By Distribution Channel, 2022 & 2032F |
10 Fiji Disposable Paper Cup Market - Competitive Landscape |
10.1 Fiji Disposable Paper Cup Market Revenue Share, By Companies, 2025 |
10.2 Fiji Disposable Paper Cup Market Competitive Benchmarking, By Operating and Technical Parameters |
11 Company Profiles |
12 Recommendations | 13 Disclaimer |
Export potential assessment - trade Analytics for 2030
Export potential enables firms to identify high-growth global markets with greater confidence by combining advanced trade intelligence with a structured quantitative methodology. The framework analyzes emerging demand trends and country-level import patterns while integrating macroeconomic and trade datasets such as GDP and population forecasts, bilateral import–export flows, tariff structures, elasticity differentials between developed and developing economies, geographic distance, and import demand projections. Using weighted trade values from 2020–2024 as the base period to project country-to-country export potential for 2030, these inputs are operationalized through calculated drivers such as gravity model parameters, tariff impact factors, and projected GDP per-capita growth. Through an analysis of hidden potentials, demand hotspots, and market conditions that are most favorable to success, this method enables firms to focus on target countries, maximize returns, and global expansion with data, backed by accuracy.
By factoring in the projected importer demand gap that is currently unmet and could be potential opportunity, it identifies the potential for the Exporter (Country) among 190 countries, against the general trade analysis, which identifies the biggest importer or exporter.
To discover high-growth global markets and optimize your business strategy:
Click Here
Pricing
- Single User License$ 1,995
- Department License$ 2,400
- Site License$ 3,120
- Global License$ 3,795

Search
Thought Leadership and Analyst Meet


Our Clients
Latest Reports
- India Ultrasonic Smart Water Meter Market (2026-2032) | Outlook, Competition, Drivers, Trends, Demand, Competitive, Strategic Insights, Companies, Challenges, Strategy, Consumer Insights, Analysis, Opportunities, Growth, Size, Share, Industry, Revenue, Segments, Value, Segmentation, Supply, Forecast, Restraints,
- India Electromagnetic Bulk Flow Meter Market (2026-2032) | Analysis, Challenges, Strategic Insights, Supply, Forecast, Growth, Share, Consumer Insights, Competitive, Value, Outlook, Size & Demand,
- India Battery Powered Bulk Flow Meter Market (2026-2032) | Outlook, Analysis, Competitive Landscape, Growth, Size, Trends, Value, Revenue, Companies, Segmentation, Share & Forecast
- Bosnia and Herzegovina Fuel-Efficient Winglets Market (2026-2032) | Growth, Competition, Strategy, Restraints, Trends, Challenges, segmentation, Value, Outlook, Investment Opportunities, Analysis, Revenue, Companies, Insights, Pricing, Size, Drivers, Demand, Share, Forecast
- Canada Cloud CFD Market (2026-2032) | Size & Revenue, Industry, Growth, Competitive Landscape, Forecast, Segmentation, Value, Outlook, Trends, Share, Analysis, Companies
- Taiwan Food Delivery Platform Market (2026-2032) | Companies, Outlook, Analysis, Trends, Value, Revenue, Segmentation, Share, Forecast, Competitive Landscape, Growth, Size & Forecast
- United Kingdom (UK) Long-term Care Insurance Market (2026-2032) | Growth, Share, Consumer Insights, Drivers, Opportunities, Competition, Pricing Analysis, Segments, Restraints, Companies, Competitive, Value, Outlook, Size, Demand, Analysis, Challenges, Strategic Insights, Investment Trends, Revenue, Trends, Supply, Forecast
- United Kingdom (UK) Long Term Care Market (2026-2032) | Companies, Outlook, Analysis, Trends, Value, Revenue, Segmentation, Share, Forecast, Competitive Landscape, Growth, Size & Forecast
- Iraq Insulation and Waterproofing Market (2026-2032) | Outlook, Drivers, Growth, Size, Share, Industry, Revenue, Trends, Demand, Competitive, Strategic Insights, Opportunities, Segments, Companies, Challenges, Strategy, Consumer Insights, Analysis, Investment Trends, Value, Segmentation, Forecast, Restraints
- India Switchgear Market Outlook (2026-2032) | Size, Share, Trends, Growth, Revenue, Forecast, Analysis, Value, Outlook
Industry Events and Analyst Meet

India EV Show 2026

EV tech India Expo 2026

Auto Tech Asia 2026

Battery Tech India 2026

Smart Production Solutions Guangzhou 2026
Whitepaper
- Middle East & Africa Commercial Security Market Click here to view more.
- Middle East & Africa Fire Safety Systems & Equipment Market Click here to view more.
- GCC Drone Market Click here to view more.
- Middle East Lighting Fixture Market Click here to view more.
- GCC Physical & Perimeter Security Market Click here to view more.
6WResearch In News
- Doha a strategic location for EV manufacturing hub: IPA Qatar
- Demand for luxury TVs surging in the GCC, says Samsung
- Empowering Growth: The Thriving Journey of Bangladesh’s Cable Industry
- Demand for luxury TVs surging in the GCC, says Samsung
- Video call with a traditional healer? Once unthinkable, it’s now common in South Africa
- Intelligent Buildings To Smooth GCC’s Path To Net Zero