Finland Agronomic Amino Acids Market (2026-2032) | Growth, Size & Revenue, Share, Industry, Forecast, Analysis, Companies, Outlook, Segmentation, Competitive Landscape, Trends, Value
Market Forecast By Type (Lysine, Thymine, Methionine, Glutamic Acid, Alanine, Leucine, Arginine, Others), By Source (Plant-based, Animal-based, Synthetic, Treatment Method, Foliar, Seed, Soil, Others), By Application (Soil Amendment, Chlorophyll Synthesis, Roots Development, Bud Growth and Leaves Development, Crop Resistance, Ripening, Others) And Competitive Landscape
| Product Code: ETC7190223 | Publication Date: Sep 2024 | Updated Date: Apr 2026 | Product Type: Market Research Report | |
| Publisher: 6Wresearch | Author: Summon Dutta | No. of Pages: 75 | No. of Figures: 35 | No. of Tables: 20 |
Finland Agronomic Amino Acids Market Size (2020-2030)
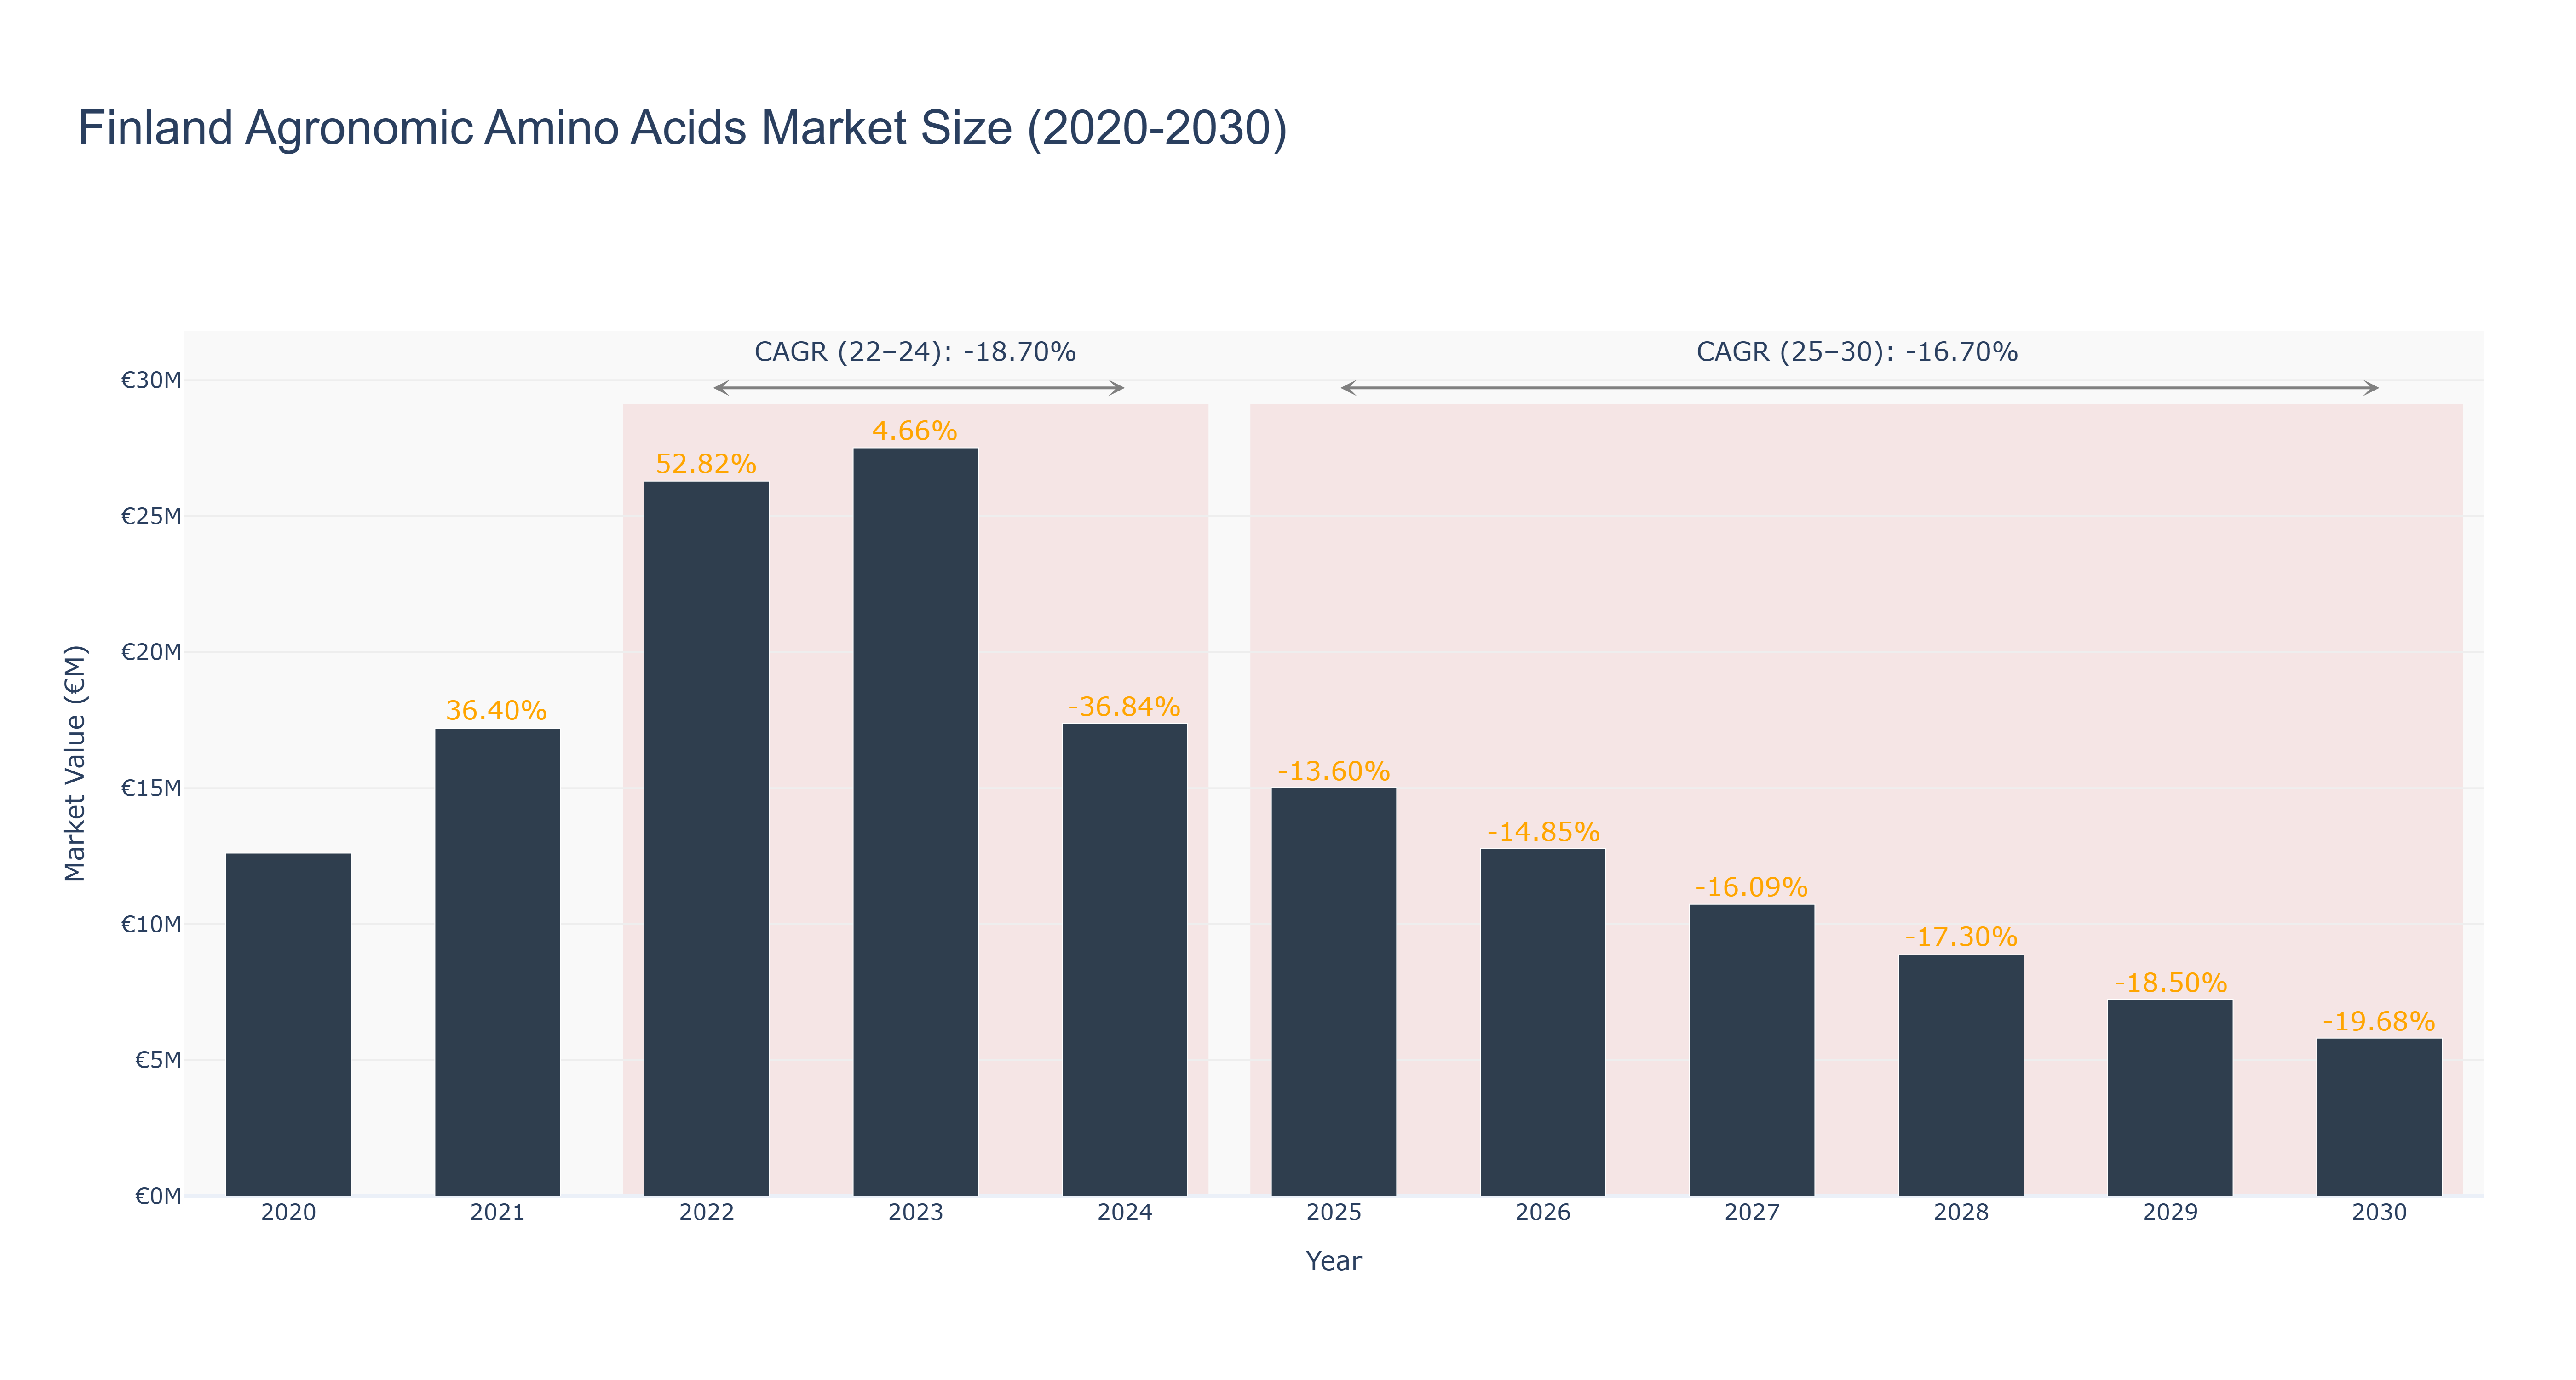
The Finland Agronomic Amino Acids Market experienced significant growth from 2020 to 2022, peaking at €26.29 million in 2022, with a remarkable growth rate of 52.82% from 2021 to 2022. However, the market has since faced a sharp decline, with actual revenues dropping to €17.38 million in 2024, reflecting a CAGR of -18.70% for the 2022-2024 period. The forecasted values indicate a continuing downward trend, with projected market sizes decreasing from €15.01 million in 2025 to €5.81 million by 2030, resulting in a CAGR of -16.70% for the 2025-2030 outlook. This contraction may be attributed to market saturation, fluctuating demand for agronomic inputs, and increased competition from alternative agricultural solutions. Despite these challenges, ongoing innovations in sustainable agriculture and potential regulatory support for healthy soil management may provide avenues for recovery and future growth in the sector.
Finland Agronomic Amino Acids Market: Production & Trade Performance (2019-2025)
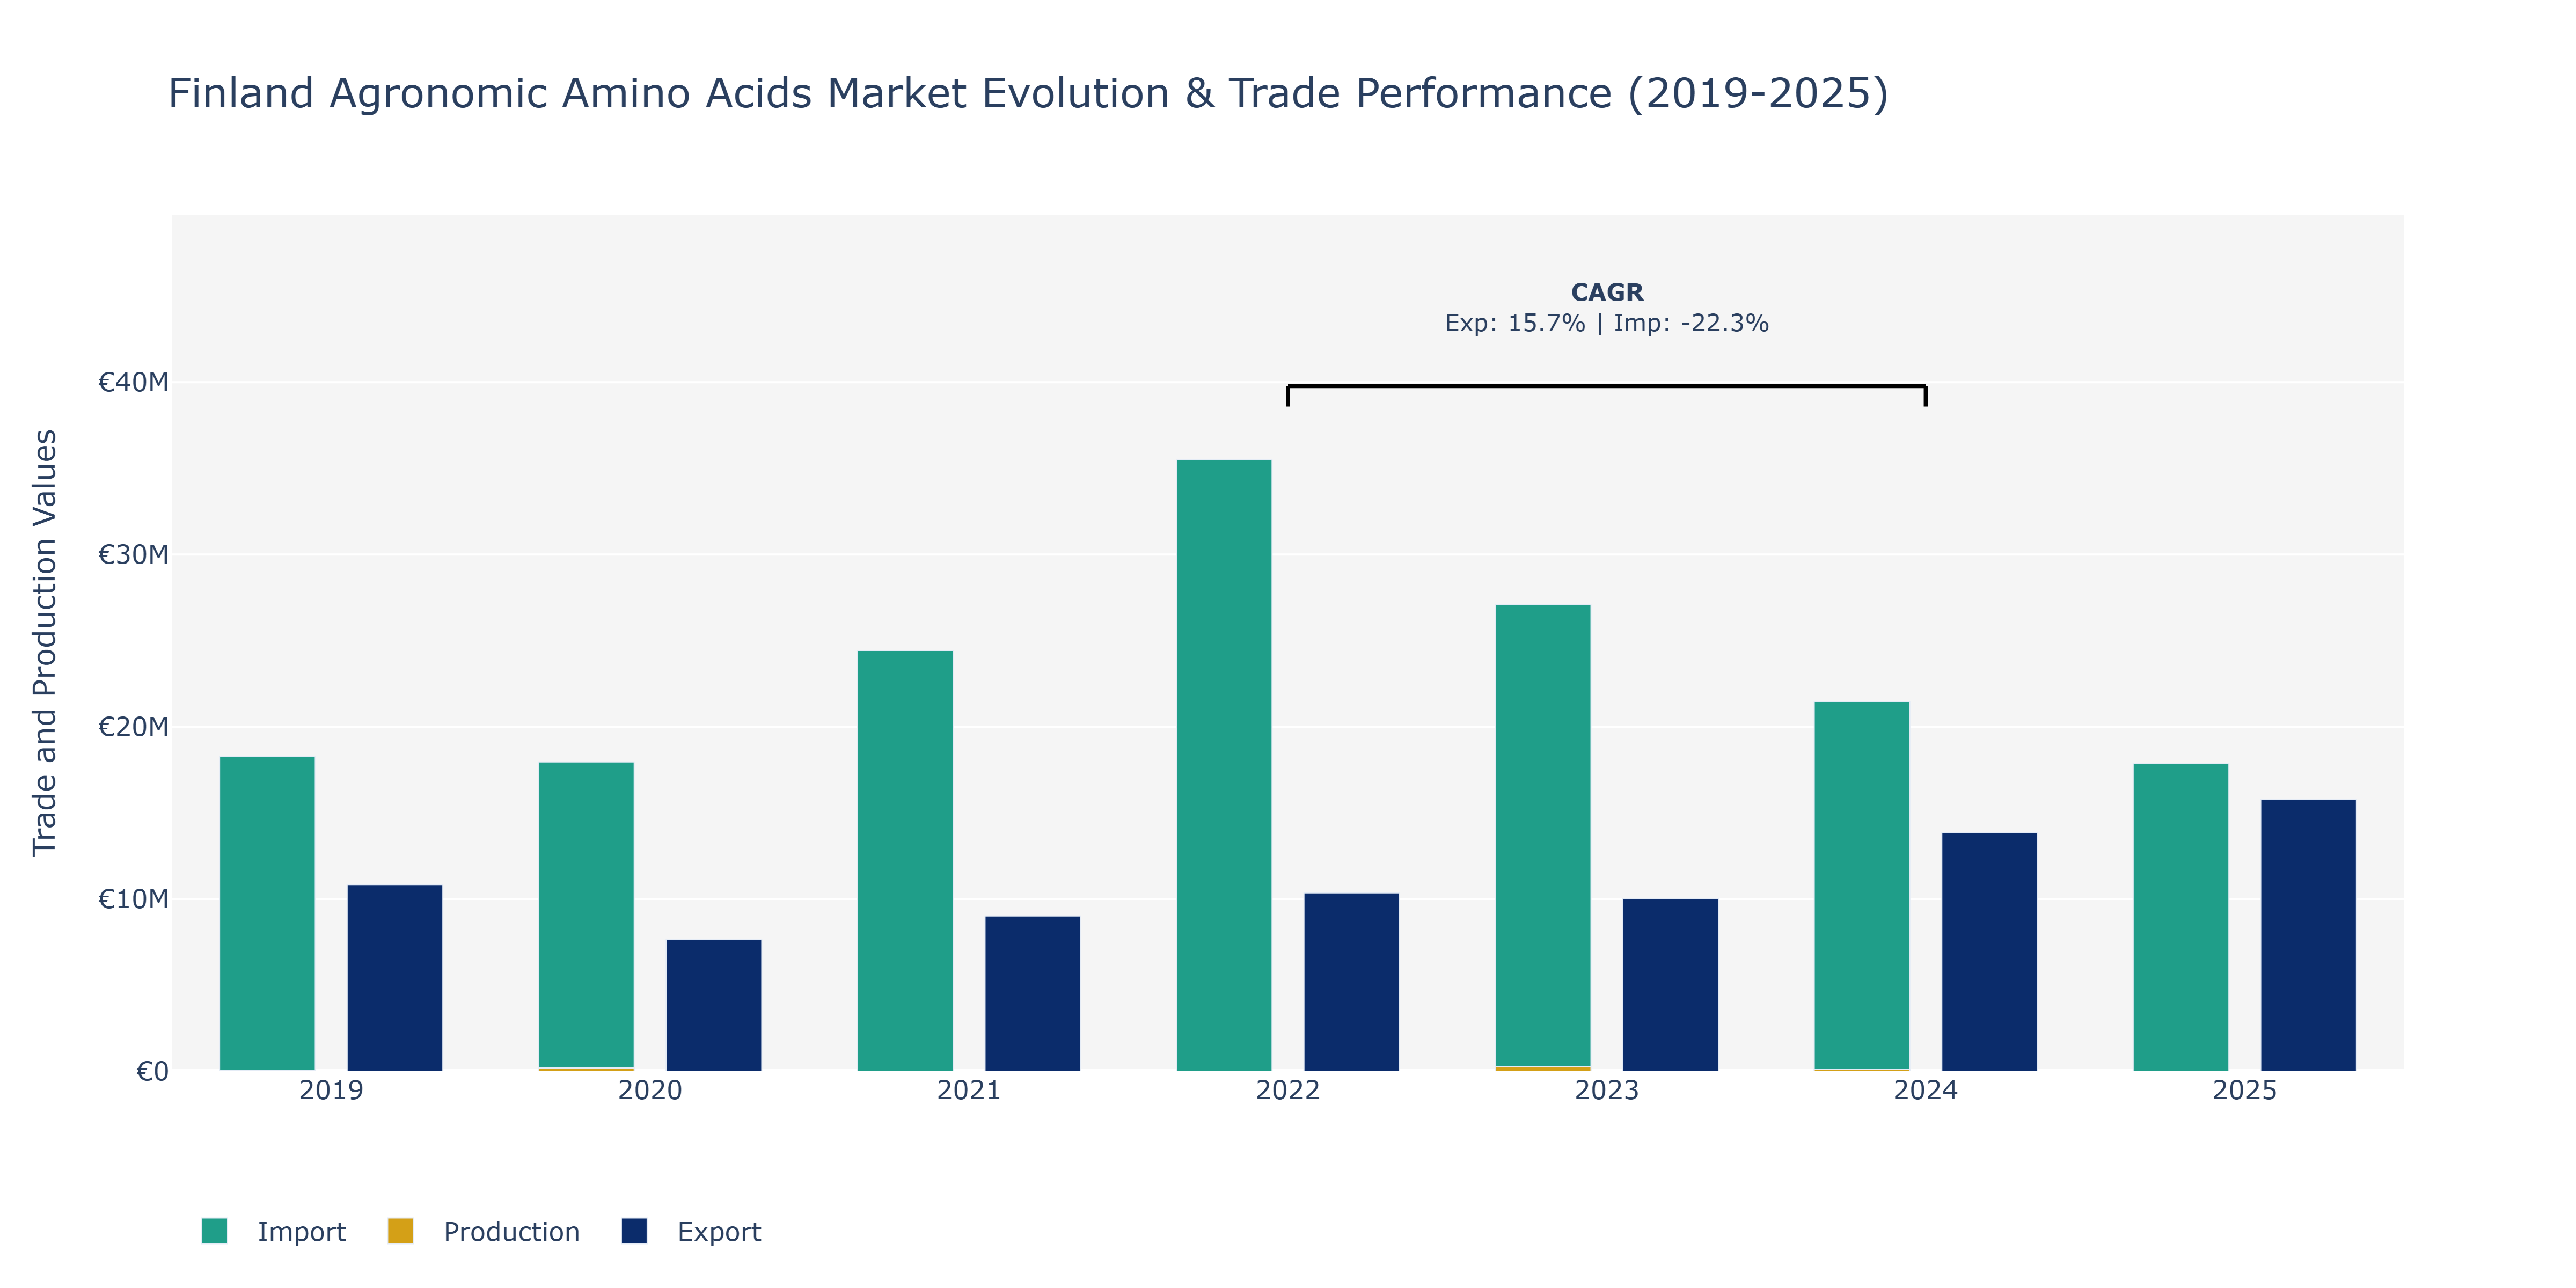
The Finland Agronomic Amino Acids market saw varying trends in exports, imports, and production from 2019 to 2025. In 2019, production stood at €32.06 million, while exports and imports were €10.84 million and €18.27 million, respectively. A peak in production was observed in 2023 at €283 million, followed by a decline to €118 million in 2024. Despite a decrease in production, exports showed a steady increase, reaching €15.78 million in 2025. Conversely, imports fluctuated, with a notable drop in 2024 to €21.45 million. This could be attributed to changes in demand for agronomic amino acids in Finland, influenced by factors like evolving agricultural practices, government regulations promoting sustainable farming, and shifts in international trade dynamics impacting import volumes. The increase in exports could be linked to expanding market opportunities in other countries due to the growing global demand for organic and sustainable agriculture practices.
Key Highlights of the Report:
- Finland Agronomic Amino Acids Market Outlook
- Market Size of Finland Agronomic Amino Acids Market, 2025
- Forecast of Finland Agronomic Amino Acids Market, 2032
- Historical Data and Forecast of Finland Agronomic Amino Acids Revenues & Volume for the Period 2022 - 2032
- Finland Agronomic Amino Acids Market Trend Evolution
- Finland Agronomic Amino Acids Market Drivers and Challenges
- Finland Agronomic Amino Acids Price Trends
- Finland Agronomic Amino Acids Porter's Five Forces
- Finland Agronomic Amino Acids Industry Life Cycle
- Historical Data and Forecast of Finland Agronomic Amino Acids Market Revenues & Volume By Type for the Period 2022 - 2032
- Historical Data and Forecast of Finland Agronomic Amino Acids Market Revenues & Volume By Lysine for the Period 2022 - 2032
- Historical Data and Forecast of Finland Agronomic Amino Acids Market Revenues & Volume By Thymine for the Period 2022 - 2032
- Historical Data and Forecast of Finland Agronomic Amino Acids Market Revenues & Volume By Methionine for the Period 2022 - 2032
- Historical Data and Forecast of Finland Agronomic Amino Acids Market Revenues & Volume By Glutamic Acid for the Period 2022 - 2032
- Historical Data and Forecast of Finland Agronomic Amino Acids Market Revenues & Volume By Alanine for the Period 2022 - 2032
- Historical Data and Forecast of Finland Agronomic Amino Acids Market Revenues & Volume By Leucine for the Period 2022 - 2032
- Historical Data and Forecast of Finland Agronomic Amino Acids Market Revenues & Volume By Arginine for the Period 2022 - 2032
- Historical Data and Forecast of Finland Lysine Agronomic Amino Acids Market Revenues & Volume By Others for the Period 2022 - 2032
- Historical Data and Forecast of Finland Agronomic Amino Acids Market Revenues & Volume By Source for the Period 2022 - 2032
- Historical Data and Forecast of Finland Agronomic Amino Acids Market Revenues & Volume By Plant-based for the Period 2022 - 2032
- Historical Data and Forecast of Finland Agronomic Amino Acids Market Revenues & Volume By Animal-based for the Period 2022 - 2032
- Historical Data and Forecast of Finland Agronomic Amino Acids Market Revenues & Volume By Synthetic for the Period 2022 - 2032
- Historical Data and Forecast of Finland Agronomic Amino Acids Market Revenues & Volume By Treatment Method for the Period 2022 - 2032
- Historical Data and Forecast of Finland Agronomic Amino Acids Market Revenues & Volume By Foliar for the Period 2022 - 2032
- Historical Data and Forecast of Finland Agronomic Amino Acids Market Revenues & Volume By Seed for the Period 2022 - 2032
- Historical Data and Forecast of Finland Agronomic Amino Acids Market Revenues & Volume By Soil for the Period 2022 - 2032
- Historical Data and Forecast of Finland Agronomic Amino Acids Market Revenues & Volume By Others for the Period 2022 - 2032
- Historical Data and Forecast of Finland Agronomic Amino Acids Market Revenues & Volume By Application for the Period 2022 - 2032
- Historical Data and Forecast of Finland Agronomic Amino Acids Market Revenues & Volume By Soil Amendment for the Period 2022 - 2032
- Historical Data and Forecast of Finland Agronomic Amino Acids Market Revenues & Volume By Chlorophyll Synthesis for the Period 2022 - 2032
- Historical Data and Forecast of Finland Agronomic Amino Acids Market Revenues & Volume By Roots Development for the Period 2022 - 2032
- Historical Data and Forecast of Finland Agronomic Amino Acids Market Revenues & Volume By Bud Growth and Leaves Development for the Period 2022 - 2032
- Historical Data and Forecast of Finland Agronomic Amino Acids Market Revenues & Volume By Crop Resistance for the Period 2022 - 2032
- Historical Data and Forecast of Finland Agronomic Amino Acids Market Revenues & Volume By Ripening for the Period 2022 - 2032
- Historical Data and Forecast of Finland Agronomic Amino Acids Market Revenues & Volume By Others for the Period 2022 - 2032
- Finland Agronomic Amino Acids Import Export Trade Statistics
- Market Opportunity Assessment By Type
- Market Opportunity Assessment By Source
- Market Opportunity Assessment By Application
- Finland Agronomic Amino Acids Top Companies Market Share
- Finland Agronomic Amino Acids Competitive Benchmarking By Technical and Operational Parameters
- Finland Agronomic Amino Acids Company Profiles
- Finland Agronomic Amino Acids Key Strategic Recommendations
Frequently Asked Questions About the Market Study (FAQs):
6Wresearch actively monitors the Finland Agronomic Amino Acids Market and publishes its comprehensive annual report, highlighting emerging trends, growth drivers, revenue analysis, and forecast outlook. Our insights help businesses to make data-backed strategic decisions with ongoing market dynamics. Our analysts track relevent industries related to the Finland Agronomic Amino Acids Market, allowing our clients with actionable intelligence and reliable forecasts tailored to emerging regional needs.
Yes, we provide customisation as per your requirements. To learn more, feel free to contact us on sales@6wresearch.com
1 Executive Summary |
2 Introduction |
2.1 Key Highlights of the Report |
2.2 Report Description |
2.3 Market Scope & Segmentation |
2.4 Research Methodology |
2.5 Assumptions |
3 Finland Agronomic Amino Acids Market Overview |
3.1 Finland Country Macro Economic Indicators |
3.2 Finland Agronomic Amino Acids Market Revenues & Volume, 2022 & 2032F |
3.3 Finland Agronomic Amino Acids Market - Industry Life Cycle |
3.4 Finland Agronomic Amino Acids Market - Porter's Five Forces |
3.5 Finland Agronomic Amino Acids Market Revenues & Volume Share, By Type, 2022 & 2032F |
3.6 Finland Agronomic Amino Acids Market Revenues & Volume Share, By Source, 2022 & 2032F |
3.7 Finland Agronomic Amino Acids Market Revenues & Volume Share, By Application, 2022 & 2032F |
4 Finland Agronomic Amino Acids Market Dynamics |
4.1 Impact Analysis |
4.2 Market Drivers |
4.2.1 Increasing demand for organic and sustainable agricultural practices in Finland |
4.2.2 Growing awareness about the benefits of using amino acids in crop production |
4.2.3 Government initiatives promoting the use of environmentally friendly agricultural inputs |
4.3 Market Restraints |
4.3.1 High production costs associated with manufacturing agronomic amino acids |
4.3.2 Limited availability of raw materials for amino acid production in Finland |
4.3.3 Stringent regulations and approvals required for the sale and use of agronomic amino acids |
5 Finland Agronomic Amino Acids Market Trends |
6 Finland Agronomic Amino Acids Market, By Types |
6.1 Finland Agronomic Amino Acids Market, By Type |
6.1.1 Overview and Analysis |
6.1.2 Finland Agronomic Amino Acids Market Revenues & Volume, By Type, 2022 - 2032F |
6.1.3 Finland Agronomic Amino Acids Market Revenues & Volume, By Lysine, 2022 - 2032F |
6.1.4 Finland Agronomic Amino Acids Market Revenues & Volume, By Thymine, 2022 - 2032F |
6.1.5 Finland Agronomic Amino Acids Market Revenues & Volume, By Methionine, 2022 - 2032F |
6.1.6 Finland Agronomic Amino Acids Market Revenues & Volume, By Glutamic Acid, 2022 - 2032F |
6.1.7 Finland Agronomic Amino Acids Market Revenues & Volume, By Alanine, 2022 - 2032F |
6.1.8 Finland Agronomic Amino Acids Market Revenues & Volume, By Leucine, 2022 - 2032F |
6.1.9 Finland Agronomic Amino Acids Market Revenues & Volume, By Others, 2022 - 2032F |
6.1.10 Finland Agronomic Amino Acids Market Revenues & Volume, By Others, 2022 - 2032F |
6.2 Finland Agronomic Amino Acids Market, By Source |
6.2.1 Overview and Analysis |
6.2.2 Finland Agronomic Amino Acids Market Revenues & Volume, By Plant-based, 2022 - 2032F |
6.2.3 Finland Agronomic Amino Acids Market Revenues & Volume, By Animal-based, 2022 - 2032F |
6.2.4 Finland Agronomic Amino Acids Market Revenues & Volume, By Synthetic, 2022 - 2032F |
6.2.5 Finland Agronomic Amino Acids Market Revenues & Volume, By Treatment Method, 2022 - 2032F |
6.2.6 Finland Agronomic Amino Acids Market Revenues & Volume, By Foliar, 2022 - 2032F |
6.2.7 Finland Agronomic Amino Acids Market Revenues & Volume, By Seed, 2022 - 2032F |
6.2.8 Finland Agronomic Amino Acids Market Revenues & Volume, By Others, 2022 - 2032F |
6.2.9 Finland Agronomic Amino Acids Market Revenues & Volume, By Others, 2022 - 2032F |
6.3 Finland Agronomic Amino Acids Market, By Application |
6.3.1 Overview and Analysis |
6.3.2 Finland Agronomic Amino Acids Market Revenues & Volume, By Soil Amendment, 2022 - 2032F |
6.3.3 Finland Agronomic Amino Acids Market Revenues & Volume, By Chlorophyll Synthesis, 2022 - 2032F |
6.3.4 Finland Agronomic Amino Acids Market Revenues & Volume, By Roots Development, 2022 - 2032F |
6.3.5 Finland Agronomic Amino Acids Market Revenues & Volume, By Bud Growth and Leaves Development, 2022 - 2032F |
6.3.6 Finland Agronomic Amino Acids Market Revenues & Volume, By Crop Resistance, 2022 - 2032F |
6.3.7 Finland Agronomic Amino Acids Market Revenues & Volume, By Ripening, 2022 - 2032F |
7 Finland Agronomic Amino Acids Market Import-Export Trade Statistics |
7.1 Finland Agronomic Amino Acids Market Export to Major Countries |
7.2 Finland Agronomic Amino Acids Market Imports from Major Countries |
8 Finland Agronomic Amino Acids Market Key Performance Indicators |
8.1 Adoption rate of agronomic amino acids by Finnish farmers |
8.2 Number of research studies supporting the efficacy of amino acids in crop production |
8.3 Percentage increase in organic farming in Finland as a result of using amino acids |
9 Finland Agronomic Amino Acids Market - Opportunity Assessment |
9.1 Finland Agronomic Amino Acids Market Opportunity Assessment, By Type, 2022 & 2032F |
9.2 Finland Agronomic Amino Acids Market Opportunity Assessment, By Source, 2022 & 2032F |
9.3 Finland Agronomic Amino Acids Market Opportunity Assessment, By Application, 2022 & 2032F |
10 Finland Agronomic Amino Acids Market - Competitive Landscape |
10.1 Finland Agronomic Amino Acids Market Revenue Share, By Companies, 2025 |
10.2 Finland Agronomic Amino Acids Market Competitive Benchmarking, By Operating and Technical Parameters |
11 Company Profiles |
12 Recommendations |
13 Disclaimer |
Export potential assessment - trade Analytics for 2030
Export potential enables firms to identify high-growth global markets with greater confidence by combining advanced trade intelligence with a structured quantitative methodology. The framework analyzes emerging demand trends and country-level import patterns while integrating macroeconomic and trade datasets such as GDP and population forecasts, bilateral import–export flows, tariff structures, elasticity differentials between developed and developing economies, geographic distance, and import demand projections. Using weighted trade values from 2020–2024 as the base period to project country-to-country export potential for 2030, these inputs are operationalized through calculated drivers such as gravity model parameters, tariff impact factors, and projected GDP per-capita growth. Through an analysis of hidden potentials, demand hotspots, and market conditions that are most favorable to success, this method enables firms to focus on target countries, maximize returns, and global expansion with data, backed by accuracy.
By factoring in the projected importer demand gap that is currently unmet and could be potential opportunity, it identifies the potential for the Exporter (Country) among 190 countries, against the general trade analysis, which identifies the biggest importer or exporter.
To discover high-growth global markets and optimize your business strategy:
Click Here
Pricing
- Single User License$ 1,995
- Department License$ 2,400
- Site License$ 3,120
- Global License$ 3,795

Search
Thought Leadership and Analyst Meet


Our Clients
Latest Reports
- India Ultrasonic Smart Water Meter Market (2026-2032) | Outlook, Competition, Drivers, Trends, Demand, Competitive, Strategic Insights, Companies, Challenges, Strategy, Consumer Insights, Analysis, Opportunities, Growth, Size, Share, Industry, Revenue, Segments, Value, Segmentation, Supply, Forecast, Restraints,
- India Electromagnetic Bulk Flow Meter Market (2026-2032) | Analysis, Challenges, Strategic Insights, Supply, Forecast, Growth, Share, Consumer Insights, Competitive, Value, Outlook, Size & Demand,
- India Battery Powered Bulk Flow Meter Market (2026-2032) | Outlook, Analysis, Competitive Landscape, Growth, Size, Trends, Value, Revenue, Companies, Segmentation, Share & Forecast
- Bosnia and Herzegovina Fuel-Efficient Winglets Market (2026-2032) | Growth, Competition, Strategy, Restraints, Trends, Challenges, segmentation, Value, Outlook, Investment Opportunities, Analysis, Revenue, Companies, Insights, Pricing, Size, Drivers, Demand, Share, Forecast
- Canada Cloud CFD Market (2026-2032) | Size & Revenue, Industry, Growth, Competitive Landscape, Forecast, Segmentation, Value, Outlook, Trends, Share, Analysis, Companies
- Taiwan Food Delivery Platform Market (2026-2032) | Companies, Outlook, Analysis, Trends, Value, Revenue, Segmentation, Share, Forecast, Competitive Landscape, Growth, Size & Forecast
- United Kingdom (UK) Long-term Care Insurance Market (2026-2032) | Growth, Share, Consumer Insights, Drivers, Opportunities, Competition, Pricing Analysis, Segments, Restraints, Companies, Competitive, Value, Outlook, Size, Demand, Analysis, Challenges, Strategic Insights, Investment Trends, Revenue, Trends, Supply, Forecast
- United Kingdom (UK) Long Term Care Market (2026-2032) | Companies, Outlook, Analysis, Trends, Value, Revenue, Segmentation, Share, Forecast, Competitive Landscape, Growth, Size & Forecast
- Iraq Insulation and Waterproofing Market (2026-2032) | Outlook, Drivers, Growth, Size, Share, Industry, Revenue, Trends, Demand, Competitive, Strategic Insights, Opportunities, Segments, Companies, Challenges, Strategy, Consumer Insights, Analysis, Investment Trends, Value, Segmentation, Forecast, Restraints
- India Switchgear Market Outlook (2026-2032) | Size, Share, Trends, Growth, Revenue, Forecast, Analysis, Value, Outlook
Industry Events and Analyst Meet

HIMTEX 2026

India Refining Summit 2026

India EV Show 2026

EV tech India Expo 2026

Auto Tech Asia 2026
Whitepaper
- Middle East & Africa Commercial Security Market Click here to view more.
- Middle East & Africa Fire Safety Systems & Equipment Market Click here to view more.
- GCC Drone Market Click here to view more.
- Middle East Lighting Fixture Market Click here to view more.
- GCC Physical & Perimeter Security Market Click here to view more.
6WResearch In News
- Doha a strategic location for EV manufacturing hub: IPA Qatar
- Demand for luxury TVs surging in the GCC, says Samsung
- Empowering Growth: The Thriving Journey of Bangladesh’s Cable Industry
- Demand for luxury TVs surging in the GCC, says Samsung
- Video call with a traditional healer? Once unthinkable, it’s now common in South Africa
- Intelligent Buildings To Smooth GCC’s Path To Net Zero