Finland Epichlorohydrin (ECH) Market (2025-2031) | Size, Share, Revenue, Outlook, Forecast, Companies, Trends, Value, Analysis, Segmentation, Growth & Industry
Market Forecast By Applications (Epoxy Resins, Synthetic Glycerin, Water Treatment Chemicals, Pharmaceuticals), By End Use (Paints & Applications, Electrical & Electronics, Construction, Wind Turbine, Composites, Adhesives, Others) And Competitive Landscape
| Product Code: ETC5690288 | Publication Date: Nov 2023 | Updated Date: Apr 2026 | Product Type: Market Research Report | |
| Publisher: 6Wresearch | Author: Ravi Bhandari | No. of Pages: 60 | No. of Figures: 30 | No. of Tables: 5 |
Finland Epichlorohydrin (Ech) Market Size (2020-2030)
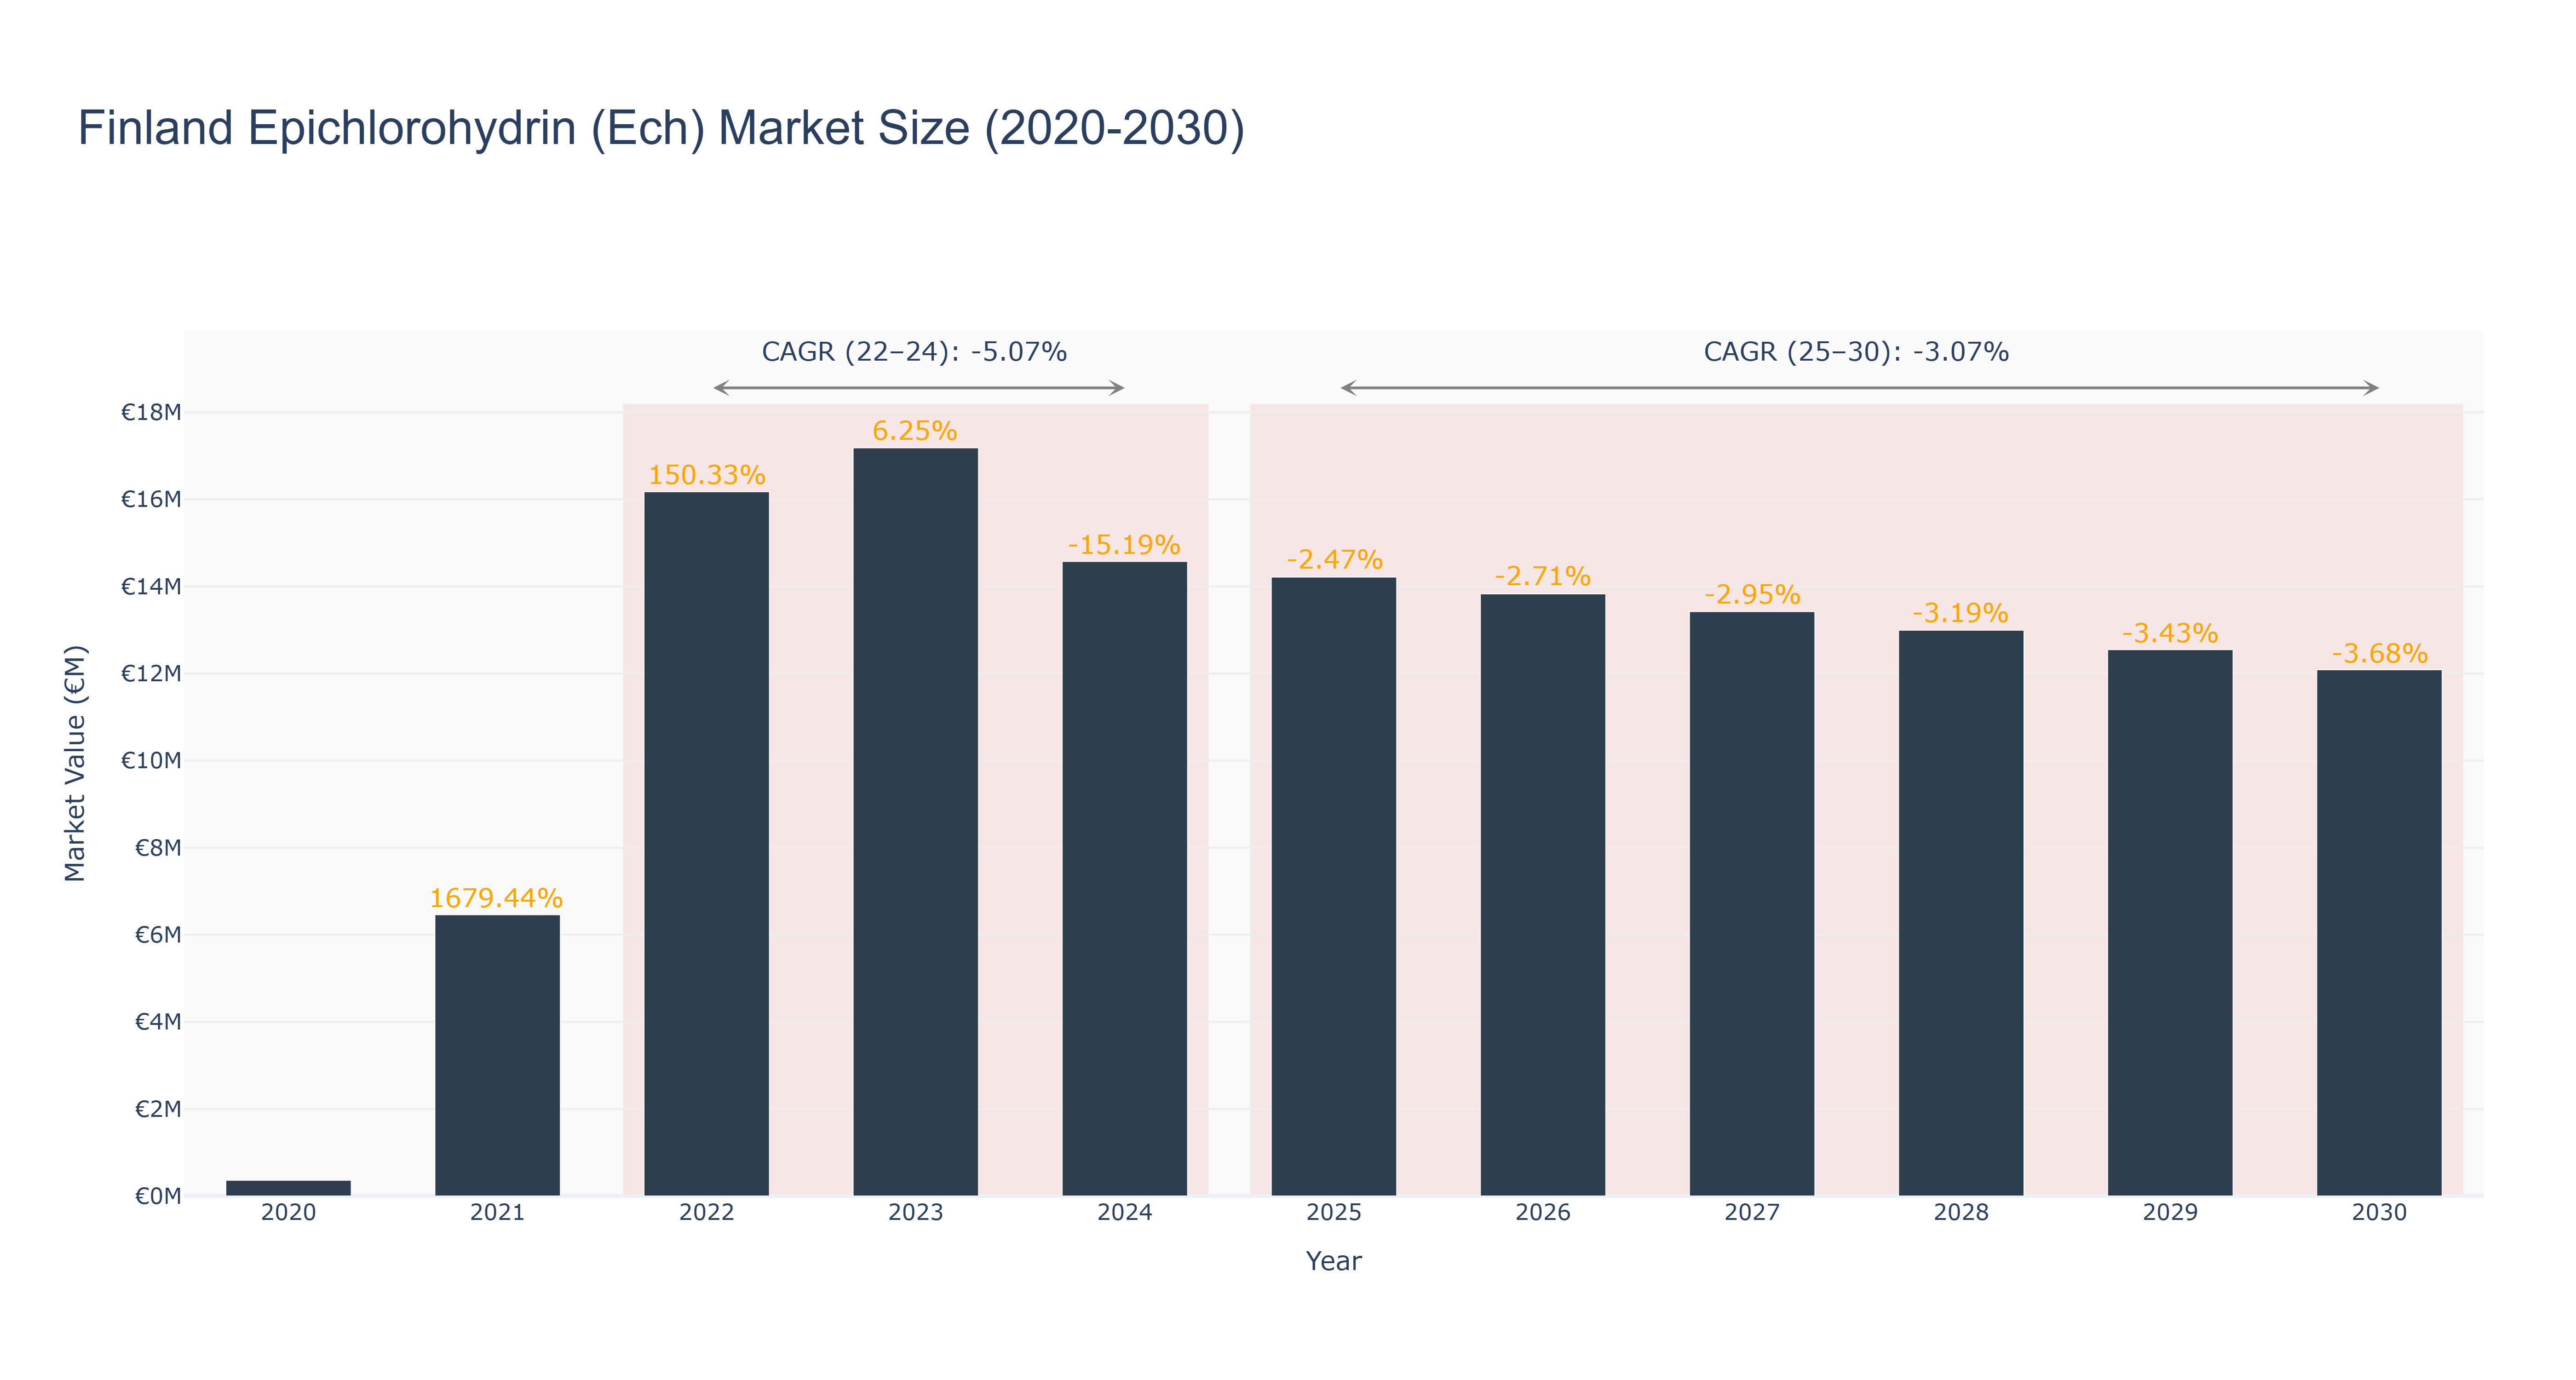
The Finland Epichlorohydrin (Ech) Market experienced a peak market size of €17.18 million in 2023. The actual market size saw fluctuations from €0.36 million in 2020 to €14.58 million in 2024. Forecasted market size is expected to decrease gradually from €14.22 million in 2025 to €12.09 million in 2030, with a CAGR of -3.07%. The market faced a decline in CAGR from 2022-2024 at -5.07%, which continued at a slower pace from 2025-2030. Industry drivers impacting this trend include fluctuating demand and supply dynamics, technological advancements, and regulatory changes. Looking ahead, Finland is set to invest in sustainable manufacturing practices and innovation initiatives to boost market competitiveness and sustainability in the Ech sector.
Finland Epichlorohydrin (Ech) Market: Production & Trade Performance (2019-2025)
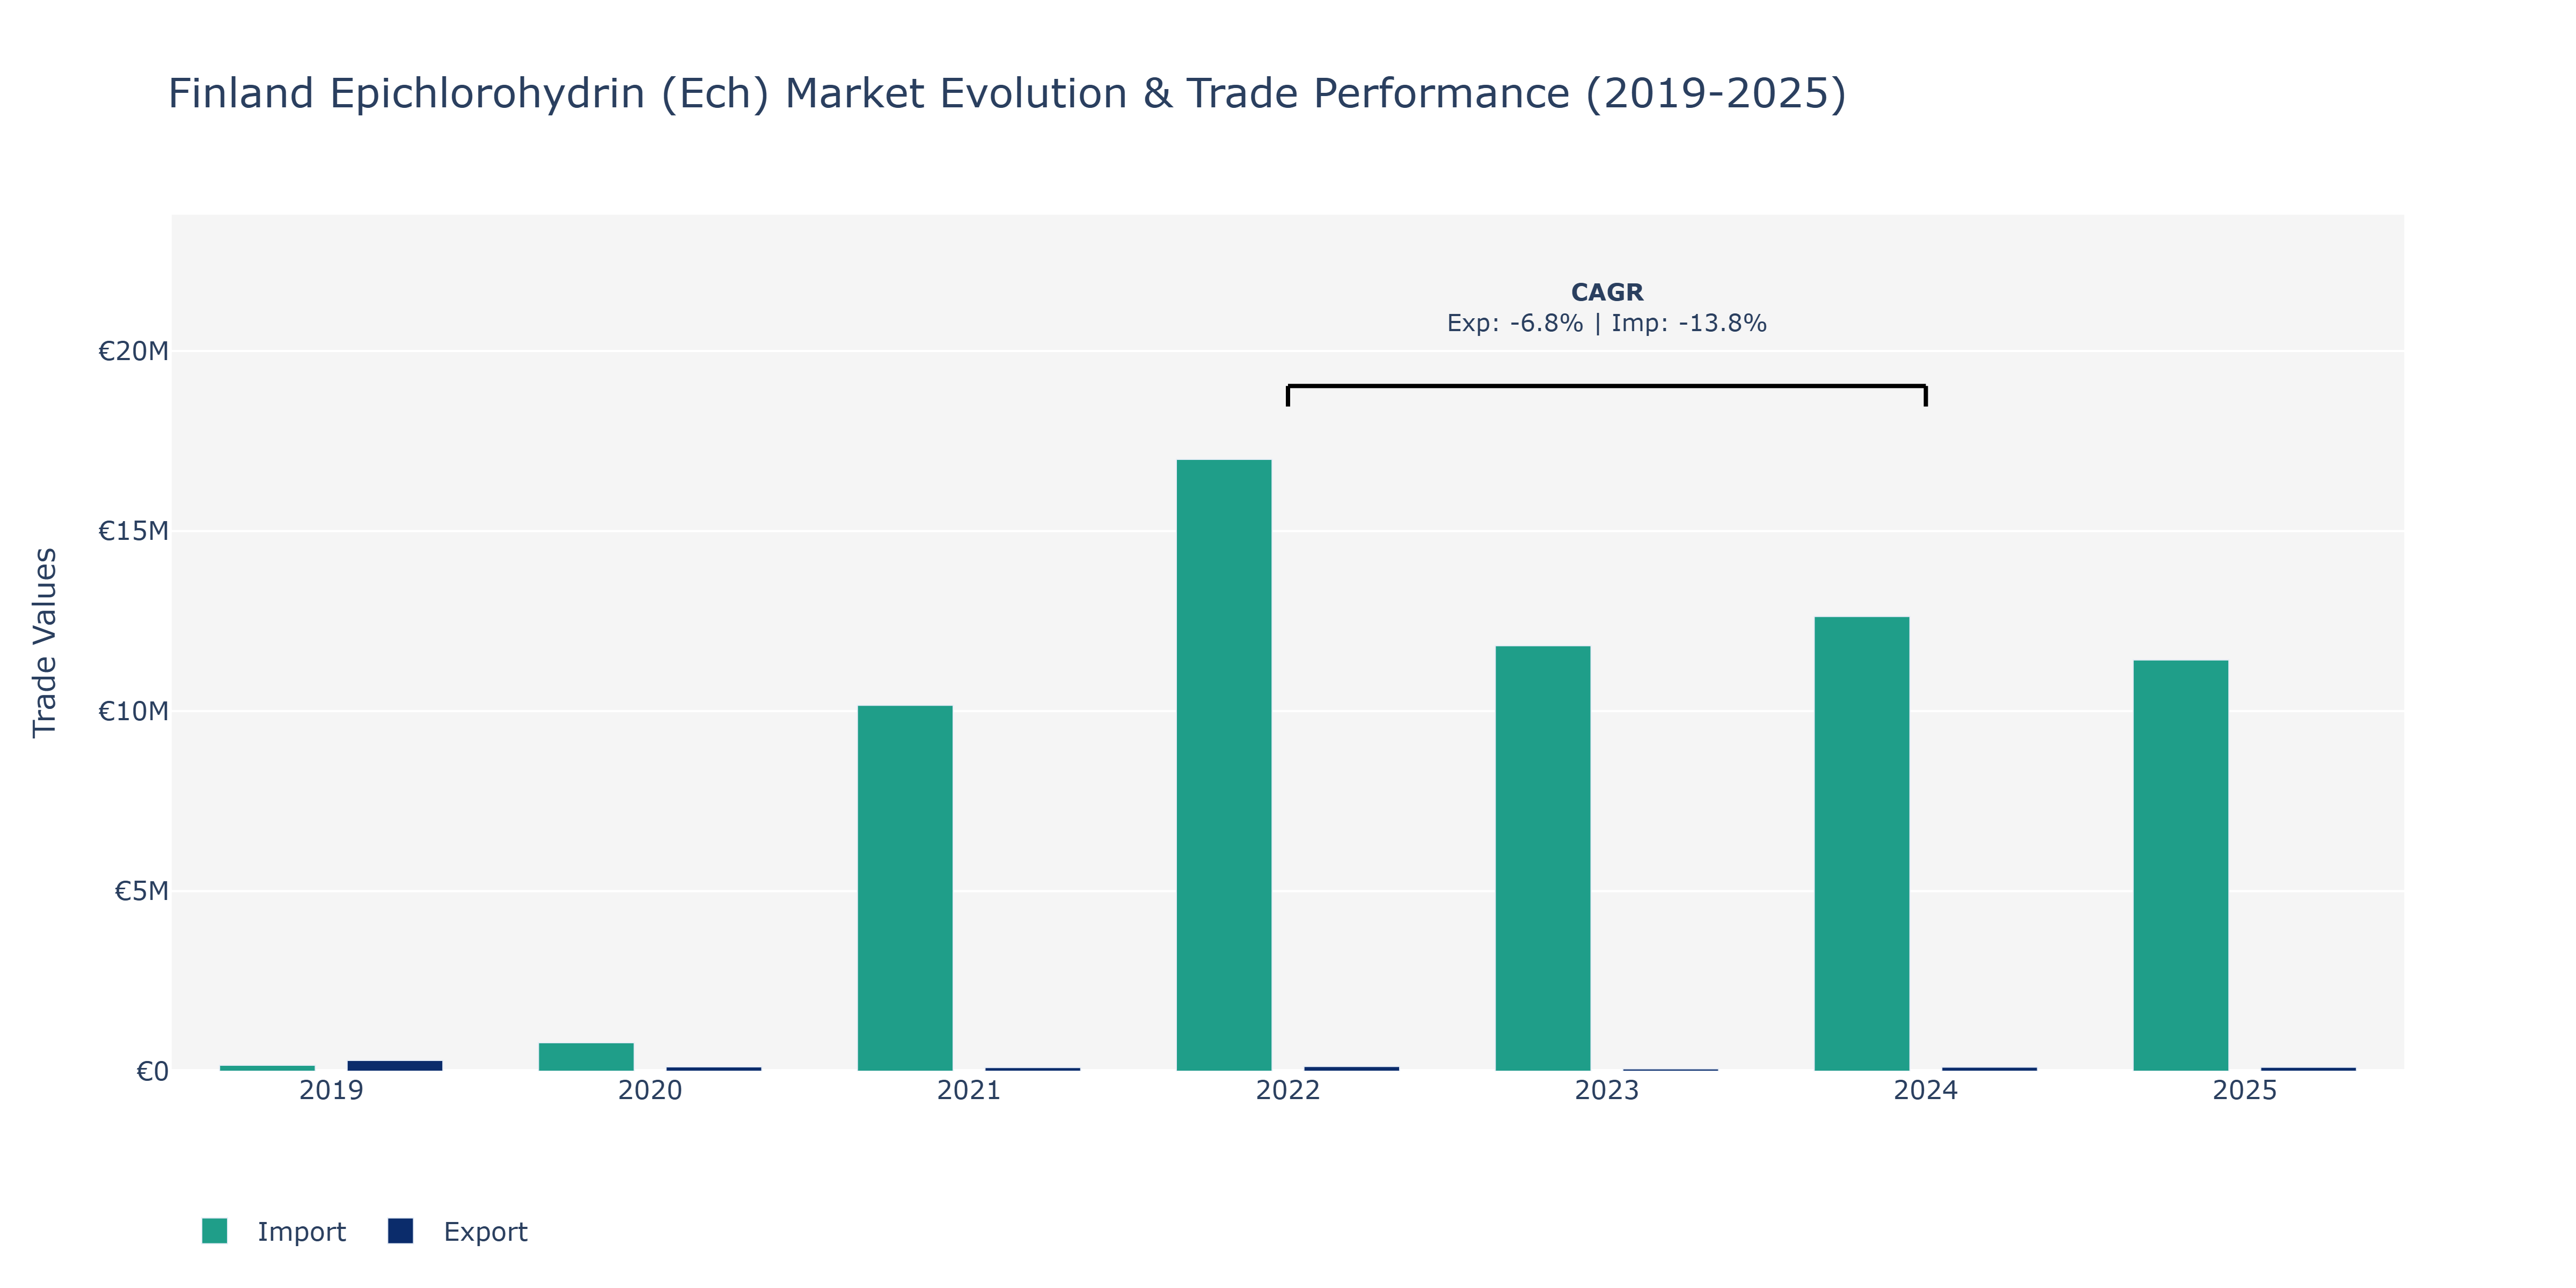
Between 2019 and 2025, Finland's Epichlorohydrin (Ech) Market witnessed various trends in exports and imports. In 2019, exports were at €300.0 thousand, showing a notable decline to €117.4 thousand in 2020, before stabilizing around €100 thousand in the following years. Conversely, imports surged from €162.38 thousand in 2019 to €16.99 million in 2022, followed by fluctuations but remaining above €11 million through 2025. The peak in imports in 2022 can be attributed to increased demand for raw materials or equipment for Ech production. On the other hand, the fluctuating export numbers may reflect global market dynamics impacting Finland's Ech production capacity or shifts in international demand. The declining trend in export CAGR from 2022 to 2024 may indicate challenges in market competitiveness or changes in trade agreements affecting outbound shipments, warranting further investigation into Finland's Ech industry strategies and global market positioning.
Key Highlights of the Report:
- Finland Epichlorohydrin (ECH) Market Outlook
- Market Size of Finland Epichlorohydrin (ECH) Market, 2024
- Forecast of Finland Epichlorohydrin (ECH) Market, 2031
- Historical Data and Forecast of Finland Epichlorohydrin (ECH) Revenues & Volume for the Period 2021-2031
- Finland Epichlorohydrin (ECH) Market Trend Evolution
- Finland Epichlorohydrin (ECH) Market Drivers and Challenges
- Finland Epichlorohydrin (ECH) Price Trends
- Finland Epichlorohydrin (ECH) Porter`s Five Forces
- Finland Epichlorohydrin (ECH) Industry Life Cycle
- Historical Data and Forecast of Finland Epichlorohydrin (ECH) Market Revenues & Volume By Applications for the Period 2021-2031
- Historical Data and Forecast of Finland Epichlorohydrin (ECH) Market Revenues & Volume By Epoxy Resins for the Period 2021-2031
- Historical Data and Forecast of Finland Epichlorohydrin (ECH) Market Revenues & Volume By Synthetic Glycerin for the Period 2021-2031
- Historical Data and Forecast of Finland Epichlorohydrin (ECH) Market Revenues & Volume By Water Treatment Chemicals for the Period 2021-2031
- Historical Data and Forecast of Finland Epichlorohydrin (ECH) Market Revenues & Volume By Pharmaceuticals for the Period 2021-2031
- Historical Data and Forecast of Finland Epichlorohydrin (ECH) Market Revenues & Volume By End Use for the Period 2021-2031
- Historical Data and Forecast of Finland Epichlorohydrin (ECH) Market Revenues & Volume By Paints & Applications for the Period 2021-2031
- Historical Data and Forecast of Finland Epichlorohydrin (ECH) Market Revenues & Volume By Electrical & Electronics for the Period 2021-2031
- Historical Data and Forecast of Finland Epichlorohydrin (ECH) Market Revenues & Volume By Construction for the Period 2021-2031
- Historical Data and Forecast of Finland Epichlorohydrin (ECH) Market Revenues & Volume By Wind Turbine for the Period 2021-2031
- Historical Data and Forecast of Finland Epichlorohydrin (ECH) Market Revenues & Volume By Composites for the Period 2021-2031
- Historical Data and Forecast of Finland Epichlorohydrin (ECH) Market Revenues & Volume By Adhesives for the Period 2021-2031
- Historical Data and Forecast of Finland Epichlorohydrin (ECH) Market Revenues & Volume By Others for the Period 2021-2031
- Finland Epichlorohydrin (ECH) Import Export Trade Statistics
- Market Opportunity Assessment By Applications
- Market Opportunity Assessment By End Use
- Finland Epichlorohydrin (ECH) Top Companies Market Share
- Finland Epichlorohydrin (ECH) Competitive Benchmarking By Technical and Operational Parameters
- Finland Epichlorohydrin (ECH) Company Profiles
- Finland Epichlorohydrin (ECH) Key Strategic Recommendations
Frequently Asked Questions About the Market Study (FAQs):
6Wresearch actively monitors the Finland Epichlorohydrin (ECH) Market and publishes its comprehensive annual report, highlighting emerging trends, growth drivers, revenue analysis, and forecast outlook. Our insights help businesses to make data-backed strategic decisions with ongoing market dynamics. Our analysts track relevent industries related to the Finland Epichlorohydrin (ECH) Market, allowing our clients with actionable intelligence and reliable forecasts tailored to emerging regional needs.
Yes, we provide customisation as per your requirements. To learn more, feel free to contact us on sales@6wresearch.com
1 Executive Summary |
2 Introduction |
2.1 Key Highlights of the Report |
2.2 Report Description |
2.3 Market Scope & Segmentation |
2.4 Research Methodology |
2.5 Assumptions |
3 Finland Epichlorohydrin (ECH) Market Overview |
3.1 Finland Country Macro Economic Indicators |
3.2 Finland Epichlorohydrin (ECH) Market Revenues & Volume, 2021 & 2031F |
3.3 Finland Epichlorohydrin (ECH) Market - Industry Life Cycle |
3.4 Finland Epichlorohydrin (ECH) Market - Porter's Five Forces |
3.5 Finland Epichlorohydrin (ECH) Market Revenues & Volume Share, By Applications, 2021 & 2031F |
3.6 Finland Epichlorohydrin (ECH) Market Revenues & Volume Share, By End Use, 2021 & 2031F |
4 Finland Epichlorohydrin (ECH) Market Dynamics |
4.1 Impact Analysis |
4.2 Market Drivers |
4.2.1 Increasing demand for epichlorohydrin (ECH) in the pharmaceutical industry for the production of various drugs and medicines. |
4.2.2 Growth in the automotive sector leading to higher demand for ECH-based products such as rubber and plastics. |
4.2.3 Rising awareness regarding environmental concerns driving the shift towards ECH as a more sustainable chemical option. |
4.3 Market Restraints |
4.3.1 Fluctuating raw material prices impacting the cost of production of ECH. |
4.3.2 Stringent regulations related to the handling and disposal of ECH posing challenges for market players. |
4.3.3 Competition from alternative chemicals affecting the market share of ECH products. |
5 Finland Epichlorohydrin (ECH) Market Trends |
6 Finland Epichlorohydrin (ECH) Market Segmentations |
6.1 Finland Epichlorohydrin (ECH) Market, By Applications |
6.1.1 Overview and Analysis |
6.1.2 Finland Epichlorohydrin (ECH) Market Revenues & Volume, By Epoxy Resins, 2021-2031F |
6.1.3 Finland Epichlorohydrin (ECH) Market Revenues & Volume, By Synthetic Glycerin, 2021-2031F |
6.1.4 Finland Epichlorohydrin (ECH) Market Revenues & Volume, By Water Treatment Chemicals, 2021-2031F |
6.1.5 Finland Epichlorohydrin (ECH) Market Revenues & Volume, By Pharmaceuticals, 2021-2031F |
6.2 Finland Epichlorohydrin (ECH) Market, By End Use |
6.2.1 Overview and Analysis |
6.2.2 Finland Epichlorohydrin (ECH) Market Revenues & Volume, By Paints & Applications, 2021-2031F |
6.2.3 Finland Epichlorohydrin (ECH) Market Revenues & Volume, By Electrical & Electronics, 2021-2031F |
6.2.4 Finland Epichlorohydrin (ECH) Market Revenues & Volume, By Construction, 2021-2031F |
6.2.5 Finland Epichlorohydrin (ECH) Market Revenues & Volume, By Wind Turbine, 2021-2031F |
6.2.6 Finland Epichlorohydrin (ECH) Market Revenues & Volume, By Composites, 2021-2031F |
6.2.7 Finland Epichlorohydrin (ECH) Market Revenues & Volume, By Adhesives, 2021-2031F |
7 Finland Epichlorohydrin (ECH) Market Import-Export Trade Statistics |
7.1 Finland Epichlorohydrin (ECH) Market Export to Major Countries |
7.2 Finland Epichlorohydrin (ECH) Market Imports from Major Countries |
8 Finland Epichlorohydrin (ECH) Market Key Performance Indicators |
8.1 Environmental impact assessment metrics to measure the sustainability of ECH production processes. |
8.2 Innovation rate in ECH product development to gauge market responsiveness to changing demands. |
8.3 Adoption rate of ECH-based products in key industries like pharmaceuticals and automotive to track market penetration. |
9 Finland Epichlorohydrin (ECH) Market - Opportunity Assessment |
9.1 Finland Epichlorohydrin (ECH) Market Opportunity Assessment, By Applications, 2021 & 2031F |
9.2 Finland Epichlorohydrin (ECH) Market Opportunity Assessment, By End Use, 2021 & 2031F |
10 Finland Epichlorohydrin (ECH) Market - Competitive Landscape |
10.1 Finland Epichlorohydrin (ECH) Market Revenue Share, By Companies, 2024 |
10.2 Finland Epichlorohydrin (ECH) Market Competitive Benchmarking, By Operating and Technical Parameters |
11 Company Profiles |
12 Recommendations | 13 Disclaimer |
Global Go To Market Strategy - 2030
Export potential enables firms to identify high-growth global markets with greater confidence by combining advanced trade intelligence with a structured quantitative methodology. The framework analyzes emerging demand trends and country-level import patterns while integrating macroeconomic and trade datasets such as GDP and population forecasts, bilateral import–export flows, tariff structures, elasticity differentials between developed and developing economies, geographic distance, and import demand projections. Using weighted trade values from 2020–2024 as the base period to project country-to-country export potential for 2030, these inputs are operationalized through calculated drivers such as gravity model parameters, tariff impact factors, and projected GDP per-capita growth. Through an analysis of hidden potentials, demand hotspots, and market conditions that are most favorable to success, this method enables firms to focus on target countries, maximize returns, and global expansion with data, backed by accuracy.
By factoring in the projected importer demand gap that is currently unmet and could be potential opportunity, it identifies the potential for the Exporter (Country) among 190 countries, against the general trade analysis, which identifies the biggest importer or exporter.
To discover high-growth global markets and optimize your business strategy:
Click Here
Pricing
- Single User License$ 1,995
- Department License$ 2,400
- Site License$ 3,120
- Global License$ 3,795

Leadership Perspectives from Industry Events
Search
Thought Leadership and Analyst Meet


Our Clients
6WResearch In News
- Doha a strategic location for EV manufacturing hub: IPA Qatar
- Demand for luxury TVs surging in the GCC, says Samsung
- Empowering Growth: The Thriving Journey of Bangladesh’s Cable Industry
- Demand for luxury TVs surging in the GCC, says Samsung
- Video call with a traditional healer? Once unthinkable, it’s now common in South Africa
- Intelligent Buildings To Smooth GCC’s Path To Net Zero
Latest Reports
- New Zealand Aseptic Manufacturing Market (2026-2032)
- Netherlands Aseptic Manufacturing Market (2026-2032)
- Nauru Aseptic Manufacturing Market (2026-2032)
- Namibia Aseptic Manufacturing Market (2026-2032)
- Mozambique Aseptic Manufacturing Market (2026-2032)
- Montenegro Aseptic Manufacturing Market (2026-2032)
- Mongolia Aseptic Manufacturing Market (2026-2032)
- Monaco Aseptic Manufacturing Market (2026-2032)
- Micronesia Aseptic Manufacturing Market (2026-2032)
- Mauritius Aseptic Manufacturing Market (2026-2032)
Industry Events and Analyst Meet

HIMTEX 2026

India Refining Summit 2026

India EV Show 2026

EV tech India Expo 2026

Auto Tech Asia 2026
Whitepaper
- Middle East & Africa Commercial Security Market Click here to view more.
- Middle East & Africa Fire Safety Systems & Equipment Market Click here to view more.
- GCC Drone Market Click here to view more.
- Middle East Lighting Fixture Market Click here to view more.
- GCC Physical & Perimeter Security Market Click here to view more.