Finland Methane Sulfonic Acid Market (2026-2032) | Segmentation, Forecast, Revenue, Outlook, Share, Companies, Analysis, Trends, Growth, Industry, Value & Size
Market Forecast By Grade (Industrial grade Methane Sulfonic Acid, Pharmaceutical grade Methane Sulfonic Acid), By Product Form (Solid Methane Sulfonic Acid, Liquid Methane Sulfonic Acid), By Application: (Electroplating, Pharmaceuticals, Chemical Synthesis, Biodiesel Production, Others) And Competitive Landscape
| Product Code: ETC5354482 | Publication Date: Nov 2023 | Updated Date: Apr 2026 | Product Type: Market Research Report | |
| Publisher: 6Wresearch | Author: Ravi Bhandari | No. of Pages: 60 | No. of Figures: 30 | No. of Tables: 5 |
Finland Methane Sulfonic Acid Market Size (2020-2030)
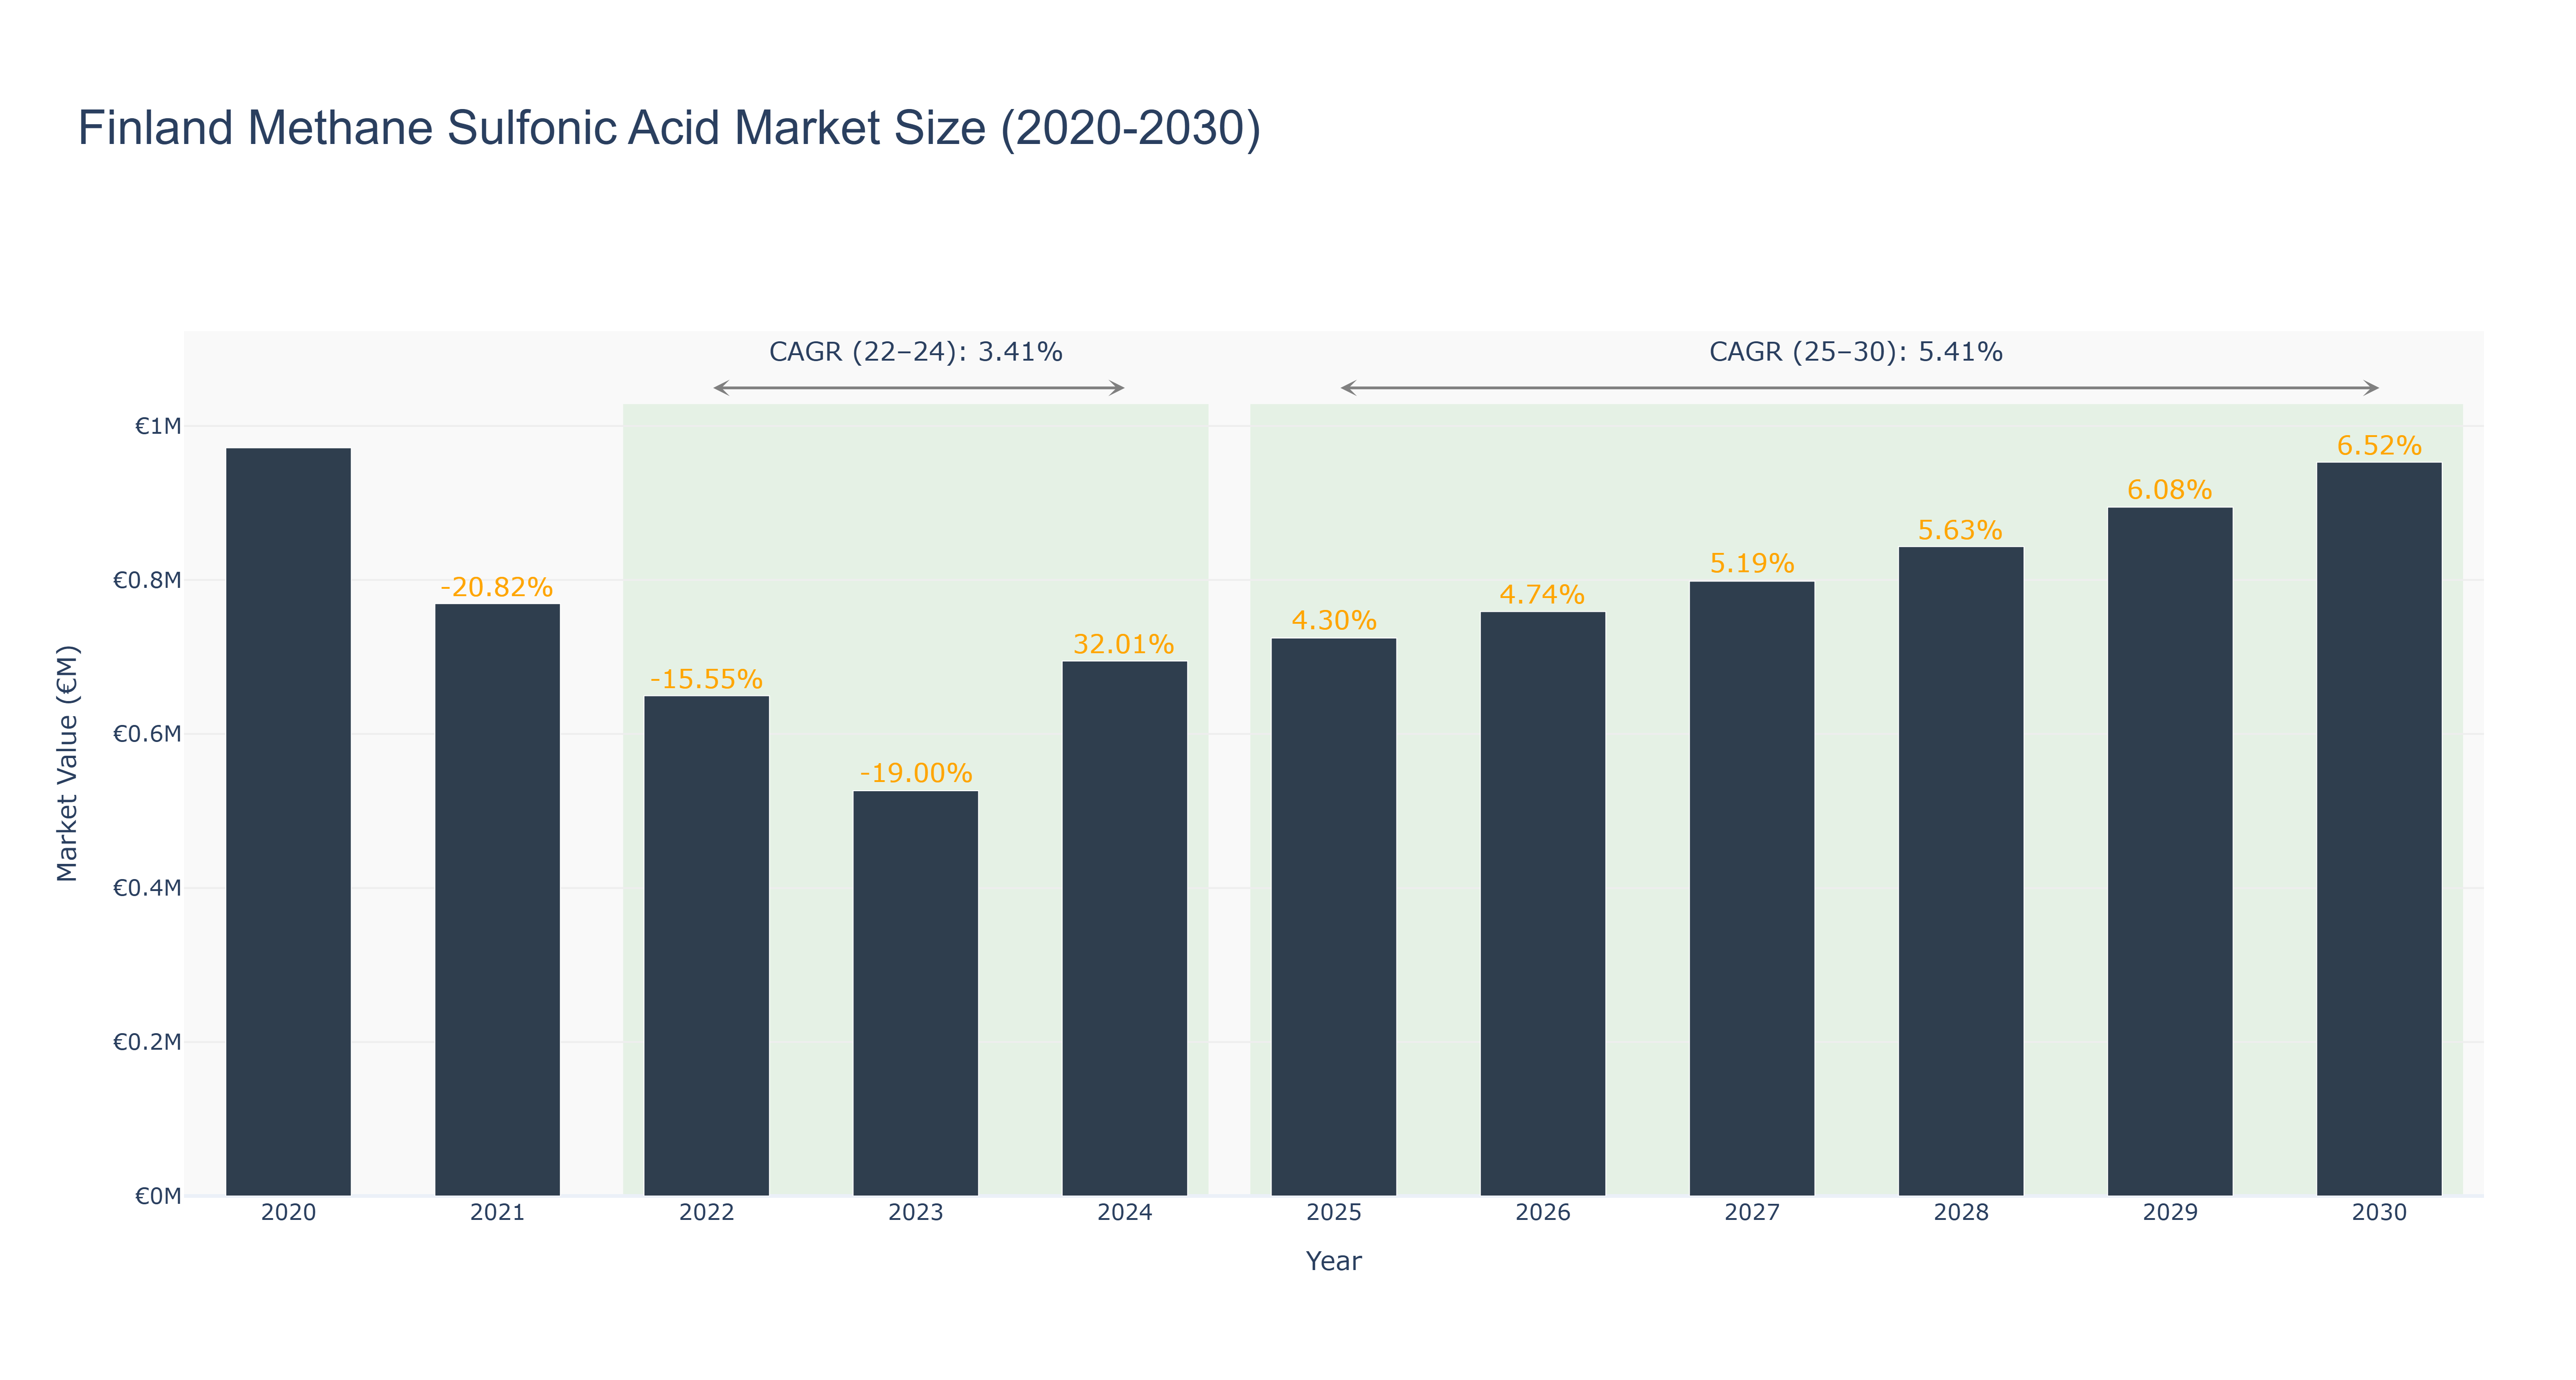
The Finland Methane Sulfonic Acid Market experienced a peak market size of €971.64 thousand in 2020, followed by a decline in subsequent years with actual values of €769.32 thousand in 2021, €649.66 thousand in 2022, and €526.23 thousand in 2023, reflecting negative growth rates of -20.82%, -15.55%, and -19.00%, respectively. However, a significant rebound is forecasted for 2024, with the market size projected to reach €694.70 thousand, driven by increasing demand in various industrial applications and a shift towards greener chemicals. The projected CAGR for the forecasted period of 2025-2030 is 5.41%, indicating a steady recovery, with market sizes expected to grow to €952.91 thousand by 2030. This growth will likely be supported by ongoing innovation and investments in sustainable production methods, as industries seek to comply with stricter environmental regulations and enhance operational efficiencies.
Finland Methane Sulfonic Acid Market: Production & Trade Performance (2019-2025)
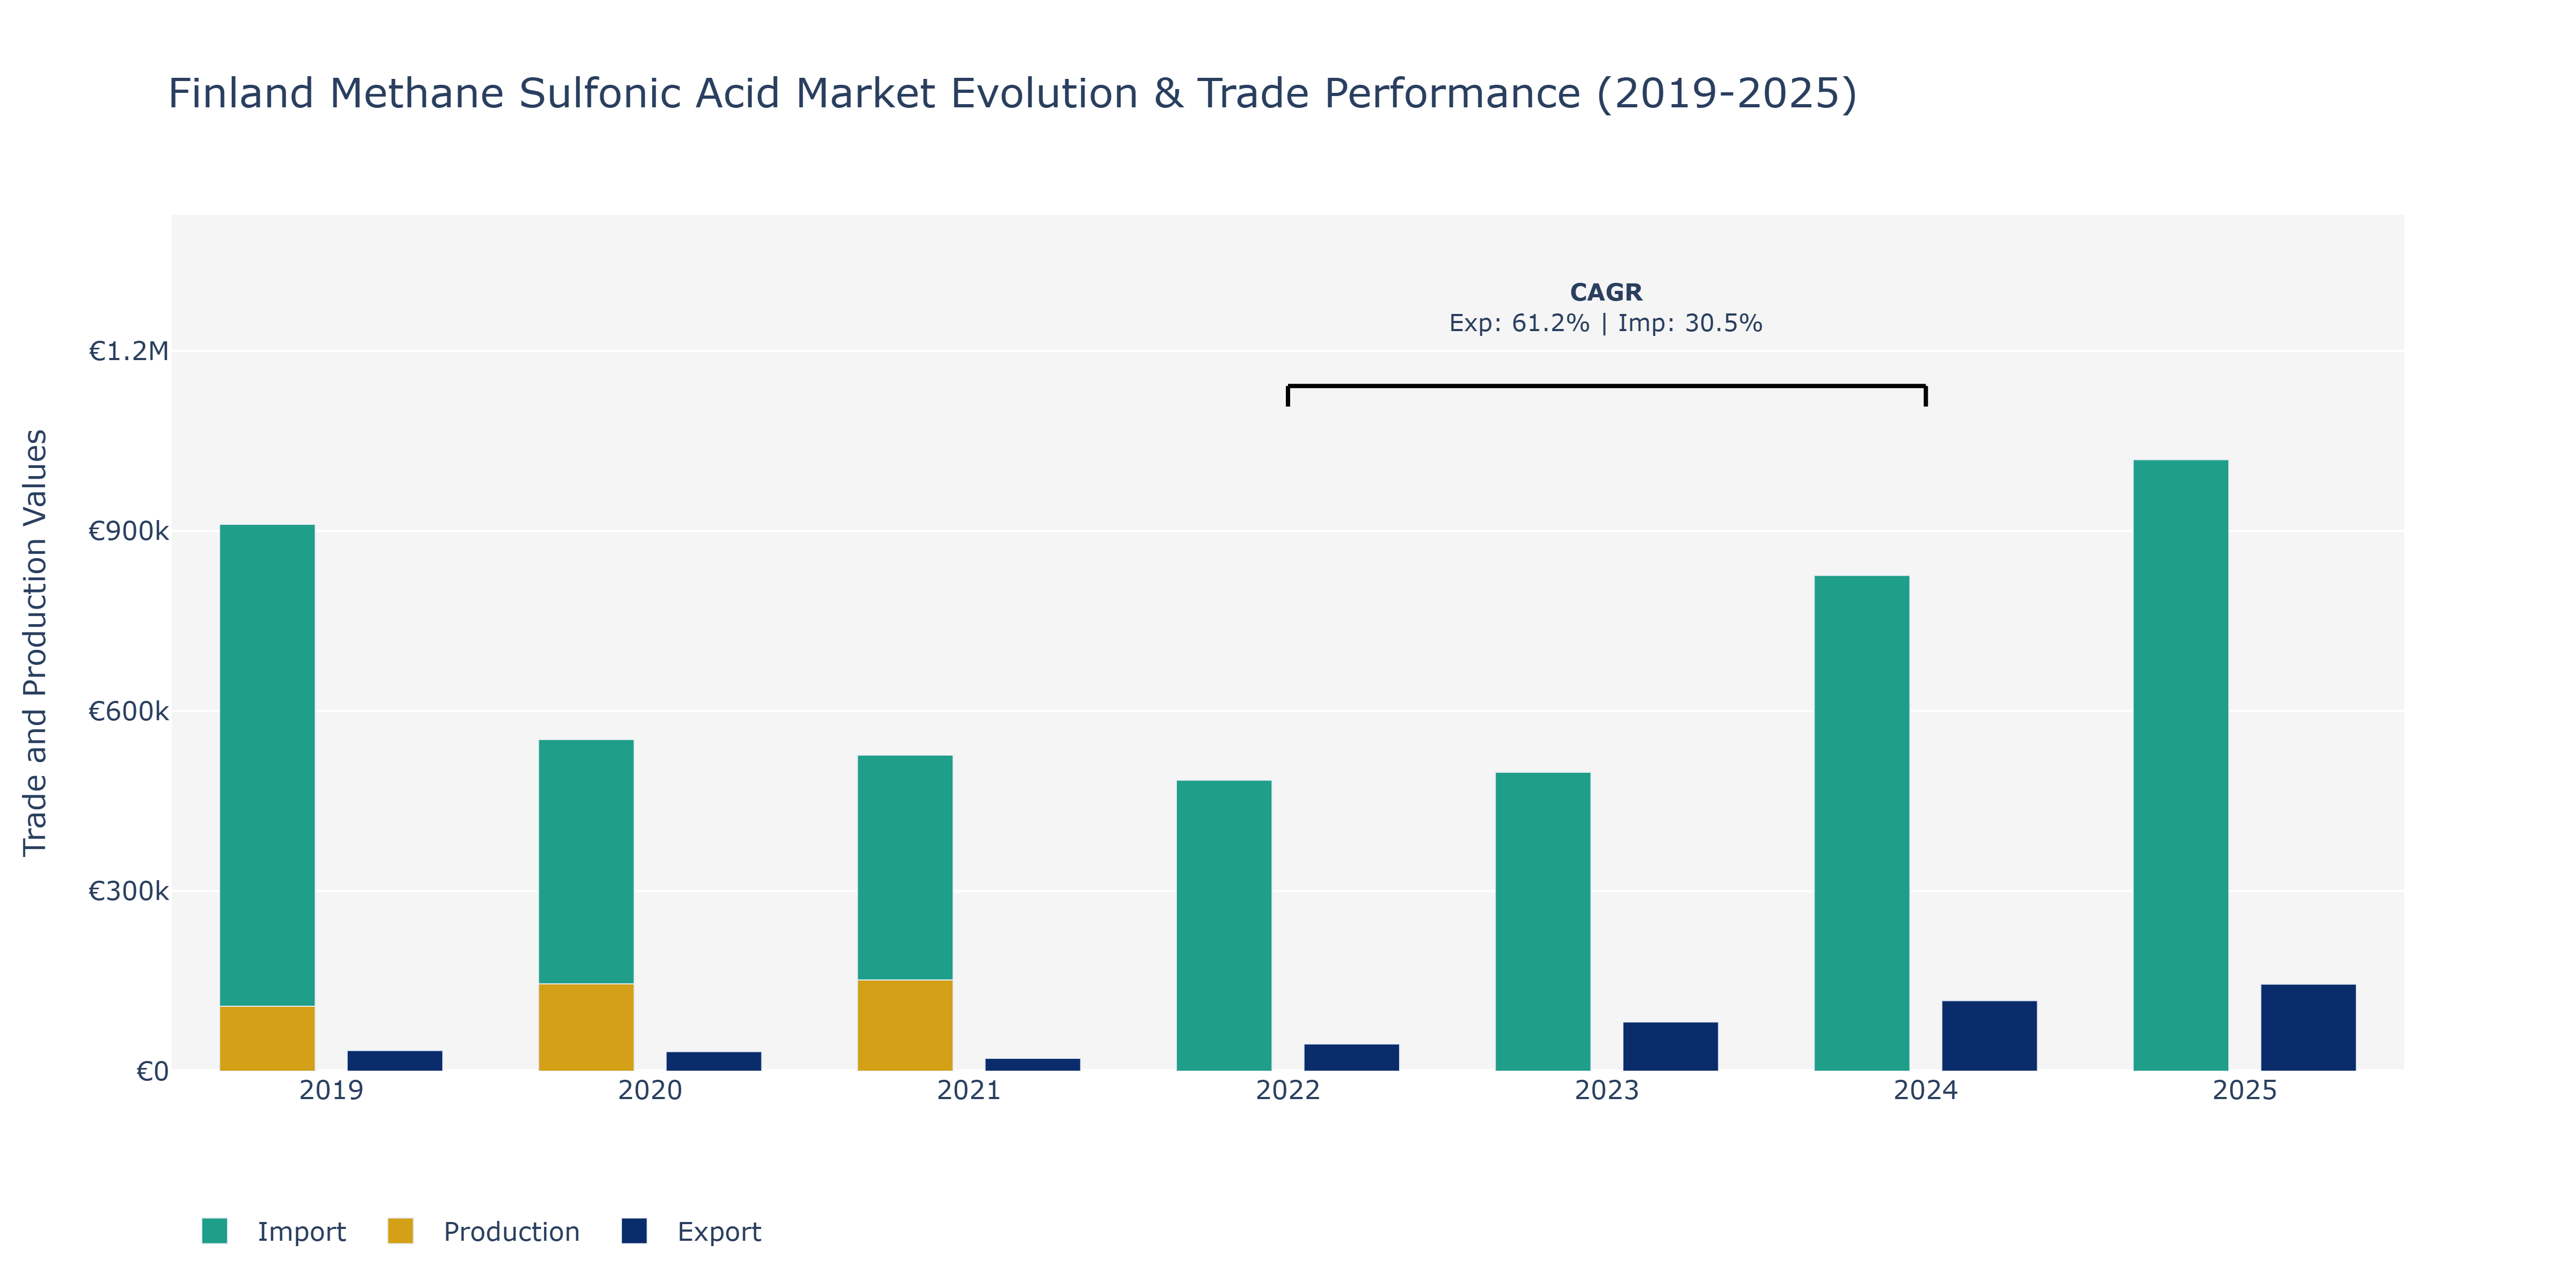
In the Finland Methane Sulfonic Acid Market, exports experienced a noticeable increase from 2019 to 2025, reaching a peak of around €145.14 thousand in 2025. This growth can be attributed to expanding global demand for this chemical compound, driven by its versatile applications in various industries such as pharmaceuticals, agriculture, and electronics. In contrast, imports showed fluctuations over the years, with a peak in 2019 at €911.1 thousand and a decrease to approximately €552.75 thousand in 2020 before gradually rising again. These import variations could be influenced by changes in international trade agreements, currency exchange rates, and domestic production capacities. Production steadily increased from €108.3 thousand in 2019 to €152 thousand in 2021, reflecting domestic efforts to enhance manufacturing capabilities and meet growing demand. As Finland aims to strengthen its position in the global specialty chemicals market, continued investments in research and innovation are expected to drive further growth in exports and production while maintaining import stability.
Key Highlights of the Report:
- Finland Methane Sulfonic Acid Market Outlook
- Market Size of Finland Methane Sulfonic Acid Market, 2025
- Forecast of Finland Methane Sulfonic Acid Market, 2032
- Historical Data and Forecast of Finland Methane Sulfonic Acid Revenues & Volume for the Period 2022 - 2032F
- Finland Methane Sulfonic Acid Market Trend Evolution
- Finland Methane Sulfonic Acid Market Drivers and Challenges
- Finland Methane Sulfonic Acid Price Trends
- Finland Methane Sulfonic Acid Porter`s Five Forces
- Finland Methane Sulfonic Acid Industry Life Cycle
- Historical Data and Forecast of Finland Methane Sulfonic Acid Market Revenues & Volume By Grade for the Period 2022 - 2032F
- Historical Data and Forecast of Finland Methane Sulfonic Acid Market Revenues & Volume By Industrial grade Methane Sulfonic Acid for the Period 2022 - 2032F
- Historical Data and Forecast of Finland Methane Sulfonic Acid Market Revenues & Volume By Pharmaceutical grade Methane Sulfonic Acid for the Period 2022 - 2032F
- Historical Data and Forecast of Finland Methane Sulfonic Acid Market Revenues & Volume By Product Form for the Period 2022 - 2032F
- Historical Data and Forecast of Finland Methane Sulfonic Acid Market Revenues & Volume By Solid Methane Sulfonic Acid for the Period 2022 - 2032F
- Historical Data and Forecast of Finland Methane Sulfonic Acid Market Revenues & Volume By Liquid Methane Sulfonic Acid for the Period 2022 - 2032F
- Historical Data and Forecast of Finland Methane Sulfonic Acid Market Revenues & Volume By Application: for the Period 2022 - 2032F
- Historical Data and Forecast of Finland Methane Sulfonic Acid Market Revenues & Volume By Electroplating for the Period 2022 - 2032F
- Historical Data and Forecast of Finland Methane Sulfonic Acid Market Revenues & Volume By Pharmaceuticals for the Period 2022 - 2032F
- Historical Data and Forecast of Finland Methane Sulfonic Acid Market Revenues & Volume By Chemical Synthesis for the Period 2022 - 2032F
- Historical Data and Forecast of Finland Methane Sulfonic Acid Market Revenues & Volume By Biodiesel Production for the Period 2022 - 2032F
- Historical Data and Forecast of Finland Methane Sulfonic Acid Market Revenues & Volume By Others for the Period 2022 - 2032F
- Finland Methane Sulfonic Acid Import Export Trade Statistics
- Market Opportunity Assessment By Grade
- Market Opportunity Assessment By Product Form
- Market Opportunity Assessment By Application:
- Finland Methane Sulfonic Acid Top Companies Market Share
- Finland Methane Sulfonic Acid Competitive Benchmarking By Technical and Operational Parameters
- Finland Methane Sulfonic Acid Company Profiles
- Finland Methane Sulfonic Acid Key Strategic Recommendations
Frequently Asked Questions About the Market Study (FAQs):
6Wresearch actively monitors the Finland Methane Sulfonic Acid Market and publishes its comprehensive annual report, highlighting emerging trends, growth drivers, revenue analysis, and forecast outlook. Our insights help businesses to make data-backed strategic decisions with ongoing market dynamics. Our analysts track relevent industries related to the Finland Methane Sulfonic Acid Market, allowing our clients with actionable intelligence and reliable forecasts tailored to emerging regional needs.
Yes, we provide customisation as per your requirements. To learn more, feel free to contact us on sales@6wresearch.com
1 Executive Summary |
2 Introduction |
2.1 Key Highlights of the Report |
2.2 Report Description |
2.3 Market Scope & Segmentation |
2.4 Research Methodology |
2.5 Assumptions |
3 Finland Methane Sulfonic Acid Market Overview |
3.1 Finland Country Macro Economic Indicators |
3.2 Finland Methane Sulfonic Acid Market Revenues & Volume, 2022 & 2032F |
3.3 Finland Methane Sulfonic Acid Market - Industry Life Cycle |
3.4 Finland Methane Sulfonic Acid Market - Porter's Five Forces |
3.5 Finland Methane Sulfonic Acid Market Revenues & Volume Share, By Grade, 2022 & 2032F |
3.6 Finland Methane Sulfonic Acid Market Revenues & Volume Share, By Product Form, 2022 & 2032F |
3.7 Finland Methane Sulfonic Acid Market Revenues & Volume Share, By Application:, 2022 & 2032F |
4 Finland Methane Sulfonic Acid Market Dynamics |
4.1 Impact Analysis |
4.2 Market Drivers |
4.2.1 Increasing demand for environmentally friendly chemicals |
4.2.2 Growing applications in pharmaceutical and agrochemical industries |
4.2.3 Technological advancements leading to improved production processes |
4.3 Market Restraints |
4.3.1 Fluctuating raw material prices |
4.3.2 Stringent regulations related to chemical manufacturing and disposal |
4.3.3 Competition from alternative chemicals with similar properties |
5 Finland Methane Sulfonic Acid Market Trends |
6 Finland Methane Sulfonic Acid Market Segmentations |
6.1 Finland Methane Sulfonic Acid Market, By Grade |
6.1.1 Overview and Analysis |
6.1.2 Finland Methane Sulfonic Acid Market Revenues & Volume, By Industrial grade Methane Sulfonic Acid, 2022 - 2032F |
6.1.3 Finland Methane Sulfonic Acid Market Revenues & Volume, By Pharmaceutical grade Methane Sulfonic Acid, 2022 - 2032F |
6.2 Finland Methane Sulfonic Acid Market, By Product Form |
6.2.1 Overview and Analysis |
6.2.2 Finland Methane Sulfonic Acid Market Revenues & Volume, By Solid Methane Sulfonic Acid, 2022 - 2032F |
6.2.3 Finland Methane Sulfonic Acid Market Revenues & Volume, By Liquid Methane Sulfonic Acid, 2022 - 2032F |
6.3 Finland Methane Sulfonic Acid Market, By Application: |
6.3.1 Overview and Analysis |
6.3.2 Finland Methane Sulfonic Acid Market Revenues & Volume, By Electroplating, 2022 - 2032F |
6.3.3 Finland Methane Sulfonic Acid Market Revenues & Volume, By Pharmaceuticals, 2022 - 2032F |
6.3.4 Finland Methane Sulfonic Acid Market Revenues & Volume, By Chemical Synthesis, 2022 - 2032F |
6.3.5 Finland Methane Sulfonic Acid Market Revenues & Volume, By Biodiesel Production, 2022 - 2032F |
6.3.6 Finland Methane Sulfonic Acid Market Revenues & Volume, By Others, 2022 - 2032F |
7 Finland Methane Sulfonic Acid Market Import-Export Trade Statistics |
7.1 Finland Methane Sulfonic Acid Market Export to Major Countries |
7.2 Finland Methane Sulfonic Acid Market Imports from Major Countries |
8 Finland Methane Sulfonic Acid Market Key Performance Indicators |
8.1 Adoption rate of methane sulfonic acid in new industries |
8.2 Research and development investment in methane sulfonic acid applications |
8.3 Environmental impact assessment of methane sulfonic acid production and usage |
9 Finland Methane Sulfonic Acid Market - Opportunity Assessment |
9.1 Finland Methane Sulfonic Acid Market Opportunity Assessment, By Grade, 2022 & 2032F |
9.2 Finland Methane Sulfonic Acid Market Opportunity Assessment, By Product Form, 2022 & 2032F |
9.3 Finland Methane Sulfonic Acid Market Opportunity Assessment, By Application:, 2022 & 2032F |
10 Finland Methane Sulfonic Acid Market - Competitive Landscape |
10.1 Finland Methane Sulfonic Acid Market Revenue Share, By Companies, 2025 |
10.2 Finland Methane Sulfonic Acid Market Competitive Benchmarking, By Operating and Technical Parameters |
11 Company Profiles |
12 Recommendations | 13 Disclaimer |
Global Go To Market Strategy - 2030
Export potential enables firms to identify high-growth global markets with greater confidence by combining advanced trade intelligence with a structured quantitative methodology. The framework analyzes emerging demand trends and country-level import patterns while integrating macroeconomic and trade datasets such as GDP and population forecasts, bilateral import–export flows, tariff structures, elasticity differentials between developed and developing economies, geographic distance, and import demand projections. Using weighted trade values from 2020–2024 as the base period to project country-to-country export potential for 2030, these inputs are operationalized through calculated drivers such as gravity model parameters, tariff impact factors, and projected GDP per-capita growth. Through an analysis of hidden potentials, demand hotspots, and market conditions that are most favorable to success, this method enables firms to focus on target countries, maximize returns, and global expansion with data, backed by accuracy.
By factoring in the projected importer demand gap that is currently unmet and could be potential opportunity, it identifies the potential for the Exporter (Country) among 190 countries, against the general trade analysis, which identifies the biggest importer or exporter.
To discover high-growth global markets and optimize your business strategy:
Click Here
Pricing
- Single User License$ 1,995
- Department License$ 2,400
- Site License$ 3,120
- Global License$ 3,795

Leadership Perspectives from Industry Events
Search
Thought Leadership and Analyst Meet


Our Clients
6WResearch In News
- India Air Conditioner Market Set for Strong Rebound in 2026 After Weather-Led Correction and GST-Driven Recovery: 6Wresearch
- ADAS in India: How Automatic Emergency Braking, Blind Spot Detection & Driver Monitoring are Transforming Road Safety
- Doha a strategic location for EV manufacturing hub: IPA Qatar
- Demand for luxury TVs surging in the GCC, says Samsung
- Empowering Growth: The Thriving Journey of Bangladesh’s Cable Industry
- Demand for luxury TVs surging in the GCC, says Samsung
Latest Reports
- Nicaragua RPG Gaming Market (2026-2032)
- New Zealand RPG Gaming Market (2026-2032)
- Netherlands RPG Gaming Market (2026-2032)
- Nauru RPG Gaming Market (2026-2032)
- Namibia RPG Gaming Market (2026-2032)
- Mozambique RPG Gaming Market (2026-2032)
- Montenegro RPG Gaming Market (2026-2032)
- Mongolia RPG Gaming Market (2026-2032)
- Monaco RPG Gaming Market (2026-2032)
- Micronesia RPG Gaming Market (2026-2032)
Industry Events and Analyst Meet

EV India Expo 2026

HIMTEX 2026

India Refining Summit 2026

India EV Show 2026

EV tech India Expo 2026
Whitepaper
- Middle East & Africa Commercial Security Market Click here to view more.
- Middle East & Africa Fire Safety Systems & Equipment Market Click here to view more.
- GCC Drone Market Click here to view more.
- Middle East Lighting Fixture Market Click here to view more.
- GCC Physical & Perimeter Security Market Click here to view more.