Finland NFC Juice Market (2026-2032) | Investment Trends, Growth, Segments, Competitive, Consumer Insights, Restraints, Value, Analysis, Competition, Demand, Opportunities, Trends, Forecast, Strategic Insights, Size, Challenges, Outlook, Drivers, Strategy, Supply, Revenue, Share, Companies, Pricing Analysis, Segmentation, Industry
Market Forecast By Product Type (Orange Juice, Apple Juice, Pineapple Juice, Mixed Fruit Juice), By Packaging Type (Bottles, Cartons, Cans, Pouches), By Distribution Channel (Supermarkets, Convenience Stores, Online Retail, Specialty Stores, Food Service) And Competitive Landscape
| Product Code: ETC12747618 | Publication Date: Apr 2025 | Updated Date: Apr 2026 | Product Type: Market Research Report | |
| Publisher: 6Wresearch | Author: Sachin Kumar Rai | No. of Pages: 65 | No. of Figures: 34 | No. of Tables: 19 |
Finland Nfc Juice Market Size (2020-2030)
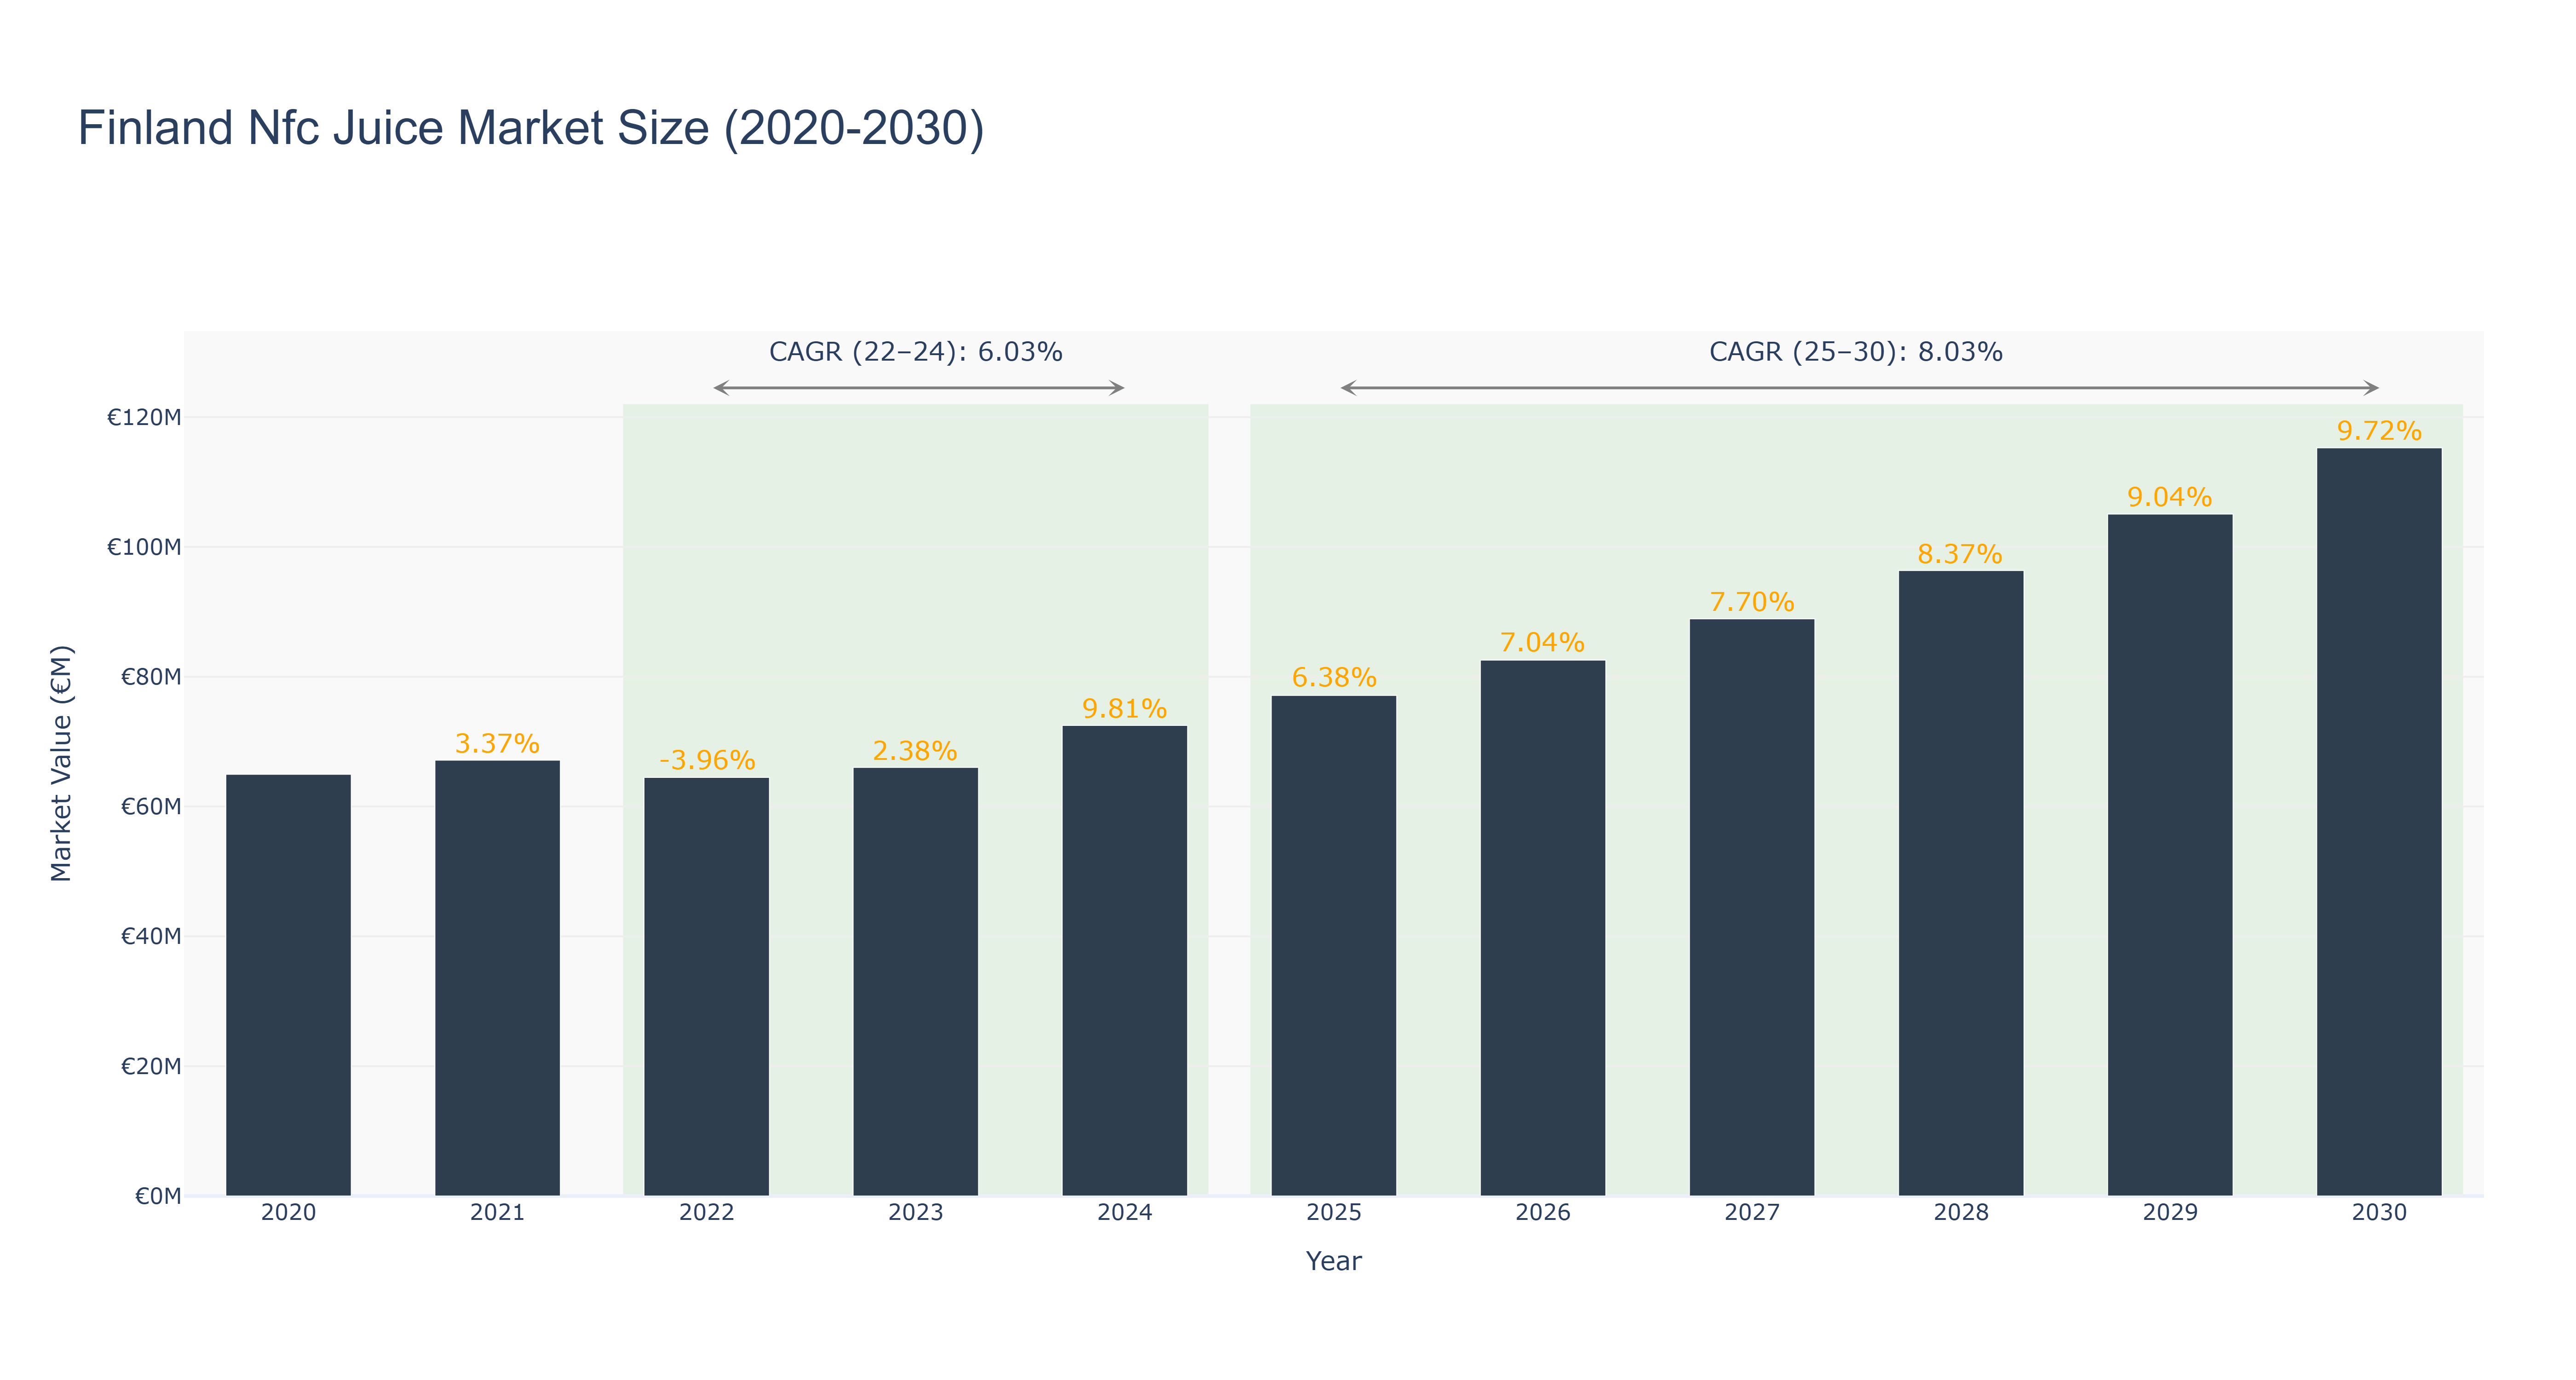
Finland's NFC Juice Market has shown a steady growth trajectory over the years. The peak market size of €115.27 million is forecasted for 2030, showcasing a consistent upward trend. Actual market sizes from 2020 to 2024 have displayed incremental growth, with a notable increase in 2024 to €72.51 million. The market is expected to continue its positive momentum, with a forecasted size of €105.06 million by 2029. The CAGR values of 6.03% (2022-24) and 8.03% (2025-30) reflect a healthy growth rate. Industry drivers such as increasing health awareness and demand for natural beverages have contributed to this market's success. Looking ahead, Finland's NFC Juice Market is set to witness further growth with upcoming initiatives focusing on sustainable packaging and innovative flavor offerings to meet evolving consumer preferences.
Finland Nfc Juice Market: Production & Trade Performance (2019-2025)
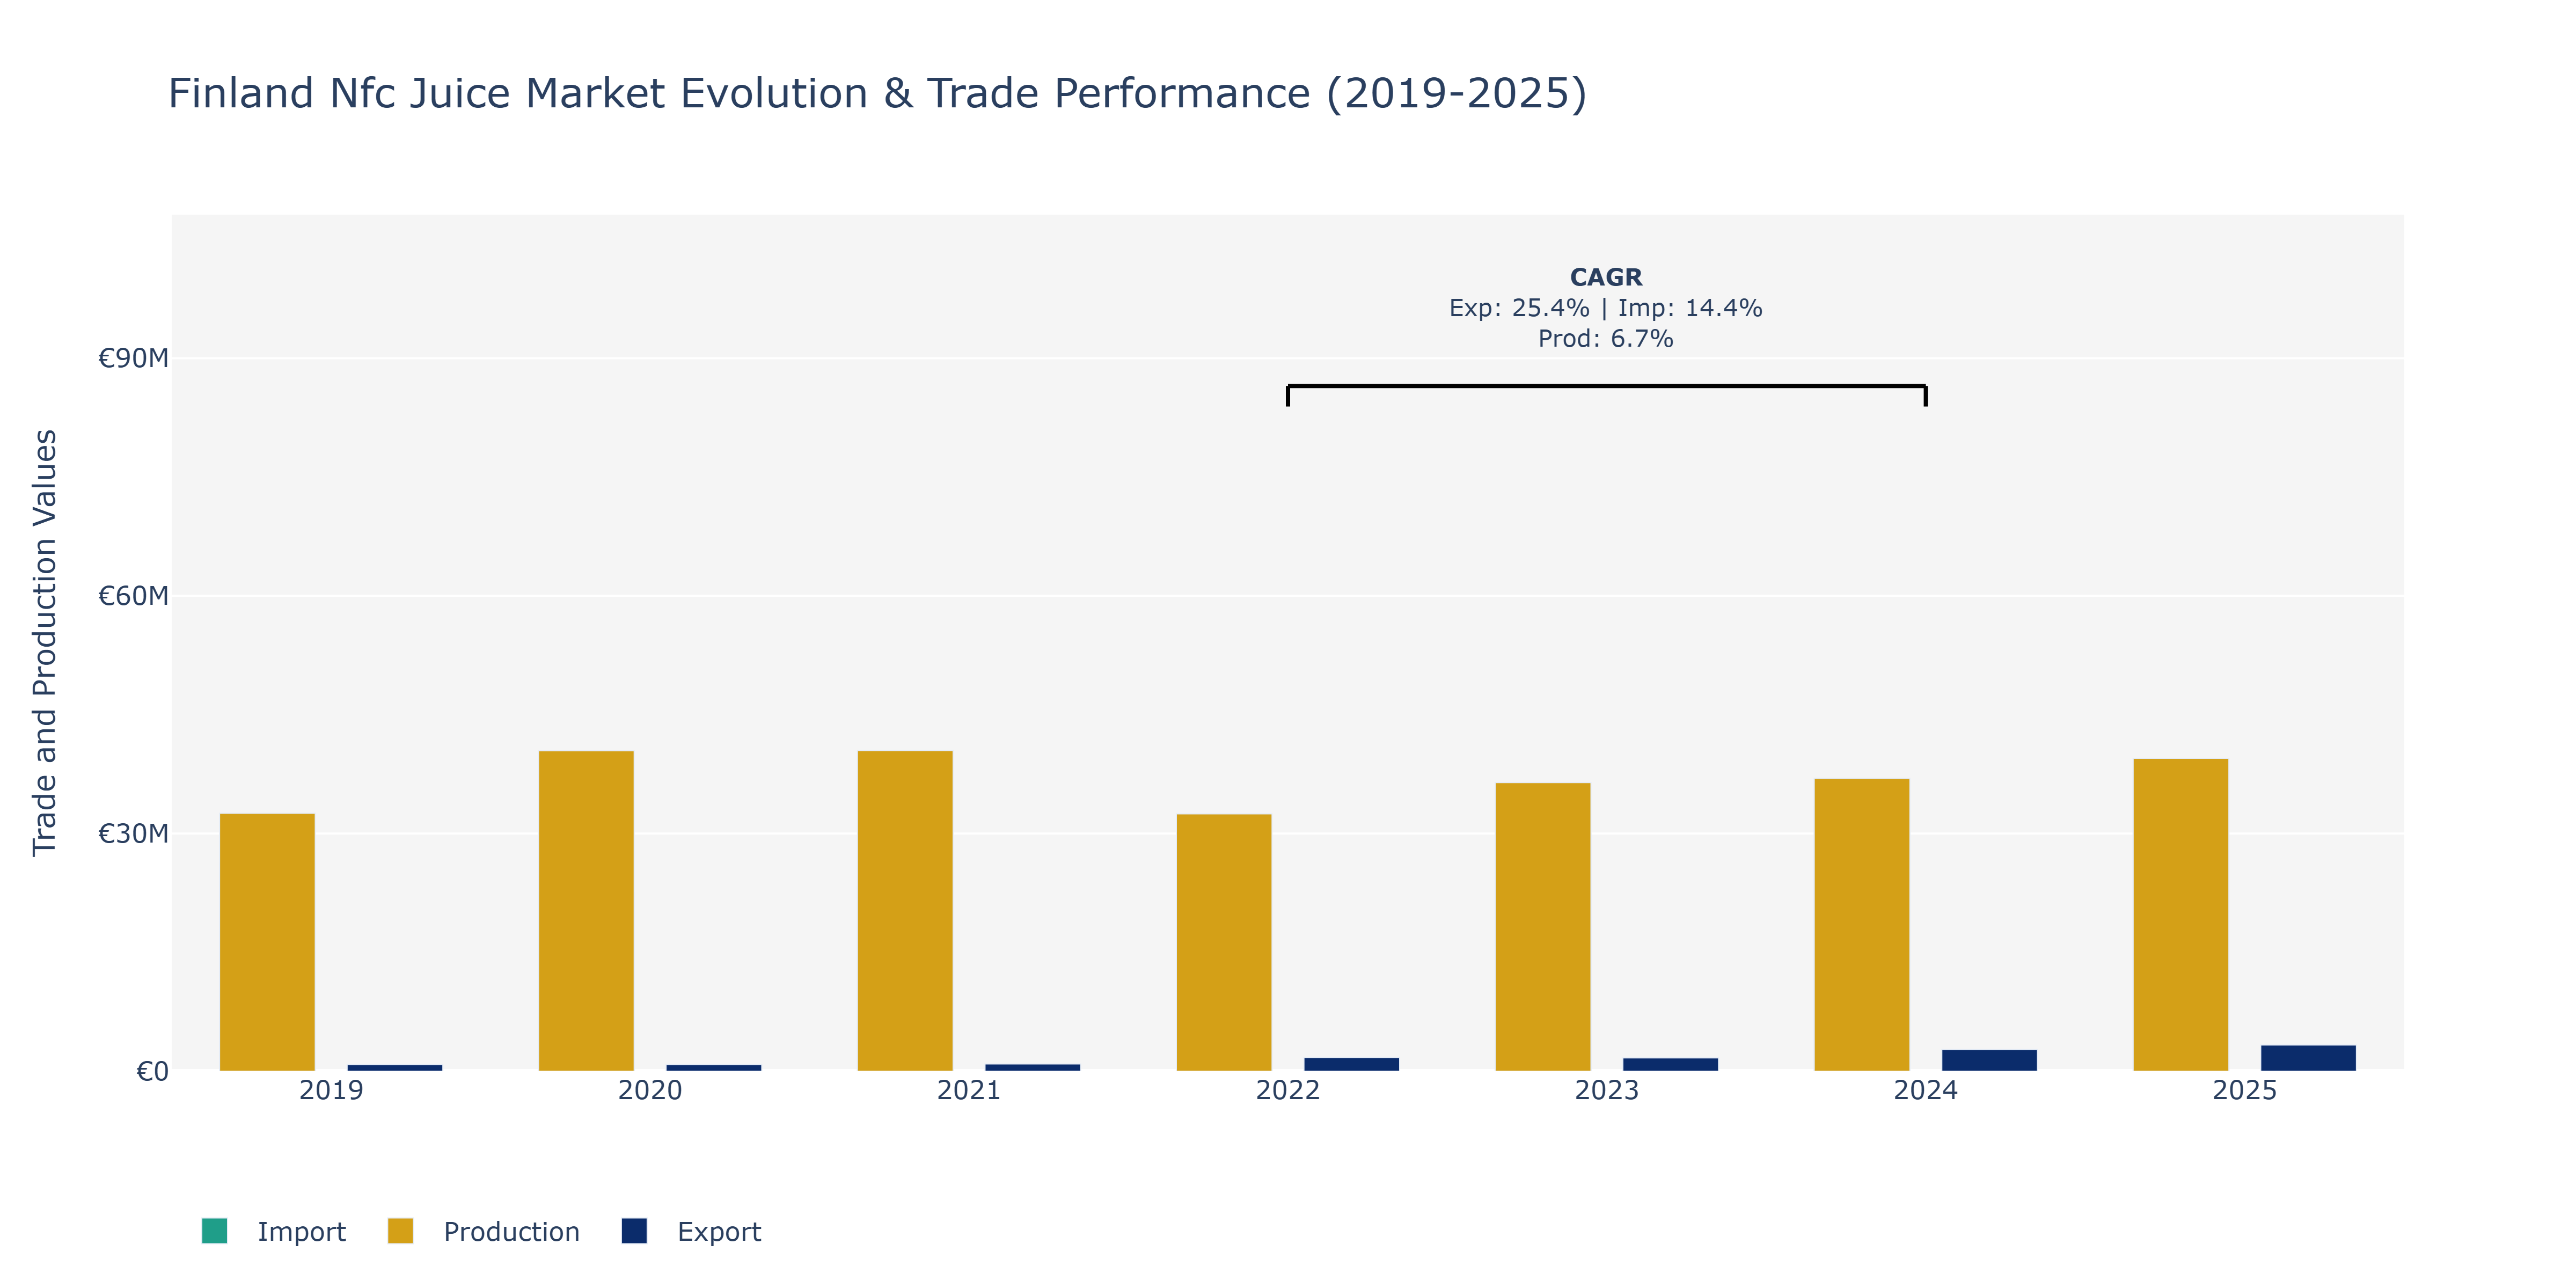
In the Finland NFC Juice Market, from 2019 to 2025, all three key metrics witnessed distinct patterns. Exports showed a consistent upward trajectory, reaching €3.3 million in 2025, reflecting a growing demand for Finnish NFC juice globally. Imports, on the other hand, started at €26.26 million in 2019, declined gradually until 2022, and then surged to €37.74 million in 2025. This spike may be attributed to increased consumption or a shift in consumer preferences towards imported varieties. Production value fluctuated, peaking at €40.5 million in 2021 before declining slightly. The market's production capacity might have been affected by factors like weather conditions impacting fruit yields or technological advancements optimizing production efficiency. These trends suggest a market adapting to changing consumer demands, possibly influenced by health trends promoting natural fruit juices over artificial alternatives.
Key Highlights of the Report:
- Finland NFC Juice Market Outlook
- Market Size of Finland NFC Juice Market, 2025
- Forecast of Finland NFC Juice Market, 2032
- Historical Data and Forecast of Finland NFC Juice Revenues & Volume for the Period 2022 - 2032F
- Finland NFC Juice Market Trend Evolution
- Finland NFC Juice Market Drivers and Challenges
- Finland NFC Juice Price Trends
- Finland NFC Juice Porter's Five Forces
- Finland NFC Juice Industry Life Cycle
- Historical Data and Forecast of Finland NFC Juice Market Revenues & Volume By Product Type for the Period 2022 - 2032F
- Historical Data and Forecast of Finland NFC Juice Market Revenues & Volume By Orange Juice for the Period 2022 - 2032F
- Historical Data and Forecast of Finland NFC Juice Market Revenues & Volume By Apple Juice for the Period 2022 - 2032F
- Historical Data and Forecast of Finland NFC Juice Market Revenues & Volume By Pineapple Juice for the Period 2022 - 2032F
- Historical Data and Forecast of Finland NFC Juice Market Revenues & Volume By Mixed Fruit Juice for the Period 2022 - 2032F
- Historical Data and Forecast of Finland NFC Juice Market Revenues & Volume By Packaging Type for the Period 2022 - 2032F
- Historical Data and Forecast of Finland NFC Juice Market Revenues & Volume By Bottles for the Period 2022 - 2032F
- Historical Data and Forecast of Finland NFC Juice Market Revenues & Volume By Cartons for the Period 2022 - 2032F
- Historical Data and Forecast of Finland NFC Juice Market Revenues & Volume By Cans for the Period 2022 - 2032F
- Historical Data and Forecast of Finland NFC Juice Market Revenues & Volume By Pouches for the Period 2022 - 2032F
- Historical Data and Forecast of Finland NFC Juice Market Revenues & Volume By Distribution Channel for the Period 2022 - 2032F
- Historical Data and Forecast of Finland NFC Juice Market Revenues & Volume By Supermarkets for the Period 2022 - 2032F
- Historical Data and Forecast of Finland NFC Juice Market Revenues & Volume By Convenience Stores for the Period 2022 - 2032F
- Historical Data and Forecast of Finland NFC Juice Market Revenues & Volume By Online Retail for the Period 2022 - 2032F
- Historical Data and Forecast of Finland NFC Juice Market Revenues & Volume By Specialty Stores for the Period 2022 - 2032F
- Historical Data and Forecast of Finland NFC Juice Market Revenues & Volume By Food Service for the Period 2022 - 2032F
- Finland NFC Juice Import Export Trade Statistics
- Market Opportunity Assessment By Product Type
- Market Opportunity Assessment By Packaging Type
- Market Opportunity Assessment By Distribution Channel
- Finland NFC Juice Top Companies Market Share
- Finland NFC Juice Competitive Benchmarking By Technical and Operational Parameters
- Finland NFC Juice Company Profiles
- Finland NFC Juice Key Strategic Recommendations
Frequently Asked Questions About the Market Study (FAQs):
6Wresearch actively monitors the Finland NFC Juice Market and publishes its comprehensive annual report, highlighting emerging trends, growth drivers, revenue analysis, and forecast outlook. Our insights help businesses to make data-backed strategic decisions with ongoing market dynamics. Our analysts track relevent industries related to the Finland NFC Juice Market, allowing our clients with actionable intelligence and reliable forecasts tailored to emerging regional needs.
Yes, we provide customisation as per your requirements. To learn more, feel free to contact us on sales@6wresearch.com
1 Executive Summary |
2 Introduction |
2.1 Key Highlights of the Report |
2.2 Report Description |
2.3 Market Scope & Segmentation |
2.4 Research Methodology |
2.5 Assumptions |
3 Finland NFC Juice Market Overview |
3.1 Finland Country Macro Economic Indicators |
3.2 Finland NFC Juice Market Revenues & Volume, 2022 & 2032F |
3.3 Finland NFC Juice Market - Industry Life Cycle |
3.4 Finland NFC Juice Market - Porter's Five Forces |
3.5 Finland NFC Juice Market Revenues & Volume Share, By Product Type, 2022 & 2032F |
3.6 Finland NFC Juice Market Revenues & Volume Share, By Packaging Type, 2022 & 2032F |
3.7 Finland NFC Juice Market Revenues & Volume Share, By Distribution Channel, 2022 & 2032F |
4 Finland NFC Juice Market Dynamics |
4.1 Impact Analysis |
4.2 Market Drivers |
4.2.1 Increasing health consciousness among consumers |
4.2.2 Growing demand for convenient and on-the-go beverage options |
4.2.3 Rise in disposable income leading to higher spending on premium products |
4.3 Market Restraints |
4.3.1 Seasonal fluctuations in demand for NFC juice |
4.3.2 Price sensitivity among price-conscious consumers |
5 Finland NFC Juice Market Trends |
6 Finland NFC Juice Market, By Types |
6.1 Finland NFC Juice Market, By Product Type |
6.1.1 Overview and Analysis |
6.1.2 Finland NFC Juice Market Revenues & Volume, By Product Type, 2022 - 2032F |
6.1.3 Finland NFC Juice Market Revenues & Volume, By Orange Juice, 2022 - 2032F |
6.1.4 Finland NFC Juice Market Revenues & Volume, By Apple Juice, 2022 - 2032F |
6.1.5 Finland NFC Juice Market Revenues & Volume, By Pineapple Juice, 2022 - 2032F |
6.1.6 Finland NFC Juice Market Revenues & Volume, By Mixed Fruit Juice, 2022 - 2032F |
6.2 Finland NFC Juice Market, By Packaging Type |
6.2.1 Overview and Analysis |
6.2.2 Finland NFC Juice Market Revenues & Volume, By Bottles, 2022 - 2032F |
6.2.3 Finland NFC Juice Market Revenues & Volume, By Cartons, 2022 - 2032F |
6.2.4 Finland NFC Juice Market Revenues & Volume, By Cans, 2022 - 2032F |
6.2.5 Finland NFC Juice Market Revenues & Volume, By Pouches, 2022 - 2032F |
6.3 Finland NFC Juice Market, By Distribution Channel |
6.3.1 Overview and Analysis |
6.3.2 Finland NFC Juice Market Revenues & Volume, By Supermarkets, 2022 - 2032F |
6.3.3 Finland NFC Juice Market Revenues & Volume, By Convenience Stores, 2022 - 2032F |
6.3.4 Finland NFC Juice Market Revenues & Volume, By Online Retail, 2022 - 2032F |
6.3.5 Finland NFC Juice Market Revenues & Volume, By Specialty Stores, 2022 - 2032F |
6.3.6 Finland NFC Juice Market Revenues & Volume, By Food Service, 2022 - 2032F |
7 Finland NFC Juice Market Import-Export Trade Statistics |
7.1 Finland NFC Juice Market Export to Major Countries |
7.2 Finland NFC Juice Market Imports from Major Countries |
8 Finland NFC Juice Market Key Performance Indicators |
8.1 Consumer awareness of NFC juice benefits |
8.2 Adoption rate of NFC juice among different age groups |
8.3 Market penetration of NFC juice compared to traditional juice varieties. |
9 Finland NFC Juice Market - Opportunity Assessment |
9.1 Finland NFC Juice Market Opportunity Assessment, By Product Type, 2022 & 2032F |
9.2 Finland NFC Juice Market Opportunity Assessment, By Packaging Type, 2022 & 2032F |
9.3 Finland NFC Juice Market Opportunity Assessment, By Distribution Channel, 2022 & 2032F |
10 Finland NFC Juice Market - Competitive Landscape |
10.1 Finland NFC Juice Market Revenue Share, By Companies, 2025 |
10.2 Finland NFC Juice Market Competitive Benchmarking, By Operating and Technical Parameters |
11 Company Profiles |
12 Recommendations |
13 Disclaimer |
Export potential assessment - trade Analytics for 2030
Export potential enables firms to identify high-growth global markets with greater confidence by combining advanced trade intelligence with a structured quantitative methodology. The framework analyzes emerging demand trends and country-level import patterns while integrating macroeconomic and trade datasets such as GDP and population forecasts, bilateral import–export flows, tariff structures, elasticity differentials between developed and developing economies, geographic distance, and import demand projections. Using weighted trade values from 2020–2024 as the base period to project country-to-country export potential for 2030, these inputs are operationalized through calculated drivers such as gravity model parameters, tariff impact factors, and projected GDP per-capita growth. Through an analysis of hidden potentials, demand hotspots, and market conditions that are most favorable to success, this method enables firms to focus on target countries, maximize returns, and global expansion with data, backed by accuracy.
By factoring in the projected importer demand gap that is currently unmet and could be potential opportunity, it identifies the potential for the Exporter (Country) among 190 countries, against the general trade analysis, which identifies the biggest importer or exporter.
To discover high-growth global markets and optimize your business strategy:
Click Here
Pricing
- Single User License$ 1,995
- Department License$ 2,400
- Site License$ 3,120
- Global License$ 3,795

Search
Thought Leadership and Analyst Meet


Our Clients
Latest Reports
- India Ultrasonic Smart Water Meter Market (2026-2032) | Outlook, Competition, Drivers, Trends, Demand, Competitive, Strategic Insights, Companies, Challenges, Strategy, Consumer Insights, Analysis, Opportunities, Growth, Size, Share, Industry, Revenue, Segments, Value, Segmentation, Supply, Forecast, Restraints,
- India Electromagnetic Bulk Flow Meter Market (2026-2032) | Analysis, Challenges, Strategic Insights, Supply, Forecast, Growth, Share, Consumer Insights, Competitive, Value, Outlook, Size & Demand,
- India Battery Powered Bulk Flow Meter Market (2026-2032) | Outlook, Analysis, Competitive Landscape, Growth, Size, Trends, Value, Revenue, Companies, Segmentation, Share & Forecast
- Bosnia and Herzegovina Fuel-Efficient Winglets Market (2026-2032) | Growth, Competition, Strategy, Restraints, Trends, Challenges, segmentation, Value, Outlook, Investment Opportunities, Analysis, Revenue, Companies, Insights, Pricing, Size, Drivers, Demand, Share, Forecast
- Canada Cloud CFD Market (2026-2032) | Size & Revenue, Industry, Growth, Competitive Landscape, Forecast, Segmentation, Value, Outlook, Trends, Share, Analysis, Companies
- Taiwan Food Delivery Platform Market (2026-2032) | Companies, Outlook, Analysis, Trends, Value, Revenue, Segmentation, Share, Forecast, Competitive Landscape, Growth, Size & Forecast
- United Kingdom (UK) Long-term Care Insurance Market (2026-2032) | Growth, Share, Consumer Insights, Drivers, Opportunities, Competition, Pricing Analysis, Segments, Restraints, Companies, Competitive, Value, Outlook, Size, Demand, Analysis, Challenges, Strategic Insights, Investment Trends, Revenue, Trends, Supply, Forecast
- United Kingdom (UK) Long Term Care Market (2026-2032) | Companies, Outlook, Analysis, Trends, Value, Revenue, Segmentation, Share, Forecast, Competitive Landscape, Growth, Size & Forecast
- Iraq Insulation and Waterproofing Market (2026-2032) | Outlook, Drivers, Growth, Size, Share, Industry, Revenue, Trends, Demand, Competitive, Strategic Insights, Opportunities, Segments, Companies, Challenges, Strategy, Consumer Insights, Analysis, Investment Trends, Value, Segmentation, Forecast, Restraints
- India Switchgear Market Outlook (2026-2032) | Size, Share, Trends, Growth, Revenue, Forecast, Analysis, Value, Outlook
Industry Events and Analyst Meet

HIMTEX 2026

India Refining Summit 2026

India EV Show 2026

EV tech India Expo 2026

Auto Tech Asia 2026
Whitepaper
- Middle East & Africa Commercial Security Market Click here to view more.
- Middle East & Africa Fire Safety Systems & Equipment Market Click here to view more.
- GCC Drone Market Click here to view more.
- Middle East Lighting Fixture Market Click here to view more.
- GCC Physical & Perimeter Security Market Click here to view more.
6WResearch In News
- Doha a strategic location for EV manufacturing hub: IPA Qatar
- Demand for luxury TVs surging in the GCC, says Samsung
- Empowering Growth: The Thriving Journey of Bangladesh’s Cable Industry
- Demand for luxury TVs surging in the GCC, says Samsung
- Video call with a traditional healer? Once unthinkable, it’s now common in South Africa
- Intelligent Buildings To Smooth GCC’s Path To Net Zero