Finland Saccharin Market (2026-2032) | Share, Analysis, Forecast, Trends, Companies, Segmentation, Size, Growth, Industry, Outlook, Value & Revenue
Market Forecast By Form (Granular, Powder), By Product Type (Sodium Saccharin, Calcium Saccharin, Insoluble Saccharin), By Application (Food and Beverages, Agrochemicals and Chemicals, Dietary Supplements, Table-Top Sweeteners, Personal Care and Cosmetics Products, Pharmaceuticals, Electroplating Solutions, Others) And Competitive Landscape
| Product Code: ETC4749997 | Publication Date: Nov 2023 | Updated Date: Apr 2026 | Product Type: Market Research Report | |
| Publisher: 6Wresearch | Author: Shubham Padhi | No. of Pages: 60 | No. of Figures: 30 | No. of Tables: 5 |
Finland Saccharin Market Size (2020-2030)
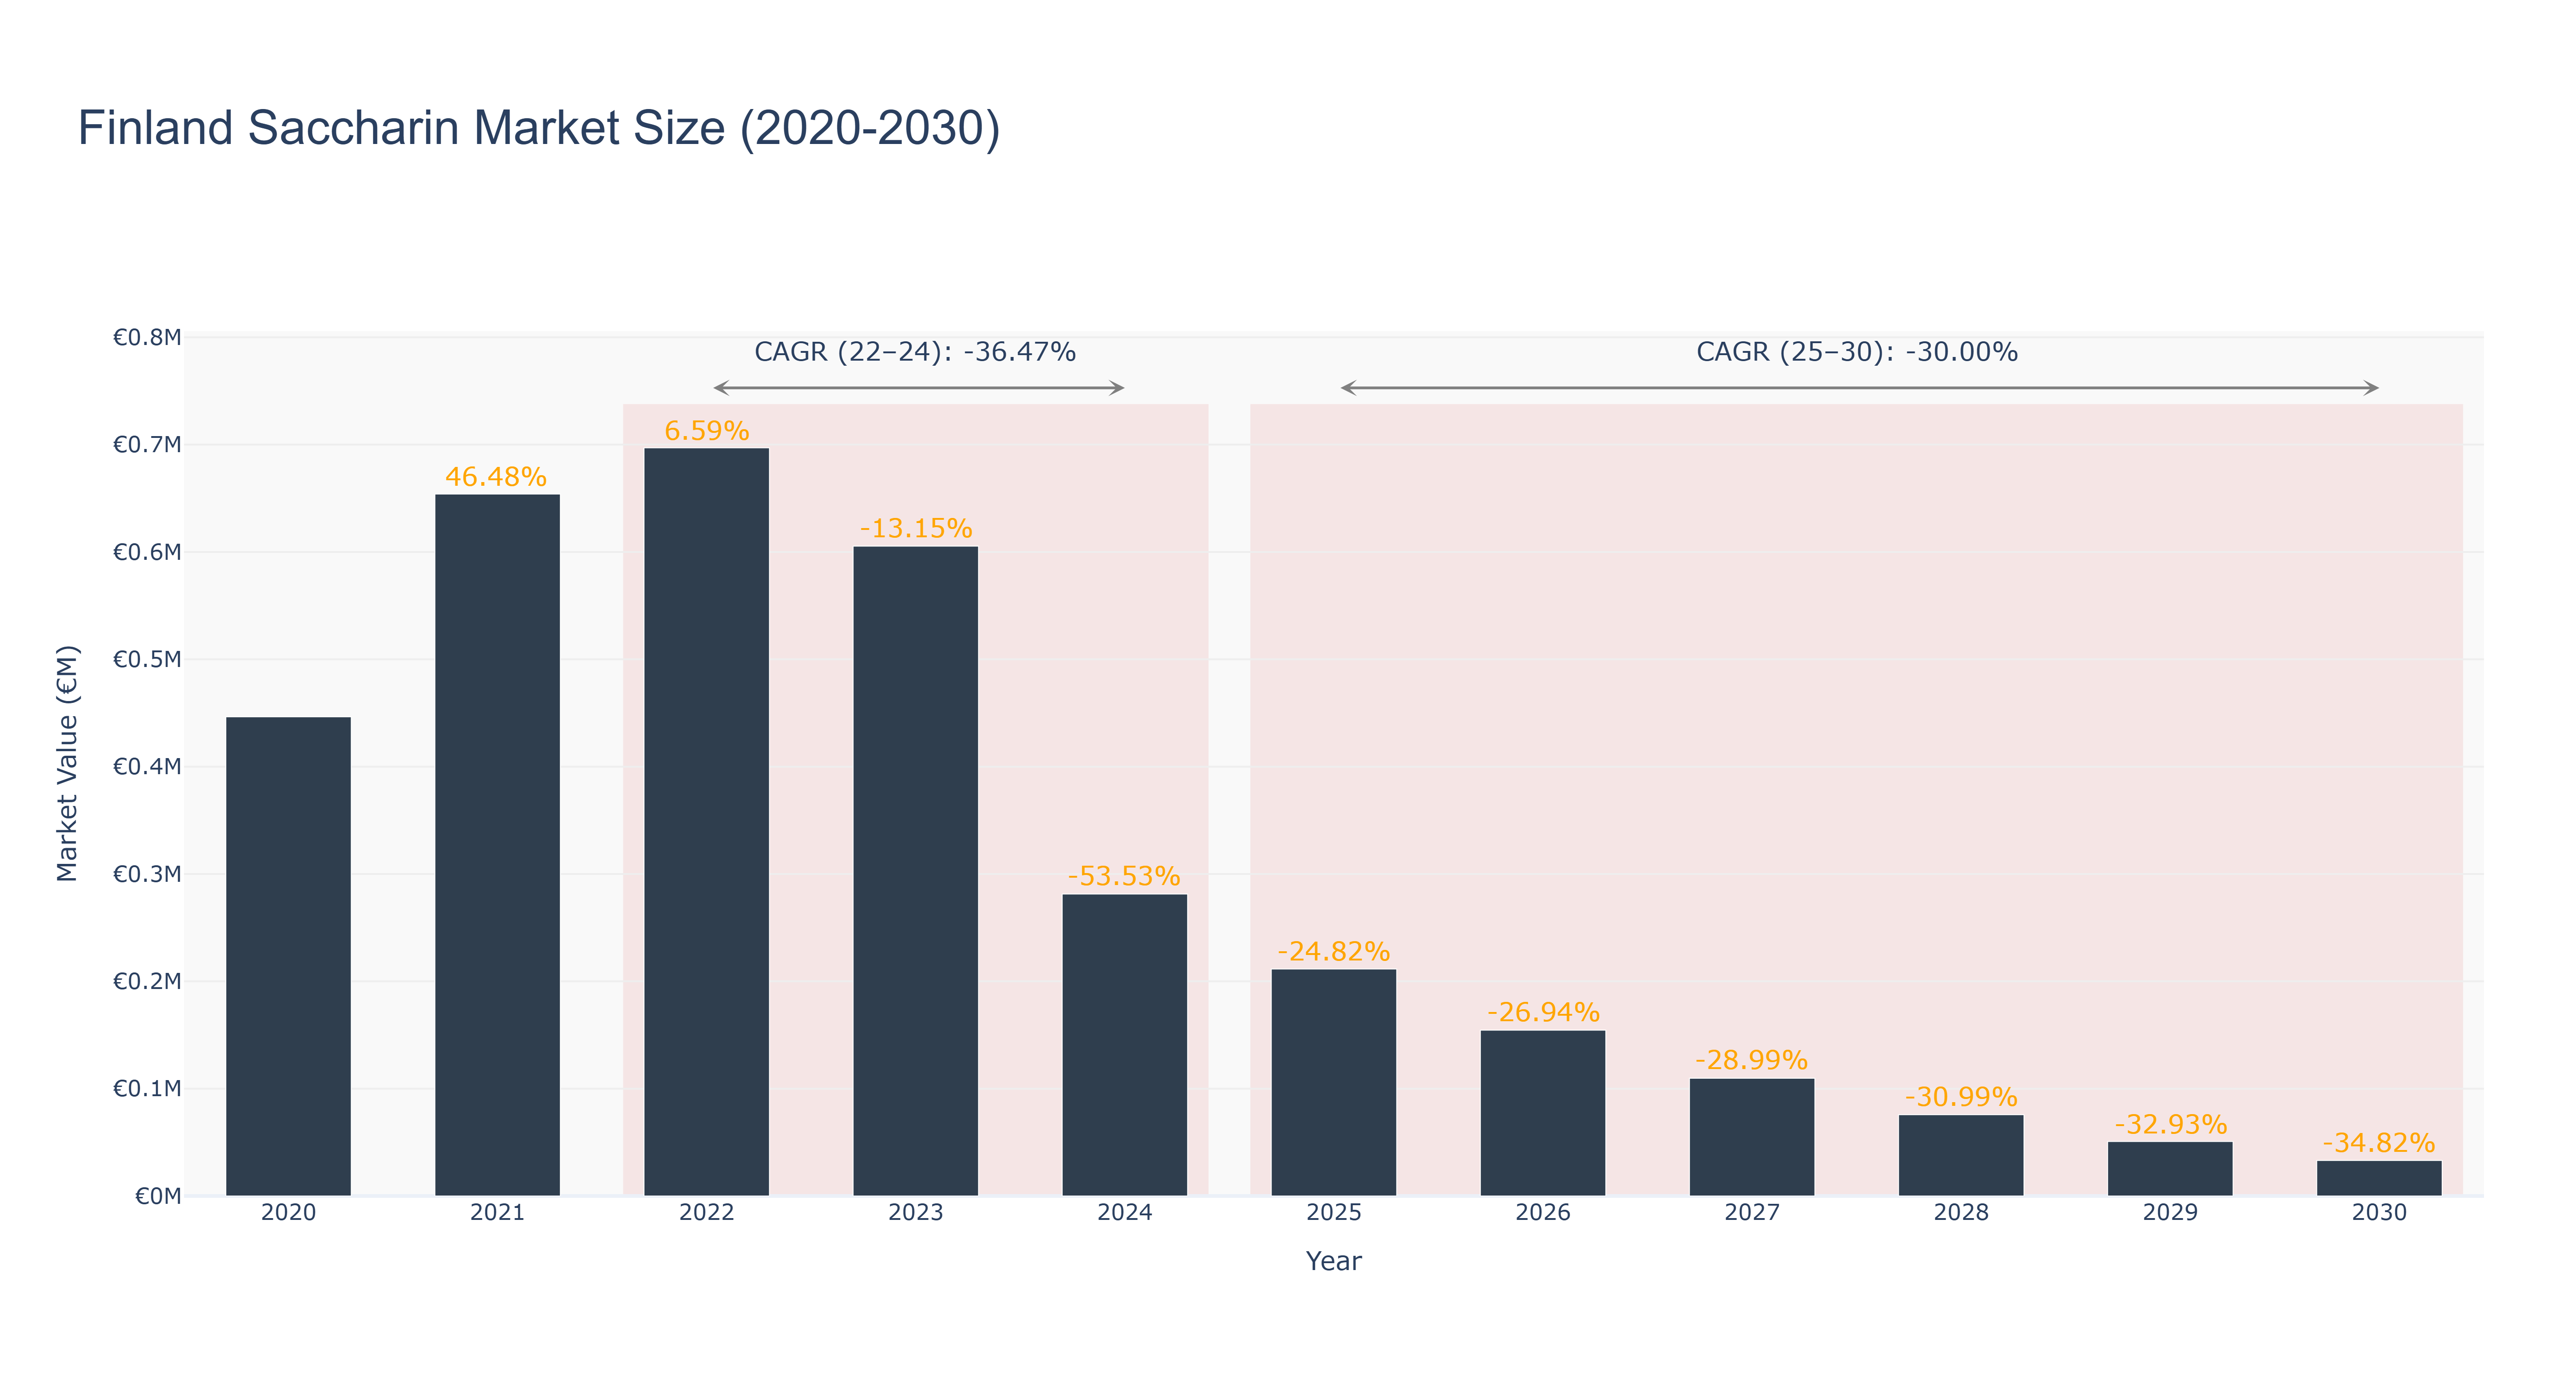
Finland Saccharin Market has experienced a notable decline in market size over the past decade. The peak market size of €0.70 million was recorded in 2022, followed by a steady decrease to €0.03 million in 2030. The market saw a significant drop from 2022 to 2024, with a compound annual growth rate (CAGR) of -36.47%, attributed to changing consumer preferences and increased health awareness. The forecasted CAGR from 2025 to 2030 stands at -30.0%, indicating a continued downward trend. Despite the challenging market conditions, recent developments in Finland's food and beverage industry, such as increased focus on natural sweeteners and product innovation, offer potential growth opportunities for saccharin manufacturers in the near future. As market research analysts, monitoring these industry drivers and upcoming projects will be essential for strategic decision-making in this competitive landscape.
Finland Saccharin Market: Production & Trade Performance (2019-2025)
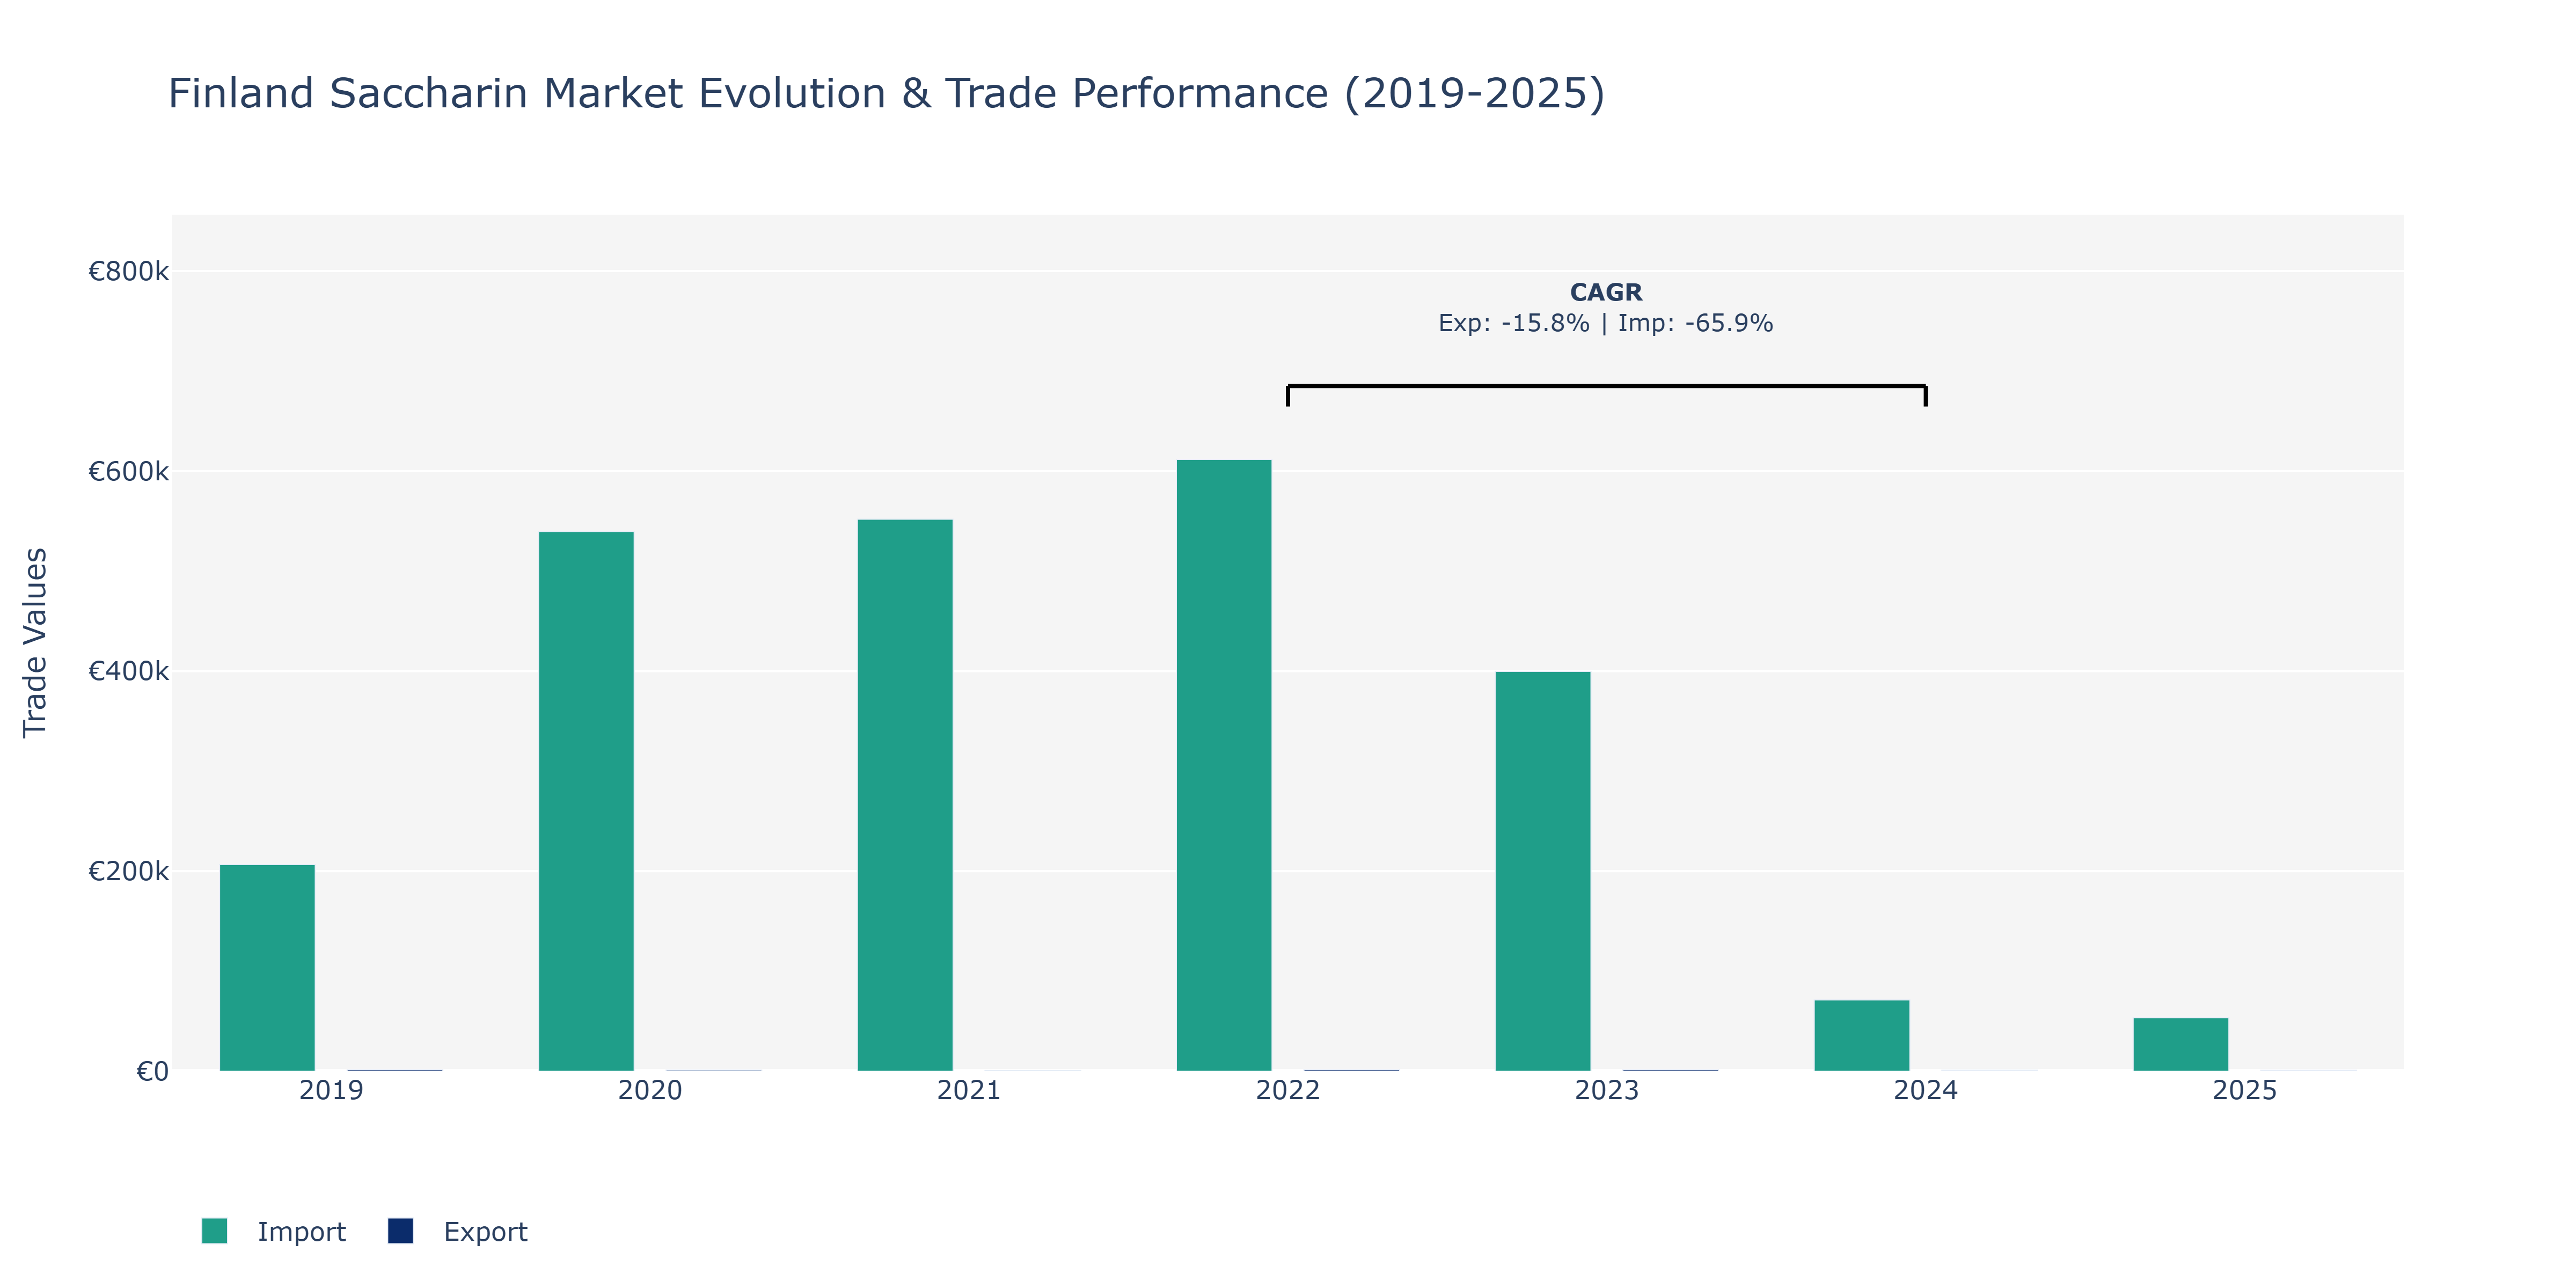
Between 2019 and 2025, the Finland Saccharin market saw notable fluctuations in exports and imports. The data reveals a decline in exports from €1.44 thousand in 2019 to around €894 thousand in 2025. In contrast, imports spiked from €206.62 thousand in 2019 to approximately €539.65 thousand in 2020, before gradually decreasing to €53.53 thousand in 2025. The peak points were seen in 2020 for imports and 2019 for exports. The decrease in exports could be attributed to shifting consumer preferences towards alternative sweeteners or changes in global demand for saccharin. Conversely, the fluctuations in imports may be influenced by international trade agreements or changes in domestic production capacities. As the market evolves, companies operating in the Finland Saccharin market may need to adapt their strategies to navigate these dynamic trade dynamics effectively.
Key Highlights of the Report:
- Finland Saccharin Market Outlook
- Market Size of Finland Saccharin Market, 2025
- Forecast of Finland Saccharin Market, 2032
- Historical Data and Forecast of Finland Saccharin Revenues & Volume for the Period 2022 - 2032F
- Finland Saccharin Market Trend Evolution
- Finland Saccharin Market Drivers and Challenges
- Finland Saccharin Price Trends
- Finland Saccharin Porter`s Five Forces
- Finland Saccharin Industry Life Cycle
- Historical Data and Forecast of Finland Saccharin Market Revenues & Volume By Form for the Period 2022 - 2032F
- Historical Data and Forecast of Finland Saccharin Market Revenues & Volume By Granular for the Period 2022 - 2032F
- Historical Data and Forecast of Finland Saccharin Market Revenues & Volume By Powder for the Period 2022 - 2032F
- Historical Data and Forecast of Finland Saccharin Market Revenues & Volume By Product Type for the Period 2022 - 2032F
- Historical Data and Forecast of Finland Saccharin Market Revenues & Volume By Sodium Saccharin for the Period 2022 - 2032F
- Historical Data and Forecast of Finland Saccharin Market Revenues & Volume By Calcium Saccharin for the Period 2022 - 2032F
- Historical Data and Forecast of Finland Saccharin Market Revenues & Volume By Insoluble Saccharin for the Period 2022 - 2032F
- Historical Data and Forecast of Finland Saccharin Market Revenues & Volume By Application for the Period 2022 - 2032F
- Historical Data and Forecast of Finland Saccharin Market Revenues & Volume By Food and Beverages for the Period 2022 - 2032F
- Historical Data and Forecast of Finland Saccharin Market Revenues & Volume By Agrochemicals and Chemicals for the Period 2022 - 2032F
- Historical Data and Forecast of Finland Saccharin Market Revenues & Volume By Dietary Supplements for the Period 2022 - 2032F
- Historical Data and Forecast of Finland Saccharin Market Revenues & Volume By Table-Top Sweeteners for the Period 2022 - 2032F
- Historical Data and Forecast of Finland Saccharin Market Revenues & Volume By Personal Care and Cosmetics Products for the Period 2022 - 2032F
- Historical Data and Forecast of Finland Saccharin Market Revenues & Volume By Pharmaceuticals for the Period 2022 - 2032F
- Historical Data and Forecast of Finland Saccharin Market Revenues & Volume By Electroplating Solutions for the Period 2022 - 2032F
- Historical Data and Forecast of Finland Saccharin Market Revenues & Volume By Others for the Period 2022 - 2032F
- Finland Saccharin Import Export Trade Statistics
- Market Opportunity Assessment By Form
- Market Opportunity Assessment By Product Type
- Market Opportunity Assessment By Application
- Finland Saccharin Top Companies Market Share
- Finland Saccharin Competitive Benchmarking By Technical and Operational Parameters
- Finland Saccharin Company Profiles
- Finland Saccharin Key Strategic Recommendations
Frequently Asked Questions About the Market Study (FAQs):
6Wresearch actively monitors the Finland Saccharin Market and publishes its comprehensive annual report, highlighting emerging trends, growth drivers, revenue analysis, and forecast outlook. Our insights help businesses to make data-backed strategic decisions with ongoing market dynamics. Our analysts track relevent industries related to the Finland Saccharin Market, allowing our clients with actionable intelligence and reliable forecasts tailored to emerging regional needs.
Yes, we provide customisation as per your requirements. To learn more, feel free to contact us on sales@6wresearch.com
1 Executive Summary |
2 Introduction |
2.1 Key Highlights of the Report |
2.2 Report Description |
2.3 Market Scope & Segmentation |
2.4 Research Methodology |
2.5 Assumptions |
3 Finland Saccharin Market Overview |
3.1 Finland Country Macro Economic Indicators |
3.2 Finland Saccharin Market Revenues & Volume, 2022 & 2032F |
3.3 Finland Saccharin Market - Industry Life Cycle |
3.4 Finland Saccharin Market - Porter's Five Forces |
3.5 Finland Saccharin Market Revenues & Volume Share, By Form, 2022 & 2032F |
3.6 Finland Saccharin Market Revenues & Volume Share, By Product Type, 2022 & 2032F |
3.7 Finland Saccharin Market Revenues & Volume Share, By Application, 2022 & 2032F |
4 Finland Saccharin Market Dynamics |
4.1 Impact Analysis |
4.2 Market Drivers |
4.2.1 Increasing health consciousness among consumers regarding sugar consumption |
4.2.2 Growing demand for low-calorie sweeteners in the food and beverage industry |
4.2.3 Rising prevalence of diabetes and obesity, driving the need for sugar substitutes |
4.2.4 Technological advancements leading to the development of innovative saccharin products |
4.3 Market Restraints |
4.3.1 Stringent regulations and restrictions on the use of artificial sweeteners |
4.3.2 Concerns regarding the safety and health implications of saccharin consumption |
4.3.3 Fluctuating prices of raw materials impacting production costs |
5 Finland Saccharin Market Trends |
6 Finland Saccharin Market Segmentations |
6.1 Finland Saccharin Market, By Form |
6.1.1 Overview and Analysis |
6.1.2 Finland Saccharin Market Revenues & Volume, By Granular, 2022 - 2032F |
6.1.3 Finland Saccharin Market Revenues & Volume, By Powder, 2022 - 2032F |
6.2 Finland Saccharin Market, By Product Type |
6.2.1 Overview and Analysis |
6.2.2 Finland Saccharin Market Revenues & Volume, By Sodium Saccharin, 2022 - 2032F |
6.2.3 Finland Saccharin Market Revenues & Volume, By Calcium Saccharin, 2022 - 2032F |
6.2.4 Finland Saccharin Market Revenues & Volume, By Insoluble Saccharin, 2022 - 2032F |
6.3 Finland Saccharin Market, By Application |
6.3.1 Overview and Analysis |
6.3.2 Finland Saccharin Market Revenues & Volume, By Food and Beverages, 2022 - 2032F |
6.3.3 Finland Saccharin Market Revenues & Volume, By Agrochemicals and Chemicals, 2022 - 2032F |
6.3.4 Finland Saccharin Market Revenues & Volume, By Dietary Supplements, 2022 - 2032F |
6.3.5 Finland Saccharin Market Revenues & Volume, By Table-Top Sweeteners, 2022 - 2032F |
6.3.6 Finland Saccharin Market Revenues & Volume, By Personal Care and Cosmetics Products, 2022 - 2032F |
6.3.7 Finland Saccharin Market Revenues & Volume, By Pharmaceuticals, 2022 - 2032F |
6.3.8 Finland Saccharin Market Revenues & Volume, By Others, 2022 - 2032F |
6.3.9 Finland Saccharin Market Revenues & Volume, By Others, 2022 - 2032F |
7 Finland Saccharin Market Import-Export Trade Statistics |
7.1 Finland Saccharin Market Export to Major Countries |
7.2 Finland Saccharin Market Imports from Major Countries |
8 Finland Saccharin Market Key Performance Indicators |
8.1 Consumer awareness and perception of saccharin as a sugar substitute |
8.2 Number of new product launches containing saccharin in the Finnish market |
8.3 Research and development investments in saccharin-based product innovations |
8.4 Market acceptance and adoption rates of saccharin-enhanced products |
8.5 Regulatory approvals and compliance status for saccharin usage in Finland |
9 Finland Saccharin Market - Opportunity Assessment |
9.1 Finland Saccharin Market Opportunity Assessment, By Form, 2022 & 2032F |
9.2 Finland Saccharin Market Opportunity Assessment, By Product Type, 2022 & 2032F |
9.3 Finland Saccharin Market Opportunity Assessment, By Application, 2022 & 2032F |
10 Finland Saccharin Market - Competitive Landscape |
10.1 Finland Saccharin Market Revenue Share, By Companies, 2025 |
10.2 Finland Saccharin Market Competitive Benchmarking, By Operating and Technical Parameters |
11 Company Profiles |
12 Recommendations | 13 Disclaimer |
Export potential assessment - trade Analytics for 2030
Export potential enables firms to identify high-growth global markets with greater confidence by combining advanced trade intelligence with a structured quantitative methodology. The framework analyzes emerging demand trends and country-level import patterns while integrating macroeconomic and trade datasets such as GDP and population forecasts, bilateral import–export flows, tariff structures, elasticity differentials between developed and developing economies, geographic distance, and import demand projections. Using weighted trade values from 2020–2024 as the base period to project country-to-country export potential for 2030, these inputs are operationalized through calculated drivers such as gravity model parameters, tariff impact factors, and projected GDP per-capita growth. Through an analysis of hidden potentials, demand hotspots, and market conditions that are most favorable to success, this method enables firms to focus on target countries, maximize returns, and global expansion with data, backed by accuracy.
By factoring in the projected importer demand gap that is currently unmet and could be potential opportunity, it identifies the potential for the Exporter (Country) among 190 countries, against the general trade analysis, which identifies the biggest importer or exporter.
To discover high-growth global markets and optimize your business strategy:
Click Here
Pricing
- Single User License$ 1,995
- Department License$ 2,400
- Site License$ 3,120
- Global License$ 3,795

Search
Thought Leadership and Analyst Meet


Our Clients
Latest Reports
- India Ultrasonic Smart Water Meter Market (2026-2032) | Outlook, Competition, Drivers, Trends, Demand, Competitive, Strategic Insights, Companies, Challenges, Strategy, Consumer Insights, Analysis, Opportunities, Growth, Size, Share, Industry, Revenue, Segments, Value, Segmentation, Supply, Forecast, Restraints,
- India Electromagnetic Bulk Flow Meter Market (2026-2032) | Analysis, Challenges, Strategic Insights, Supply, Forecast, Growth, Share, Consumer Insights, Competitive, Value, Outlook, Size & Demand,
- India Battery Powered Bulk Flow Meter Market (2026-2032) | Outlook, Analysis, Competitive Landscape, Growth, Size, Trends, Value, Revenue, Companies, Segmentation, Share & Forecast
- Bosnia and Herzegovina Fuel-Efficient Winglets Market (2026-2032) | Growth, Competition, Strategy, Restraints, Trends, Challenges, segmentation, Value, Outlook, Investment Opportunities, Analysis, Revenue, Companies, Insights, Pricing, Size, Drivers, Demand, Share, Forecast
- Canada Cloud CFD Market (2026-2032) | Size & Revenue, Industry, Growth, Competitive Landscape, Forecast, Segmentation, Value, Outlook, Trends, Share, Analysis, Companies
- Taiwan Food Delivery Platform Market (2026-2032) | Companies, Outlook, Analysis, Trends, Value, Revenue, Segmentation, Share, Forecast, Competitive Landscape, Growth, Size & Forecast
- United Kingdom (UK) Long-term Care Insurance Market (2026-2032) | Growth, Share, Consumer Insights, Drivers, Opportunities, Competition, Pricing Analysis, Segments, Restraints, Companies, Competitive, Value, Outlook, Size, Demand, Analysis, Challenges, Strategic Insights, Investment Trends, Revenue, Trends, Supply, Forecast
- United Kingdom (UK) Long Term Care Market (2026-2032) | Companies, Outlook, Analysis, Trends, Value, Revenue, Segmentation, Share, Forecast, Competitive Landscape, Growth, Size & Forecast
- Iraq Insulation and Waterproofing Market (2026-2032) | Outlook, Drivers, Growth, Size, Share, Industry, Revenue, Trends, Demand, Competitive, Strategic Insights, Opportunities, Segments, Companies, Challenges, Strategy, Consumer Insights, Analysis, Investment Trends, Value, Segmentation, Forecast, Restraints
- India Switchgear Market Outlook (2026-2032) | Size, Share, Trends, Growth, Revenue, Forecast, Analysis, Value, Outlook
Industry Events and Analyst Meet

India EV Show 2026

EV tech India Expo 2026

Auto Tech Asia 2026

Battery Tech India 2026

Smart Production Solutions Guangzhou 2026
Whitepaper
- Middle East & Africa Commercial Security Market Click here to view more.
- Middle East & Africa Fire Safety Systems & Equipment Market Click here to view more.
- GCC Drone Market Click here to view more.
- Middle East Lighting Fixture Market Click here to view more.
- GCC Physical & Perimeter Security Market Click here to view more.
6WResearch In News
- Doha a strategic location for EV manufacturing hub: IPA Qatar
- Demand for luxury TVs surging in the GCC, says Samsung
- Empowering Growth: The Thriving Journey of Bangladesh’s Cable Industry
- Demand for luxury TVs surging in the GCC, says Samsung
- Video call with a traditional healer? Once unthinkable, it’s now common in South Africa
- Intelligent Buildings To Smooth GCC’s Path To Net Zero