Georgia 3D Holographic Display and Services Market (2026-2032) Outlook | Industry, Trends, Growth, Revenue, Size, Value, Analysis, Share, Companies & Forecast
Market Forecast By End-users (Media and Entertainment, Consumer Electronics, Healthcare, Automotive, Retail, Others) And Competitive Landscape
| Product Code: ETC066799 | Publication Date: Aug 2021 | Updated Date: Jun 2026 | Product Type: Report | |
| Publisher: 6Wresearch | Author: Bhawna Singh | No. of Pages: 70 | No. of Figures: 35 | No. of Tables: 5 |
Georgia 3D Holographic Display and Services Market Size, Share & Growth Rate
The Georgia 3D Holographic Display and Services Market was estimated at USD 479 Million in 2025 and is projected to reach USD 690 Million by 2032, growing at a CAGR of 5.4% from 2026 to 2032. This significant trajectory is primarily driven by the burgeoning interest in immersive visual experiences across various sectors, such as retail and healthcare. As companies prioritize innovative engagement methods, the demand for holographic solutions is set to increase substantially, supported by advancements in display technologies.
Georgia 3D Holographic Display and Services Market Year-wise Growth Rate and Key Drivers
This graph highlights how the Georgia 3D Holographic Display and Services Market has steadily grown over the years, supported by major growth factors.
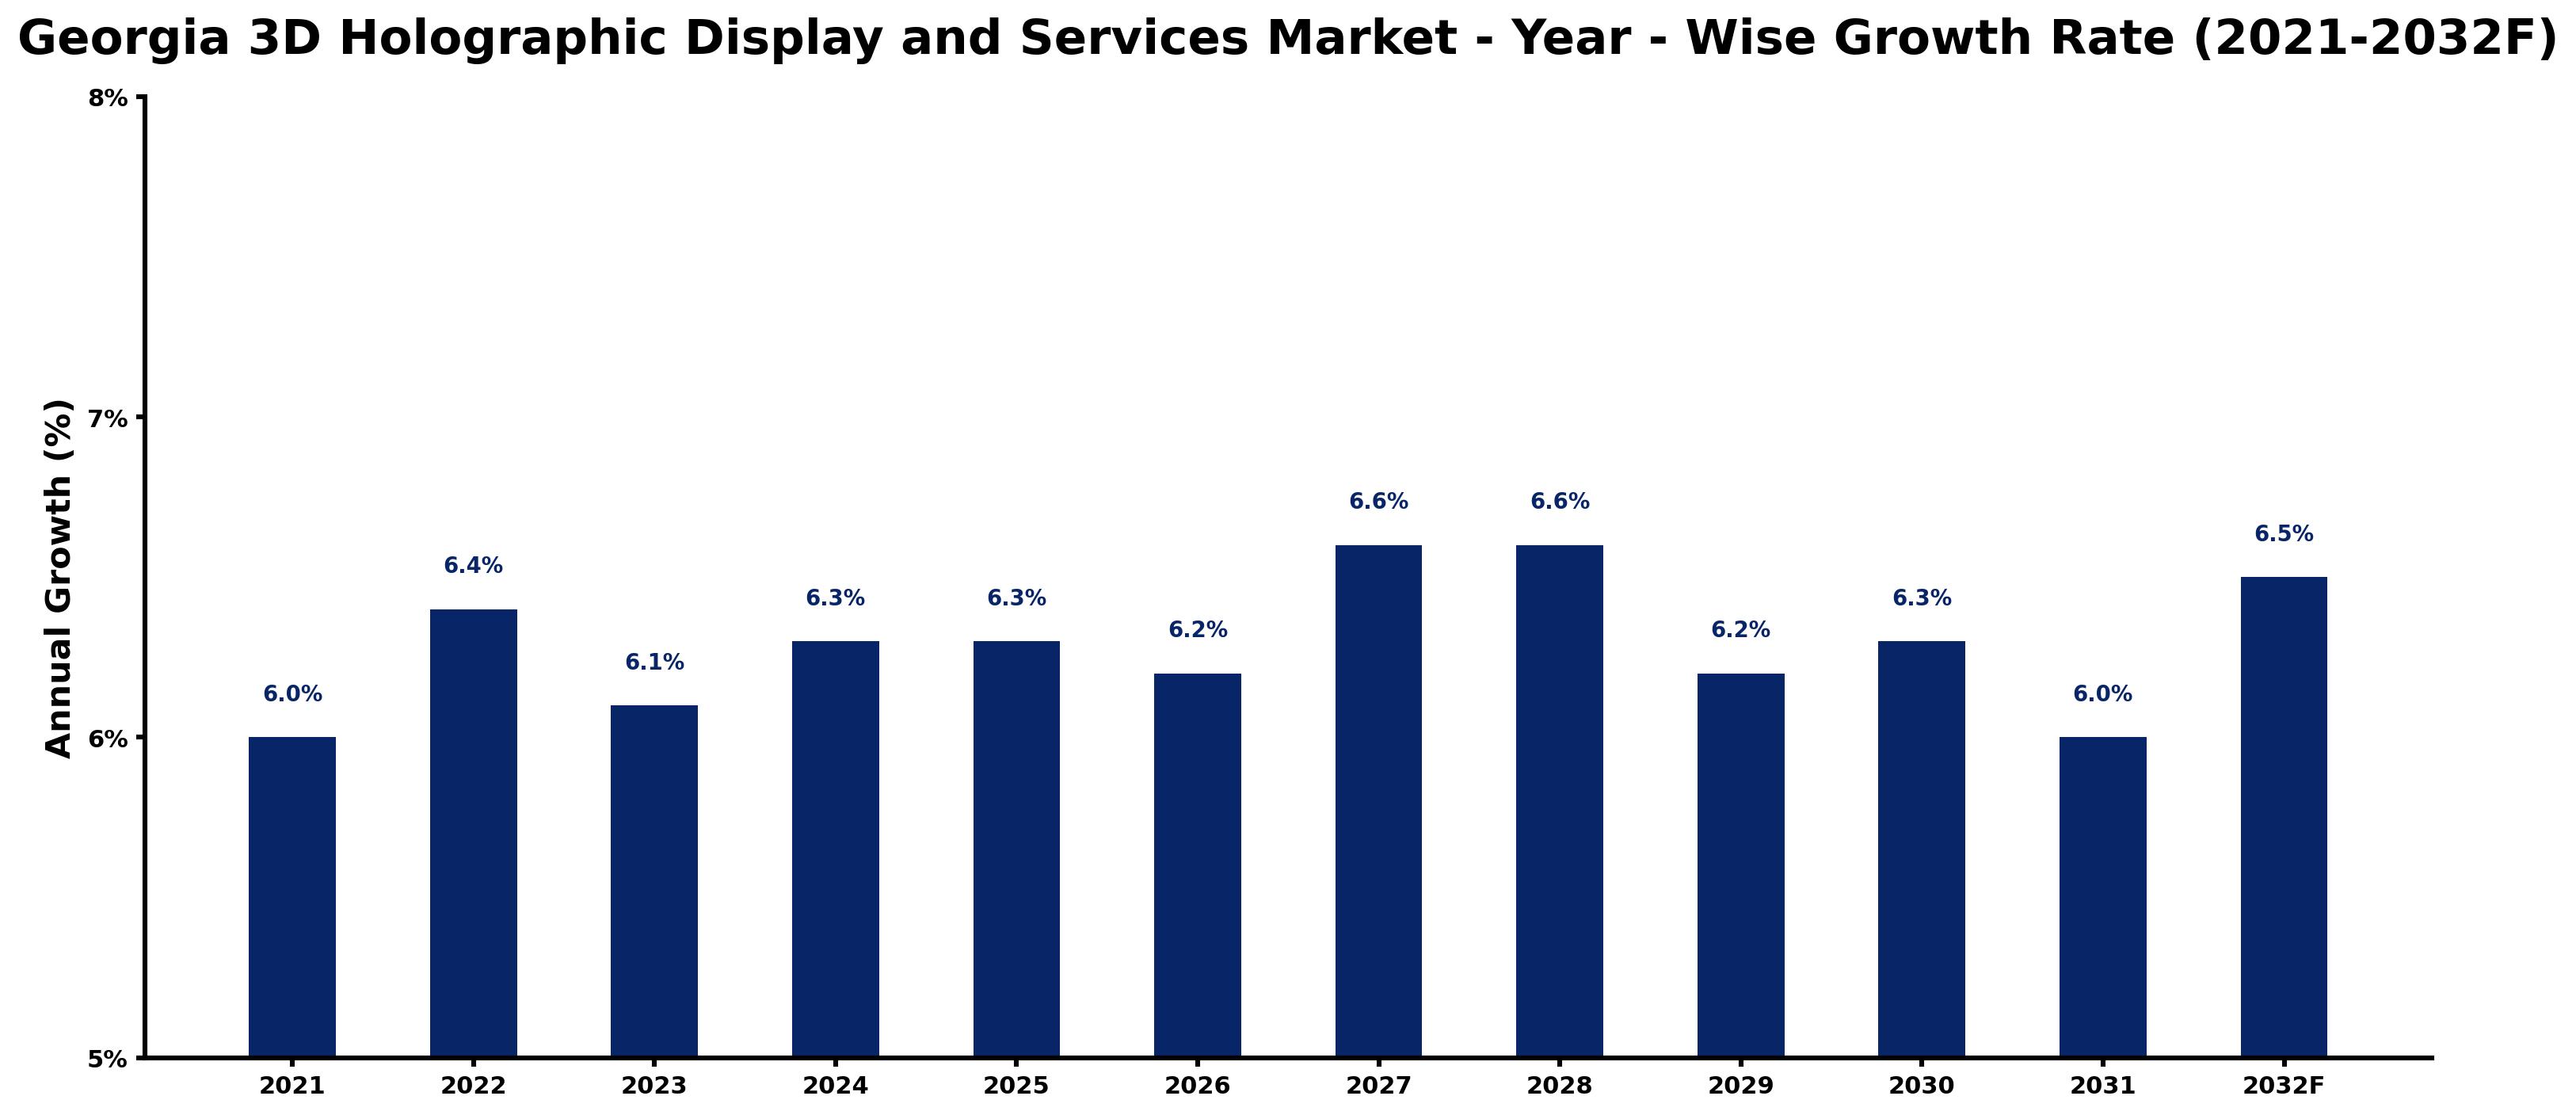
The table below presents the year‑wise growth rates along with the key drivers influencing the market
| Year | Growth Rate | Major Drivers |
| 2021 | 6.0% | Increasing adoption of advanced technologies |
| 2022 | 6.4% | Growing renewable energy integration projects |
| 2023 | 6.1% | Expansion of commercial construction activities |
| 2024 | 6.3% | Increasing industrial infrastructure investments |
| 2025 | 6.3% | Growing urbanization and commercial development |
| 2026 | 6.2% | Expansion of manufacturing activities |
| 2027 | 6.6% | Expansion of commercial construction activities |
| 2028 | 6.6% | Increasing industrial infrastructure investments |
| 2029 | 6.2% | Increasing adoption of advanced technologies |
| 2030 | 6.3% | Increasing industrial automation investments |
| 2031 | 6.0% | Growing urbanization and commercial development |
| 2032 | 6.5% | Increasing industrial automation investments |
Note - Market size estimations and growth projections presented in this report are based on 6Wresearch’s advanced forecasting approach, validated with industry datasets as of June 2026.
Georgia 3D Holographic Display and Services Market Synopsis
In recent years, the Georgia 3D Holographic Display and Services Market has emerged as a pivotal player in revolutionizing how businesses interact with their customers. The integration of holographic technologies into advertising campaigns and educational platforms showcases a distinct shift towards more interactive engagement methods.
The market is currently characterized by a surge in demand for customized solutions tailored to various industries, including healthcare and automotive. Companies are increasingly harnessing the potential of holographic displays to enhance brand visibility, making them a vital asset for businesses striving to stand out in a competitive landscape.
Georgia 3D Holographic Display and Services Market Key Takeaways
- The market is witnessing accelerated growth driven by technological advancements and the demand for interactive visual experiences.
- Applications in entertainment, retail, and healthcare are leading the charge in adoption rates.
- Companies are focusing on creating tailored solutions to meet the diverse needs of their clients.
- Investment in research and development is crucial to overcoming challenges associated with high implementation costs.
- The growing trend of augmented and virtual reality is further propelling the holographic display sector.
Evaluation of Restraints in Georgia 3D Holographic Display and Services Market
Despite its promising growth, the Georgia 3D Holographic Display and Services Market faces several significant restraints. The high costs associated with the development and implementation of advanced holographic technologies remain a primary barrier for many companies. Furthermore, a general lack of consumer understanding about 3D holography complicates marketing efforts, as potential users may be unaware of the benefits these technologies can offer. Additionally, regulatory constraints and technical limitations could hinder further expansion, necessitating strategic planning to navigate these challenges effectively.
Georgia 3D Holographic Display and Services Market Trends
Current trends indicate a growing emphasis on high-quality, realistic 3D projections in holographic displays, significantly enhancing customer engagement. Furthermore, an increase in demand for holographic services—such as event showcases and virtual presentations—is becoming increasingly evident across various sectors. Advances in augmented reality (AR) and virtual reality (VR) technologies are also influencing market dynamics, as more businesses recognize their potential to create captivating and memorable experiences for audiences.
Georgia 3D Holographic Display and Services Market Opportunities
The Georgia 3D Holographic Display and Services Market presents a wealth of investment opportunities, particularly as companies strive to incorporate innovative visual technologies. There is significant potential for businesses specializing in the development of cutting-edge holographic solutions and services catering to various industries. Moreover, investment in R&D initiatives aimed at expanding the functionalities and applications of holographic displays will position investors to take full advantage of this rapidly evolving market.
Government Initiatives in the Georgia 3D Holographic Display and Services Market
Government policies surrounding the Georgia 3D Holographic Display and Services Market focus primarily on ensuring consumer safety and privacy. The state has implemented guidelines that regulate the operation of companies within this sector, emphasizing compliance with technical standards. Additionally, there are incentives, such as tax breaks and grants, designed to encourage innovation and foster growth in the holographic technology space. Collaboration between industry and academic institutions is actively promoted to facilitate research and development in this burgeoning field.
Future Insights of the Georgia 3D Holographic Display and Services Market
Looking ahead to 2026-2032, the Georgia 3D Holographic Display and Services Market is poised for substantial growth. The continued advancements in holographic technology and the escalating demand for interactive display solutions across diverse sectors signal a bright future. As businesses seek to differentiate themselves and engage their audiences more effectively, the market will likely expand to accommodate a broader range of applications, positioning it as a cornerstone of technological innovation in Georgia.
Georgia 3D Holographic Display and Services Market Latest Developments (May 2025 - June 2026)
Recent developments in the Georgia 3D Holographic Display and Services Market indicate a sustained push towards integrating advanced holographic technologies into commercial offerings. As companies refine their approaches to creating immersive experiences, there is a noticeable uptick in partnerships aimed at leveraging augmented and virtual reality capabilities. Additionally, events and showcases are becoming more prevalent, demonstrating the practical applications of these cutting-edge display solutions in real-world settings.
Georgia 3D Holographic Display and Services Market - Key Attractiveness of the Report
- 10 Years of Market Numbers
- Historical Data Starting from 2022 to 2025
- Base Year: 2025
- Forecast Data until 2032
- Key Performance Indicators Impacting the Market
- Major Upcoming Developments and Projects
Key Highlights of the Report:
- Georgia 3D Holographic Display and Services Market Outlook
- Market Size of Georgia 3D Holographic Display and Services Market, 2025
- Forecast of Georgia 3D Holographic Display and Services Market, 2032
- Historical Data and Forecast of Georgia 3D Holographic Display and Services Revenues & Volume for the Period 2022-2032F
- Georgia 3D Holographic Display and Services Market Trend Evolution
- Georgia 3D Holographic Display and Services Market Drivers and Challenges
- Georgia 3D Holographic Display and Services Price Trends
- Georgia 3D Holographic Display and Services Porter's Five Forces
- Georgia 3D Holographic Display and Services Industry Life Cycle
- Historical Data and Forecast of Georgia 3D Holographic Display and Services Market Revenues & Volume By End-users for the Period 2022-2032F
- Historical Data and Forecast of Georgia 3D Holographic Display and Services Market Revenues & Volume By Media and Entertainment for the Period 2022-2032F
- Historical Data and Forecast of Georgia 3D Holographic Display and Services Market Revenues & Volume By Consumer Electronics for the Period 2022-2032F
- Historical Data and Forecast of Georgia 3D Holographic Display and Services Market Revenues & Volume By Healthcare for the Period 2022-2032F
- Historical Data and Forecast of Georgia 3D Holographic Display and Services Market Revenues & Volume By Automotive for the Period 2022-2032F
- Historical Data and Forecast of Georgia 3D Holographic Display and Services Market Revenues & Volume By Retail for the Period 2022-2032F
- Historical Data and Forecast of Georgia 3D Holographic Display and Services Market Revenues & Volume By Others for the Period 2022-2032F
- Georgia 3D Holographic Display and Services Import Export Trade Statistics
- Market Opportunity Assessment By End-users
- Georgia 3D Holographic Display and Services Top Companies Market Share
- Georgia 3D Holographic Display and Services Competitive Benchmarking By Technical and Operational Parameters
- Georgia 3D Holographic Display and Services Company Profiles
- Georgia 3D Holographic Display and Services Key Strategic Recommendations
Georgia 3D Holographic Display and Services Market - Frequently Asked Questions
The Georgia 3D Holographic Display and Services Market is projected to grow from USD 479 Million in 2025 to USD 690 Million by 2032, with a CAGR of 5.4% from 2026 to 2032.
The healthcare, retail, and entertainment sectors are notably driving the adoption of holographic displays, utilizing them to enhance customer engagement and experience.
Many businesses are investing heavily in research and development to innovate and reduce costs, while also exploring strategic partnerships to share resources and expertise.
Government policies focus on regulating safety and privacy while providing incentives for innovation, ensuring companies can operate within ethical and legal frameworks as they expand their offerings.
Yes, businesses are increasingly leveraging holographic displays for product launches, marketing events, and virtual presentations to create memorable experiences that capture audience attention.
6Wresearch actively monitors the Georgia 3D Holographic Display and Services Market and publishes its comprehensive annual report, highlighting emerging trends, growth drivers, revenue analysis, and forecast outlook. Our insights help businesses to make data-backed strategic decisions with ongoing market dynamics. Our analysts track relevent industries related to the Georgia 3D Holographic Display and Services Market, allowing our clients with actionable intelligence and reliable forecasts tailored to emerging regional needs.
Yes, we provide customisation as per your requirements. To learn more, feel free to contact us on sales@6wresearch.com
1 Executive Summary |
2 Introduction |
2.1 Key Highlights of the Report |
2.2 Report Description |
2.3 Market Scope & Segmentation |
2.4 Research Methodology |
2.5 Assumptions |
3 Georgia 3D Holographic Display and Services Market Overview |
3.1 Georgia Country Macro Economic Indicators |
3.2 Georgia 3D Holographic Display and Services Market Revenues & Volume, 2022 & 2032F |
3.3 Georgia 3D Holographic Display and Services Market - Industry Life Cycle |
3.4 Georgia 3D Holographic Display and Services Market - Porter's Five Forces |
3.5 Georgia 3D Holographic Display and Services Market Revenues & Volume Share, By End-users, 2022 & 2032F |
4 Georgia 3D Holographic Display and Services Market Dynamics |
4.1 Impact Analysis |
4.2 Market Drivers |
4.3 Market Restraints |
5 Georgia 3D Holographic Display and Services Market Trends |
6 Georgia 3D Holographic Display and Services Market, By Types |
6.1 Georgia 3D Holographic Display and Services Market, By End-users |
6.1.1 Overview and Analysis |
6.1.2 Georgia 3D Holographic Display and Services Market Revenues & Volume, By End-users, 2022-2032F |
6.1.3 Georgia 3D Holographic Display and Services Market Revenues & Volume, By Media and Entertainment, 2022-2032F |
6.1.4 Georgia 3D Holographic Display and Services Market Revenues & Volume, By Consumer Electronics, 2022-2032F |
6.1.5 Georgia 3D Holographic Display and Services Market Revenues & Volume, By Healthcare, 2022-2032F |
6.1.6 Georgia 3D Holographic Display and Services Market Revenues & Volume, By Automotive, 2022-2032F |
6.1.7 Georgia 3D Holographic Display and Services Market Revenues & Volume, By Retail, 2022-2032F |
6.1.8 Georgia 3D Holographic Display and Services Market Revenues & Volume, By Others, 2022-2032F |
7 Georgia 3D Holographic Display and Services Market Import-Export Trade Statistics |
7.1 Georgia 3D Holographic Display and Services Market Export to Major Countries |
7.2 Georgia 3D Holographic Display and Services Market Imports from Major Countries |
8 Georgia 3D Holographic Display and Services Market Key Performance Indicators |
9 Georgia 3D Holographic Display and Services Market - Opportunity Assessment |
9.1 Georgia 3D Holographic Display and Services Market Opportunity Assessment, By End-users, 2022 & 2032F |
10 Georgia 3D Holographic Display and Services Market - Competitive Landscape |
10.1 Georgia 3D Holographic Display and Services Market Revenue Share, By Companies, 2025 |
10.2 Georgia 3D Holographic Display and Services Market Competitive Benchmarking, By Operating and Technical Parameters |
11 Company Profiles |
12 Recommendations |
13 Disclaimer |
Global Go To Market Strategy - 2030
Export potential enables firms to identify high-growth global markets with greater confidence by combining advanced trade intelligence with a structured quantitative methodology. The framework analyzes emerging demand trends and country-level import patterns while integrating macroeconomic and trade datasets such as GDP and population forecasts, bilateral import–export flows, tariff structures, elasticity differentials between developed and developing economies, geographic distance, and import demand projections. Using weighted trade values from 2020–2024 as the base period to project country-to-country export potential for 2030, these inputs are operationalized through calculated drivers such as gravity model parameters, tariff impact factors, and projected GDP per-capita growth. Through an analysis of hidden potentials, demand hotspots, and market conditions that are most favorable to success, this method enables firms to focus on target countries, maximize returns, and global expansion with data, backed by accuracy.
By factoring in the projected importer demand gap that is currently unmet and could be potential opportunity, it identifies the potential for the Exporter (Country) among 190 countries, against the general trade analysis, which identifies the biggest importer or exporter.
To discover high-growth global markets and optimize your business strategy:
Click Here
Pricing
- Single User License$ 1,995
- Department License$ 2,400
- Site License$ 3,120
- Global License$ 3,795

Leadership Perspectives from Industry Events
Search
Thought Leadership and Analyst Meet


Our Clients
6WResearch In News
- India Air Conditioner Market Set for Strong Rebound in 2026 After Weather-Led Correction and GST-Driven Recovery: 6Wresearch
- ADAS in India: How Automatic Emergency Braking, Blind Spot Detection & Driver Monitoring are Transforming Road Safety
- Doha a strategic location for EV manufacturing hub: IPA Qatar
- Demand for luxury TVs surging in the GCC, says Samsung
- Empowering Growth: The Thriving Journey of Bangladesh’s Cable Industry
- Demand for luxury TVs surging in the GCC, says Samsung
Latest Reports
- Nicaragua RPG Gaming Market (2026-2032)
- New Zealand RPG Gaming Market (2026-2032)
- Netherlands RPG Gaming Market (2026-2032)
- Nauru RPG Gaming Market (2026-2032)
- Namibia RPG Gaming Market (2026-2032)
- Mozambique RPG Gaming Market (2026-2032)
- Montenegro RPG Gaming Market (2026-2032)
- Mongolia RPG Gaming Market (2026-2032)
- Monaco RPG Gaming Market (2026-2032)
- Micronesia RPG Gaming Market (2026-2032)
Industry Events and Analyst Meet

EV India Expo 2026

HIMTEX 2026

India Refining Summit 2026

India EV Show 2026

EV tech India Expo 2026
Whitepaper
- Middle East & Africa Commercial Security Market Click here to view more.
- Middle East & Africa Fire Safety Systems & Equipment Market Click here to view more.
- GCC Drone Market Click here to view more.
- Middle East Lighting Fixture Market Click here to view more.
- GCC Physical & Perimeter Security Market Click here to view more.