Georgia Biotechnology Reagents & Kits Market (2026-2032) Outlook | Size, Industry, Value, Share, Companies, Trends, Analysis, Growth, Revenue & Forecast
Market Forecast By Kit Type (Purification Kits, Amplification Kits, Detection Kits, Isolation Kits, Others), By Technology (LAMP Technology, PCR, Cell Culture, Sequencing, Chromatography, Electrophoresis, Flow Cytometry, Other Technologies), By Tested Parameters Outlook (Revenue, USD Billion, 2017 - 2028) (DNA, RNA, Enzymes, Proteins, Others), By Micro-Organisms (Bacteria, Virus, Fungi, Parasites) And Competitive Landscape
| Product Code: ETC419036 | Publication Date: Oct 2022 | Updated Date: Jul 2026 | Product Type: Market Research Report | |
| Publisher: 6Wresearch | Author: Shubham Padhi | No. of Pages: 75 | No. of Figures: 35 | No. of Tables: 20 |
Georgia Biotechnology Reagents & Kits Market Size, Share & Growth Rate
The Georgia Biotechnology Reagents & Kits Market was estimated at USD 470 Million in 2025 and is projected to reach USD 658 Million by 2032, growing at a CAGR of 4.9% from 2026 to 2032. This growth trajectory reflects the increasing investments in biotechnology research, driven by both academic institutions and commercial enterprises in the region. As personalized medicine and genomics become focal points in healthcare, the demand for advanced reagents and kits is anticipated to surge, bolstering market expansion.
Georgia Biotechnology Reagents & Kits Market Year-wise Growth Rate and Key Drivers
This graph highlights how the Georgia Biotechnology Reagents & Kits Market has steadily grown over the years, supported by major growth factors.
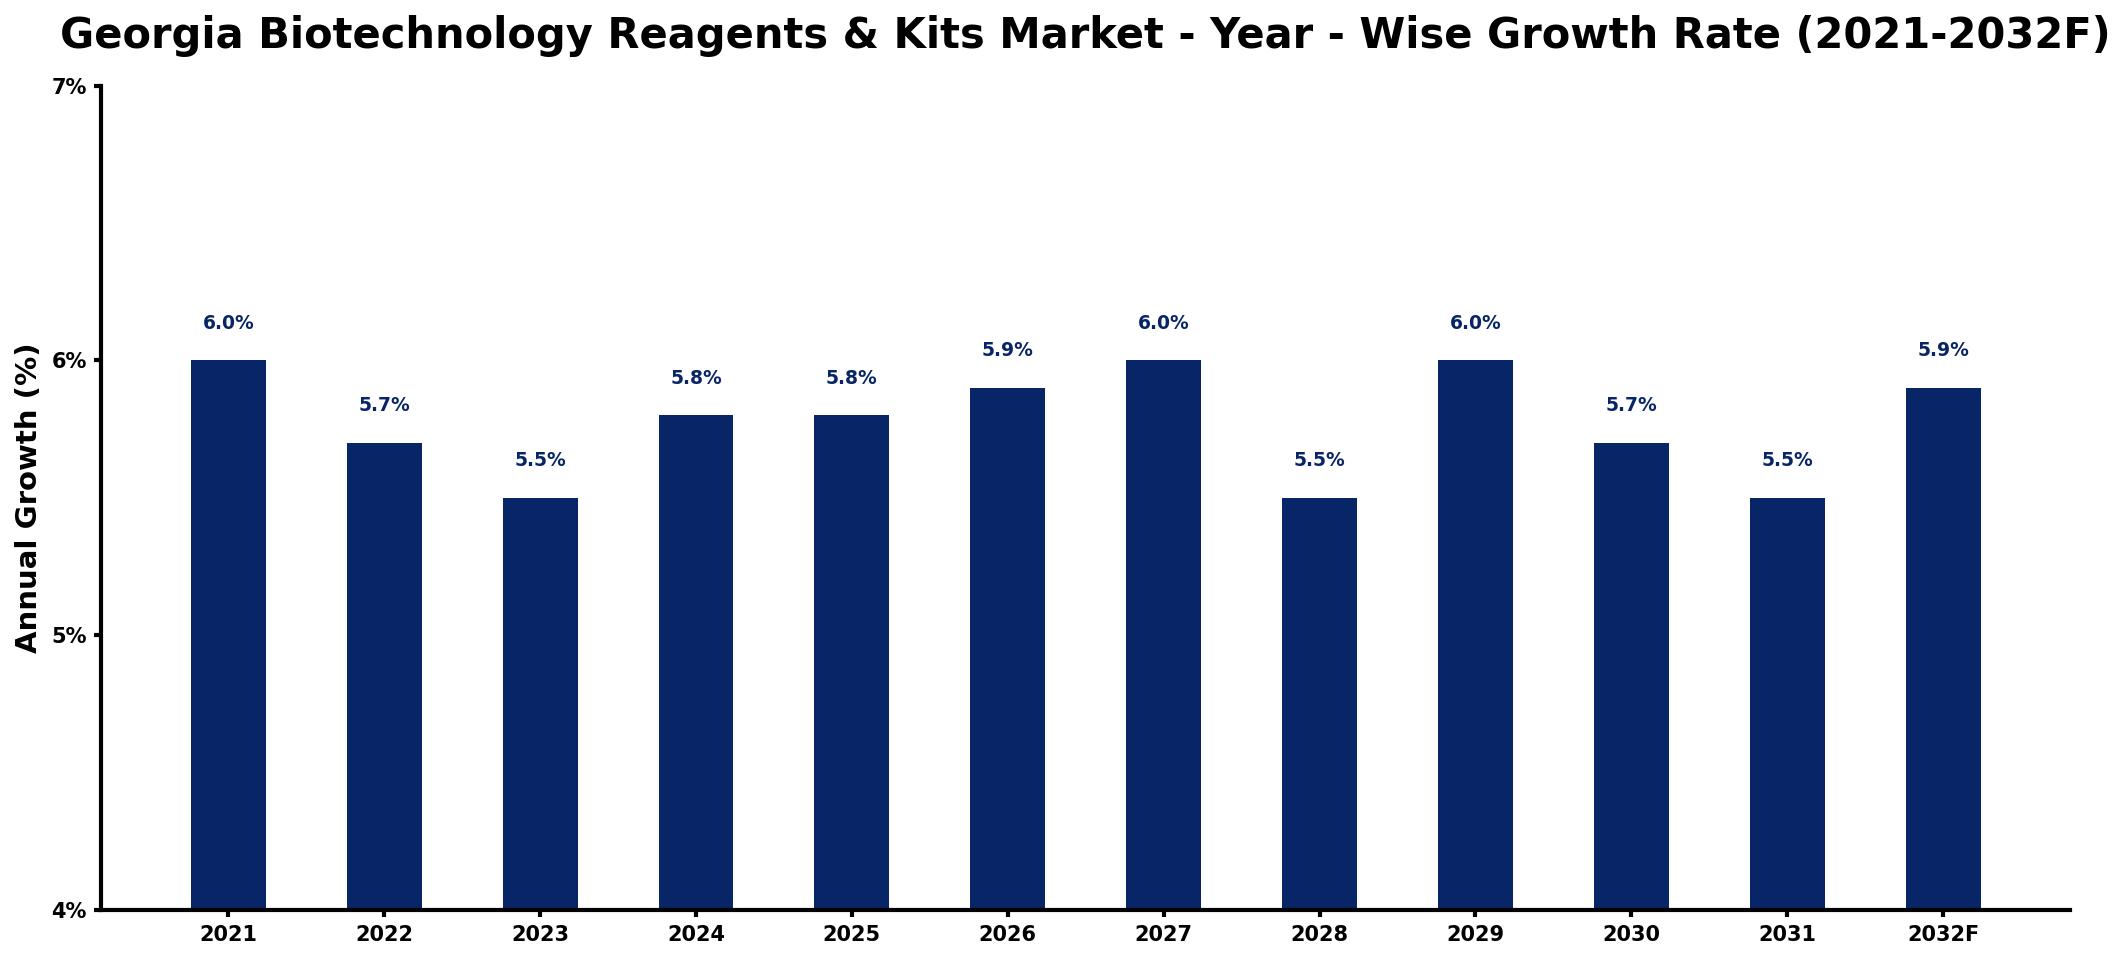
The table below presents the year‑wise growth rates along with the key drivers influencing the market
| Year | Growth Rate | Major Drivers |
| 2021 | 6.0% | Rising demand for clinical diagnostics |
| 2022 | 5.7% | Increased funding for research initiatives |
| 2023 | 5.5% | Expansion of agricultural applications |
| 2024 | 5.8% | Growth in personalized medicine sector |
| 2025 | 5.8% | Surge in academic research projects |
| 2026 | 5.9% | Advancements in molecular biology techniques |
| 2027 | 6.0% | Higher investments in healthcare infrastructure |
| 2028 | 5.5% | Emergence of new therapeutic areas |
| 2029 | 6.0% | Strengthened global supply chains |
| 2030 | 5.7% | Growing focus on environmental sustainability |
| 2031 | 5.5% | Innovations in drug discovery processes |
| 2032 | 5.9% | Enhanced collaboration among research institutions |
Note: Market size estimations and growth projections presented in this report are based on 6Wresearch's proprietary forecasting methodology, utilizing the latest available industry data, government publications, and primary research inputs.
Georgia Biotechnology Reagents & Kits Market Synopsis
The demand for specialized reagents and kits in Georgias biotechnology sector is primarily fueled by the rising need for precision medicine solutions. This trend has prompted local companies to innovate and develop products tailored to specific research needs, enhancing their market competitiveness.
In addition to local supply efforts, Georgia's robust academic and healthcare institutions are instrumental in driving market growth. Their collaborative initiatives with biotech firms amplify research and development, fostering an environment ripe for innovation and product diversification.
- Growing focus on personalized medicine is increasing demand for specialized reagents and kits.
- Significant collaborations between academic institutions and biotech companies are enhancing research capabilities.
- The market is characterized by robust competition, driving innovation and product development.
- Investment in life sciences is on the rise, fueling advancements in genomics and proteomics.
- Government initiatives are creating a supportive environment for biotechnology firms in Georgia.
Despite its promising outlook, the Georgia Biotechnology Reagents & Kits Market faces several restraints. Increased competition from multinational companies poses a challenge for local suppliers, which may struggle with product innovation and pricing. Additionally, stringent regulatory requirements can hinder timely market entry for new products, while limited funding opportunities for smaller biotech firms may restrict their growth potential. Addressing these barriers will require strategic collaboration and focused efforts on innovation.
Several trends are shaping the Georgia Biotechnology Reagents & Kits Market. The rise of advanced molecular biology techniques, including PCR and next-generation sequencing, is enhancing research capabilities across various applications. Additionally, there is a growing emphasis on developing customized reagents to meet specific research needs, pushing companies to innovate continuously. The focus on sustainable practices within biotechnology is also gaining momentum, leading to the development of eco-friendly reagents and kits.
The market presents significant investment opportunities, especially for firms specializing in high-quality reagents for genomics, proteomics, and cell biology. Strategic partnerships with local biotech startups can provide larger companies with expanded product offerings and innovative solutions. Furthermore, as academic institutions ramp up their research initiatives, companies that align their product development with these needs will likely see substantial growth.
Georgia's government plays a critical role in fostering the biotechnology sector through various initiatives. Policies aimed at promoting innovation and R&D include tax incentives for biotech companies and funding programs for research projects. Additionally, initiatives focusing on workforce training help cultivate a skilled labor pool, supporting the sector's growth and enhancing its competitiveness.
Looking ahead to 2026-2032, the Georgia Biotechnology Reagents & Kits Market is expected to flourish due to increasing R&D activities and the escalating demand for personalized medicine solutions. The synergy between established biotechnology companies and academic research institutions will foster innovation, paving the way for new products and applications. As technology evolves, the focus on developing cutting-edge reagents and kits will remain a priority, driving sustained growth in this vibrant market.
In recent months, the Georgia Biotechnology Reagents & Kits Market has witnessed a wave of innovative developments aimed at enhancing research capabilities. Efforts to streamline product approvals and regulatory compliance are gaining traction, fostering a more conducive environment for market entrants. Collaborative research projects between universities and biotech firms are also intensifying, leading to the introduction of novel reagents and kits tailored for specific research applications.
- 10 Years of Market Numbers
- Historical Data Starting from 2022 to 2025
- Base Year: 2025
- Forecast Data until 2032
- Key Performance Indicators Impacting the Market
- Major Upcoming Developments and Projects
Key Highlights of the Report:
- Georgia Biotechnology Reagents & Kits Market Outlook
- Market Size of Georgia Biotechnology Reagents & Kits Market, 2025
- Forecast of Georgia Biotechnology Reagents & Kits Market, 2032
- Historical Data and Forecast of Georgia Biotechnology Reagents & Kits Revenues & Volume for the Period 2022-2032F
- Georgia Biotechnology Reagents & Kits Market Trend Evolution
- Georgia Biotechnology Reagents & Kits Market Drivers and Challenges
- Georgia Biotechnology Reagents & Kits Price Trends
- Georgia Biotechnology Reagents & Kits Porter's Five Forces
- Georgia Biotechnology Reagents & Kits Industry Life Cycle
- Historical Data and Forecast of Georgia Biotechnology Reagents & Kits Market Revenues & Volume By Kit Type for the Period 2022-2032F
- Historical Data and Forecast of Georgia Biotechnology Reagents & Kits Market Revenues & Volume By Purification Kits for the Period 2022-2032F
- Historical Data and Forecast of Georgia Biotechnology Reagents & Kits Market Revenues & Volume By Amplification Kits for the Period 2022-2032F
- Historical Data and Forecast of Georgia Biotechnology Reagents & Kits Market Revenues & Volume By Detection Kits for the Period 2022-2032F
- Historical Data and Forecast of Georgia Biotechnology Reagents & Kits Market Revenues & Volume By Isolation Kits for the Period 2022-2032F
- Historical Data and Forecast of Georgia Biotechnology Reagents & Kits Market Revenues & Volume By Others for the Period 2022-2032F
- Historical Data and Forecast of Georgia Biotechnology Reagents & Kits Market Revenues & Volume By Technology for the Period 2022-2032F
- Historical Data and Forecast of Georgia Biotechnology Reagents & Kits Market Revenues & Volume By LAMP Technology for the Period 2022-2032F
- Historical Data and Forecast of Georgia Biotechnology Reagents & Kits Market Revenues & Volume By PCR for the Period 2022-2032F
- Historical Data and Forecast of Georgia Biotechnology Reagents & Kits Market Revenues & Volume By Cell Culture for the Period 2022-2032F
- Historical Data and Forecast of Georgia Biotechnology Reagents & Kits Market Revenues & Volume By Sequencing for the Period 2022-2032F
- Historical Data and Forecast of Georgia Biotechnology Reagents & Kits Market Revenues & Volume By Chromatography for the Period 2022-2032F
- Historical Data and Forecast of Georgia Biotechnology Reagents & Kits Market Revenues & Volume By Electrophoresis for the Period 2022-2032F
- Historical Data and Forecast of Georgia Biotechnology Reagents & Kits Market Revenues & Volume By Flow Cytometry for the Period 2022-2032F
- Historical Data and Forecast of Georgia Biotechnology Reagents & Kits Market Revenues & Volume By Other Technologies for the Period 2022-2032F
- Historical Data and Forecast of Georgia Biotechnology Reagents & Kits Market Revenues & Volume By Tested Parameters Outlook (Revenue, USD Billion, 2022-2032F) for the Period 2022-2032F
- Historical Data and Forecast of Georgia Biotechnology Reagents & Kits Market Revenues & Volume By DNA for the Period 2022-2032F
- Historical Data and Forecast of Georgia Biotechnology Reagents & Kits Market Revenues & Volume By RNA for the Period 2022-2032F
- Historical Data and Forecast of Georgia Biotechnology Reagents & Kits Market Revenues & Volume By Enzymes for the Period 2022-2032F
- Historical Data and Forecast of Georgia Biotechnology Reagents & Kits Market Revenues & Volume By Proteins for the Period 2022-2032F
- Historical Data and Forecast of Georgia Biotechnology Reagents & Kits Market Revenues & Volume By Others for the Period 2022-2032F
- Historical Data and Forecast of Georgia Biotechnology Reagents & Kits Market Revenues & Volume By Micro-Organisms for the Period 2022-2032F
- Historical Data and Forecast of Georgia Biotechnology Reagents & Kits Market Revenues & Volume By Bacteria for the Period 2022-2032F
- Historical Data and Forecast of Georgia Biotechnology Reagents & Kits Market Revenues & Volume By Virus for the Period 2022-2032F
- Historical Data and Forecast of Georgia Biotechnology Reagents & Kits Market Revenues & Volume By Fungi for the Period 2022-2032F
- Historical Data and Forecast of Georgia Biotechnology Reagents & Kits Market Revenues & Volume By Parasites for the Period 2022-2032F
- Georgia Biotechnology Reagents & Kits Import Export Trade Statistics
- Market Opportunity Assessment By Kit Type
- Market Opportunity Assessment By Technology
- Market Opportunity Assessment By Tested Parameters Outlook (Revenue, USD Billion, 2022-2032F)
- Market Opportunity Assessment By Micro-Organisms
- Georgia Biotechnology Reagents & Kits Top Companies Market Share
- Georgia Biotechnology Reagents & Kits Competitive Benchmarking By Technical and Operational Parameters
- Georgia Biotechnology Reagents & Kits Company Profiles
- Georgia Biotechnology Reagents & Kits Key Strategic Recommendations
Frequently Asked Questions About the Market Study (FAQs):
The market's growth is propelled by advancements in biotechnology, increasing demand for personalized medicine, and enhanced R&D activities from both academic institutions and biotech companies.
The market was estimated at USD 470 Million in 2025 and is projected to reach USD 658 Million by 2032, growing at a CAGR of 4.9% from 2026 to 2032.
Local companies often struggle against the competition posed by established multinational corporations, particularly in terms of innovation, quality, and pricing strategies.
There is a notable demand for specialized products, particularly antibodies, nucleic acid purification kits, and reagents for protein analysis, all essential for advancing precision medicine.
The regulatory landscape plays a crucial role, as compliance requirements can impact the speed of product approvals and market entry, presenting challenges for new entrants.
6Wresearch actively monitors the Georgia Biotechnology Reagents & Kits Market and publishes its comprehensive annual report, highlighting emerging trends, growth drivers, revenue analysis, and forecast outlook. Our insights help businesses to make data-backed strategic decisions with ongoing market dynamics. Our analysts track relevent industries related to the Georgia Biotechnology Reagents & Kits Market, allowing our clients with actionable intelligence and reliable forecasts tailored to emerging regional needs.
Yes, we provide customisation as per your requirements. To learn more, feel free to contact us on sales@6wresearch.com
1 Executive Summary |
2 Introduction |
2.1 Key Highlights of the Report |
2.2 Report Description |
2.3 Market Scope & Segmentation |
2.4 Research Methodology |
2.5 Assumptions |
3 Georgia Biotechnology Reagents & Kits Market Overview |
3.1 Georgia Country Macro Economic Indicators |
3.2 Georgia Biotechnology Reagents & Kits Market Revenues & Volume, 2022 & 2032F |
3.3 Georgia Biotechnology Reagents & Kits Market - Industry Life Cycle |
3.4 Georgia Biotechnology Reagents & Kits Market - Porter's Five Forces |
3.5 Georgia Biotechnology Reagents & Kits Market Revenues & Volume Share, By Kit Type, 2022 & 2032F |
3.6 Georgia Biotechnology Reagents & Kits Market Revenues & Volume Share, By Technology, 2022 & 2032F |
3.7 Georgia Biotechnology Reagents & Kits Market Revenues & Volume Share, By Tested Parameters Outlook (Revenue, USD Billion, 2022-2032F), 2022 & 2032F |
3.8 Georgia Biotechnology Reagents & Kits Market Revenues & Volume Share, By Micro-Organisms, 2022 & 2032F |
4 Georgia Biotechnology Reagents & Kits Market Dynamics |
4.1 Impact Analysis |
4.2 Market Drivers |
4.2.1 Increasing adoption of precision medicine and personalized healthcare |
4.2.2 Growing demand for biotechnology research and development |
4.2.3 Technological advancements in biotechnology reagents and kits |
4.3 Market Restraints |
4.3.1 Stringent regulations and compliance requirements |
4.3.2 High cost associated with biotechnology reagents and kits |
4.3.3 Limited availability of skilled professionals in the biotechnology sector |
5 Georgia Biotechnology Reagents & Kits Market Trends |
6 Georgia Biotechnology Reagents & Kits Market, By Types |
6.1 Georgia Biotechnology Reagents & Kits Market, By Kit Type |
6.1.1 Overview and Analysis |
6.1.2 Georgia Biotechnology Reagents & Kits Market Revenues & Volume, By Kit Type, 2022-2032F |
6.1.3 Georgia Biotechnology Reagents & Kits Market Revenues & Volume, By Purification Kits, 2022-2032F |
6.1.4 Georgia Biotechnology Reagents & Kits Market Revenues & Volume, By Amplification Kits, 2022-2032F |
6.1.5 Georgia Biotechnology Reagents & Kits Market Revenues & Volume, By Detection Kits, 2022-2032F |
6.1.6 Georgia Biotechnology Reagents & Kits Market Revenues & Volume, By Isolation Kits, 2022-2032F |
6.1.7 Georgia Biotechnology Reagents & Kits Market Revenues & Volume, By Others, 2022-2032F |
6.2 Georgia Biotechnology Reagents & Kits Market, By Technology |
6.2.1 Overview and Analysis |
6.2.2 Georgia Biotechnology Reagents & Kits Market Revenues & Volume, By LAMP Technology, 2022-2032F |
6.2.3 Georgia Biotechnology Reagents & Kits Market Revenues & Volume, By PCR, 2022-2032F |
6.2.4 Georgia Biotechnology Reagents & Kits Market Revenues & Volume, By Cell Culture, 2022-2032F |
6.2.5 Georgia Biotechnology Reagents & Kits Market Revenues & Volume, By Sequencing, 2022-2032F |
6.2.6 Georgia Biotechnology Reagents & Kits Market Revenues & Volume, By Chromatography, 2022-2032F |
6.2.7 Georgia Biotechnology Reagents & Kits Market Revenues & Volume, By Electrophoresis, 2022-2032F |
6.2.8 Georgia Biotechnology Reagents & Kits Market Revenues & Volume, By Other Technologies, 2022-2032F |
6.2.9 Georgia Biotechnology Reagents & Kits Market Revenues & Volume, By Other Technologies, 2022-2032F |
6.3 Georgia Biotechnology Reagents & Kits Market, By Tested Parameters Outlook (Revenue, USD Billion, 2022-2032F) |
6.3.1 Overview and Analysis |
6.3.2 Georgia Biotechnology Reagents & Kits Market Revenues & Volume, By DNA, 2022-2032F |
6.3.3 Georgia Biotechnology Reagents & Kits Market Revenues & Volume, By RNA, 2022-2032F |
6.3.4 Georgia Biotechnology Reagents & Kits Market Revenues & Volume, By Enzymes, 2022-2032F |
6.3.5 Georgia Biotechnology Reagents & Kits Market Revenues & Volume, By Proteins, 2022-2032F |
6.3.6 Georgia Biotechnology Reagents & Kits Market Revenues & Volume, By Others, 2022-2032F |
6.4 Georgia Biotechnology Reagents & Kits Market, By Micro-Organisms |
6.4.1 Overview and Analysis |
6.4.2 Georgia Biotechnology Reagents & Kits Market Revenues & Volume, By Bacteria, 2022-2032F |
6.4.3 Georgia Biotechnology Reagents & Kits Market Revenues & Volume, By Virus, 2022-2032F |
6.4.4 Georgia Biotechnology Reagents & Kits Market Revenues & Volume, By Fungi, 2022-2032F |
6.4.5 Georgia Biotechnology Reagents & Kits Market Revenues & Volume, By Parasites, 2022-2032F |
7 Georgia Biotechnology Reagents & Kits Market Import-Export Trade Statistics |
7.1 Georgia Biotechnology Reagents & Kits Market Export to Major Countries |
7.2 Georgia Biotechnology Reagents & Kits Market Imports from Major Countries |
8 Georgia Biotechnology Reagents & Kits Market Key Performance Indicators |
8.1 Research and development investment in biotechnology sector |
8.2 Number of patents filed for new biotechnology reagents and kits |
8.3 Adoption rate of advanced biotechnology tools and techniques |
8.4 Number of collaborations and partnerships in the biotechnology industry |
8.5 Rate of adoption of biotechnology products in healthcare and research institutions |
9 Georgia Biotechnology Reagents & Kits Market - Opportunity Assessment |
9.1 Georgia Biotechnology Reagents & Kits Market Opportunity Assessment, By Kit Type, 2022 & 2032F |
9.2 Georgia Biotechnology Reagents & Kits Market Opportunity Assessment, By Technology, 2022 & 2032F |
9.3 Georgia Biotechnology Reagents & Kits Market Opportunity Assessment, By Tested Parameters Outlook (Revenue, USD Billion, 2022-2032F), 2022 & 2032F |
9.4 Georgia Biotechnology Reagents & Kits Market Opportunity Assessment, By Micro-Organisms, 2022 & 2032F |
10 Georgia Biotechnology Reagents & Kits Market - Competitive Landscape |
10.1 Georgia Biotechnology Reagents & Kits Market Revenue Share, By Companies, 2025 |
10.2 Georgia Biotechnology Reagents & Kits Market Competitive Benchmarking, By Operating and Technical Parameters |
11 Company Profiles |
12 Recommendations |
13 Disclaimer |
Global Go To Market Strategy - 2030
Export potential enables firms to identify high-growth global markets with greater confidence by combining advanced trade intelligence with a structured quantitative methodology. The framework analyzes emerging demand trends and country-level import patterns while integrating macroeconomic and trade datasets such as GDP and population forecasts, bilateral import–export flows, tariff structures, elasticity differentials between developed and developing economies, geographic distance, and import demand projections. Using weighted trade values from 2020–2024 as the base period to project country-to-country export potential for 2030, these inputs are operationalized through calculated drivers such as gravity model parameters, tariff impact factors, and projected GDP per-capita growth. Through an analysis of hidden potentials, demand hotspots, and market conditions that are most favorable to success, this method enables firms to focus on target countries, maximize returns, and global expansion with data, backed by accuracy.
By factoring in the projected importer demand gap that is currently unmet and could be potential opportunity, it identifies the potential for the Exporter (Country) among 190 countries, against the general trade analysis, which identifies the biggest importer or exporter.
To discover high-growth global markets and optimize your business strategy:
Click Here
Pricing
- Single User License$ 1,995
- Department License$ 2,400
- Site License$ 3,120
- Global License$ 3,795

Leadership Perspectives from Industry Events
Search
Thought Leadership and Analyst Meet


Our Clients
6WResearch In News
- India Air Conditioner Market Set for Strong Rebound in 2026 After Weather-Led Correction and GST-Driven Recovery: 6Wresearch
- ADAS in India: How Automatic Emergency Braking, Blind Spot Detection & Driver Monitoring are Transforming Road Safety
- Doha a strategic location for EV manufacturing hub: IPA Qatar
- Demand for luxury TVs surging in the GCC, says Samsung
- Empowering Growth: The Thriving Journey of Bangladesh’s Cable Industry
- Demand for luxury TVs surging in the GCC, says Samsung
Latest Reports
- Nicaragua RPG Gaming Market (2026-2032)
- New Zealand RPG Gaming Market (2026-2032)
- Netherlands RPG Gaming Market (2026-2032)
- Nauru RPG Gaming Market (2026-2032)
- Namibia RPG Gaming Market (2026-2032)
- Mozambique RPG Gaming Market (2026-2032)
- Montenegro RPG Gaming Market (2026-2032)
- Mongolia RPG Gaming Market (2026-2032)
- Monaco RPG Gaming Market (2026-2032)
- Micronesia RPG Gaming Market (2026-2032)
Industry Events and Analyst Meet

EV India Expo 2026

HIMTEX 2026

India Refining Summit 2026

India EV Show 2026

EV tech India Expo 2026
Whitepaper
- Middle East & Africa Commercial Security Market Click here to view more.
- Middle East & Africa Fire Safety Systems & Equipment Market Click here to view more.
- GCC Drone Market Click here to view more.
- Middle East Lighting Fixture Market Click here to view more.
- GCC Physical & Perimeter Security Market Click here to view more.