Georgia Citrus Bioflavonoids Market (2026-2032) Outlook | Revenue, Analysis, Forecast, Growth, Share, Size, Industry, Trends, Companies & Value
Market Forecast By Type (Tengeretin, Hesperidin, Nobiletin, Rutin, Quercetin, Diosmin, Naringin, other), By End-users (Pharmaceutical and Functional Foods, Dietary Supplements, Food and Beverages, Cosmetics and Personal Care, Animal Feed), By Distribution Channel (Online Retail, Herbal Specialty Store, Retail, Supermarket) And Competitive Landscape
| Product Code: ETC106699 | Publication Date: Jun 2021 | Updated Date: Jun 2026 | Product Type: Report | |
| Publisher: 6Wresearch | Author: Vasudha | No. of Pages: 70 | No. of Figures: 35 | No. of Tables: 5 |
Georgia Citrus Bioflavonoids Market Size, Share & Growth Rate
The Georgia Citrus Bioflavonoids Market was estimated at USD 178 Million in 2025 and is projected to reach USD 194 Million by 2032, growing at a CAGR of 1.2% from 2026 to 2032. This growth trajectory is driven by increasing consumer awareness surrounding the health benefits of bioflavonoids, particularly their antioxidant properties. Furthermore, the rising demand for natural and plant-based ingredients in health and wellness products is further propelling market expansion in Georgia.
Georgia Citrus Bioflavonoids Market Growth Rate Analysis (2021-2032)
The Georgia Citrus Bioflavonoids market has shown a remarkable recovery following a decline of 3.8% in 2021. The growth rebounded with 5.4% in 2022, attributed to heightened consumer awareness surrounding health benefits and increased adoption of natural supplements. This trend continued with a stable 5.2% growth in 2023, reflecting rising investments in agricultural technologies and enhanced supply chain infrastructures. A modest slowdown is anticipated in 2024, with projected growth at 0.3%, as market saturation begins to surface. However, from 2025 onwards, gradual increases are expected, driven by ongoing consumer demand and the expansion of plant-based formulations, collectively leading to a long-term upward trend through 2032.
Georgia Citrus Bioflavonoids Market Year-wise Growth Rate and Key Drivers
This graph highlights how the Georgia Citrus Bioflavonoids Market has steadily grown over the past five years, supported by major growth factors.
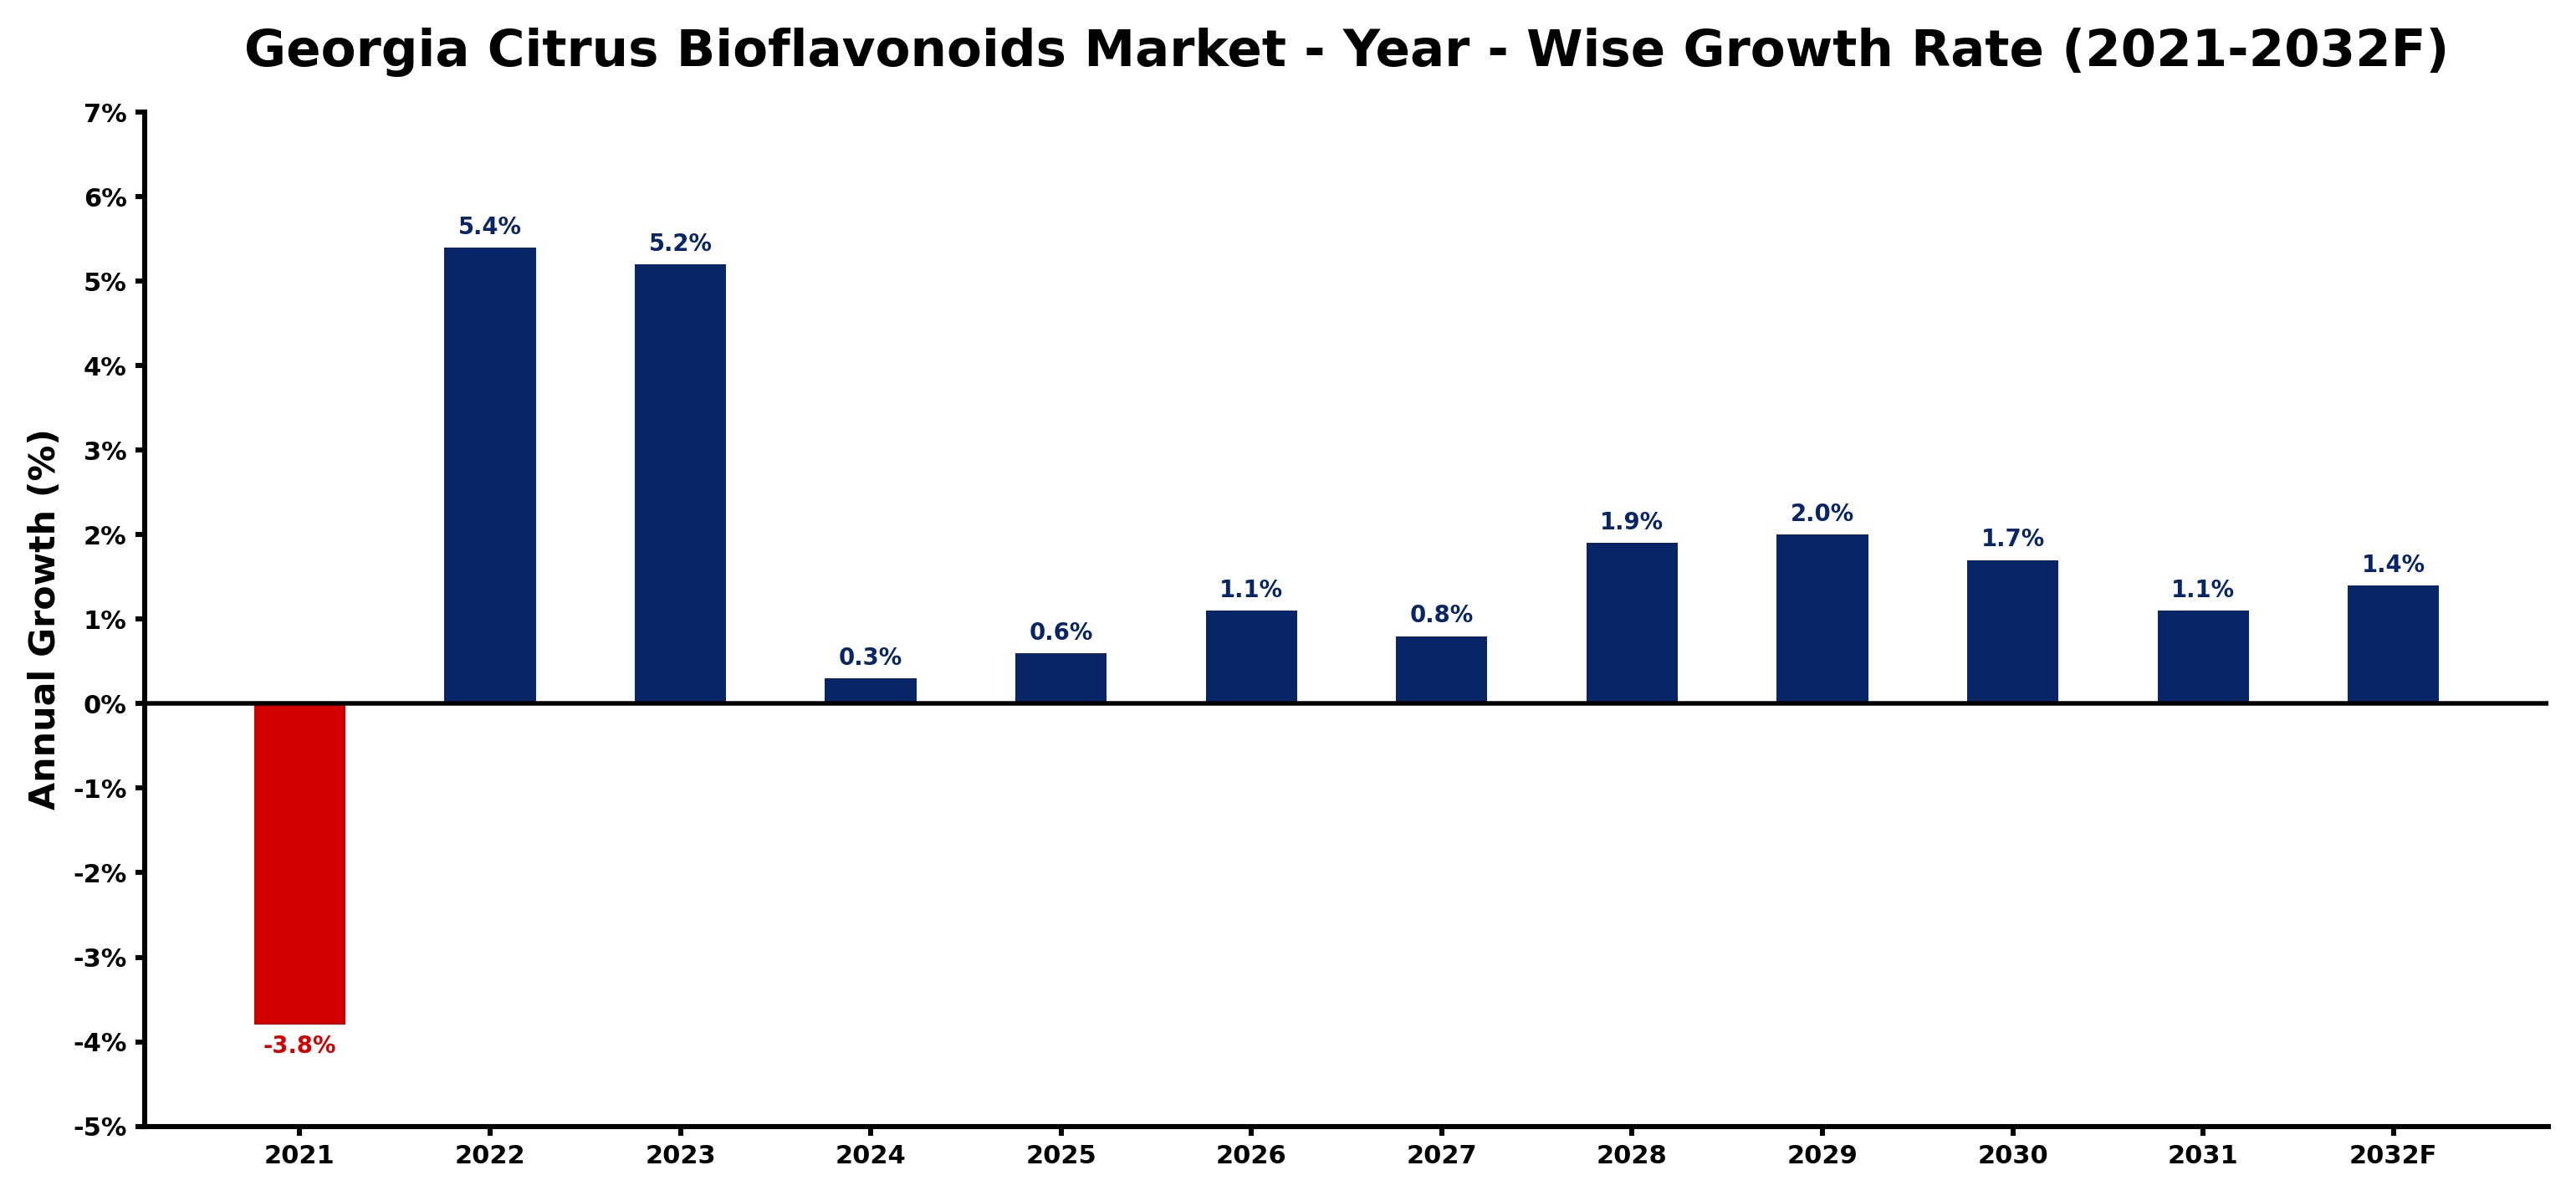
The table below presents the year‑wise growth rates along with the key drivers influencing the market
| Year | Growth Rate | Major Drivers |
| 2021 | -3.8% | Expansion of commercial construction activities |
| 2022 | 5.4% | Expansion of commercial construction activities |
| 2023 | 5.2% | Increasing industrial automation investments |
| 2024 | 0.3% | Expansion of commercial construction activities |
| 2025 | 0.6% | Growing urbanization and commercial development |
| 2026 | 1.1% | Increasing smart city development projects |
| 2027 | 0.8% | Expansion of manufacturing activities |
| 2028 | 1.9% | Growing urbanization and commercial development |
| 2029 | 2.0% | Increasing smart city development projects |
| 2030 | 1.7% | Growing urbanization and commercial development |
| 2031 | 1.1% | Growing renewable energy integration projects |
| 2032 | 1.4% | Increasing industrial infrastructure investments |
Note - Market size estimations and growth projections presented in this report are based on 6Wresearch’s advanced forecasting approach, validated with industry datasets as of June 2026.
Georgia Citrus Bioflavonoids Market Synopsis
In recent years, the Georgia Citrus Bioflavonoids Market has gained considerable momentum, with consumers increasingly seeking natural health solutions. However, as consumer preferences evolve, the market is expected to transform, focusing more on sustainable practices and innovative extraction methods. This shift will likely be shaped by heightened demand for transparency and quality in sourcing.
Moreover, as research expands into new applications and the potential benefits of citrus bioflavonoids, the market stands to experience even further growth. With a strong emphasis on preventative healthcare and clean label products, the future looks bright for this sector in Georgia.
Georgia Citrus Bioflavonoids Market Key Takeaways
- The market is experiencing steady growth due to rising consumer demand for natural health products.
- Health benefits associated with bioflavonoids are increasingly recognized in dietary supplements and cosmetics.
- Georgia's climate provides a competitive advantage for local citrus cultivation.
- Investment in R&D for innovative applications of bioflavonoids is on the rise.
- Consumers show a strong preference for sustainably sourced ingredients.
Evaluation of Restraints in Georgia Citrus Bioflavonoids Market
Despite the promising outlook, several restraints impact the Georgia Citrus Bioflavonoids Market. Unpredictable weather patterns pose significant risks to citrus crop yields, leading to fluctuations in supply and pricing. This vulnerability is exacerbated by climate variability, which affects the quality and quantity of citrus production. Furthermore, competition from imported bioflavonoids from regions with more favorable climates presents a challenge for local producers, necessitating agility and innovation to maintain market share.
Georgia Citrus Bioflavonoids Market Trends
A notable trend in the Georgia Citrus Bioflavonoids Market is the rising consumer shift toward products boasting natural ingredients and transparency in sourcing. As awareness of bioflavonoids' health benefits continues to grow, products incorporating these compounds are becoming more prevalent in health supplements, functional foods, and skincare items. Additionally, a movement towards sustainable practices in cultivation and extraction is becoming a critical differentiator for brands.
Georgia Citrus Bioflavonoids Market Opportunities
Investment opportunities abound in the Georgia Citrus Bioflavonoids Market as consumer preference shifts toward natural health solutions. By focusing on local sourcing, companies can leverage the favorable climate for citrus cultivation in Georgia to ensure high-quality raw materials. Collaborations with local farms to develop extraction facilities can help create a more efficient supply chain, ultimately enhancing product offerings and driving profitability.
Government Initiatives in the Georgia Citrus Bioflavonoids Market
Government policies governing the Georgia Citrus Bioflavonoids Market emphasize sustainable farming practices and adherence to quality standards. The Georgia Department of Agriculture plays a crucial role in regulating the production and distribution of citrus bioflavonoids, focusing on food safety and supporting local agricultural initiatives. Additionally, policies pertaining to trade agreements may influence the import and export dynamics of citrus bioflavonoids.
Future Insights of the Georgia Citrus Bioflavonoids Market
Looking ahead to 2026-2032, the Georgia Citrus Bioflavonoids Market is poised for significant growth fueled by an increasing focus on health and wellness. As consumer preferences lean towards natural and clean label products, the demand for bioflavonoids is expected to surge. Innovations in extraction methods and ongoing research into the benefits of these compounds will likely bolster market expansion, positioning Georgia as a key player in the citrus bioflavonoid space.
Georgia Citrus Bioflavonoids Market Latest Developments (May 2025 - June 2026)
Recent developments in the Georgia Citrus Bioflavonoids Market indicate a growing emphasis on research collaborations aimed at enhancing extraction techniques. Industry players are investing in sustainable farming practices while exploring new applications for bioflavonoids in various health and beauty products. Additionally, awareness campaigns are being launched to educate consumers about the benefits of incorporating citrus bioflavonoids into their daily routines.
Georgia Citrus Bioflavonoids Market - Key Attractiveness of the Report
- 10 Years of Market Numbers
- Historical Data Starting from 2022 to 2025
- Base Year: 2025
- Forecast Data until 2032
- Key Performance Indicators Impacting the Market
- Major Upcoming Developments and Projects
Key Highlights of the Report:
- Georgia Citrus Bioflavonoids Market Outlook
- Market Size of Georgia Citrus Bioflavonoids Market, 2025
- Forecast of Georgia Citrus Bioflavonoids Market, 2032
- Historical Data and Forecast of Georgia Citrus Bioflavonoids Revenues & Volume for the Period 2022-2032F
- Georgia Citrus Bioflavonoids Market Trend Evolution
- Georgia Citrus Bioflavonoids Market Drivers and Challenges
- Georgia Citrus Bioflavonoids Price Trends
- Georgia Citrus Bioflavonoids Porter's Five Forces
- Georgia Citrus Bioflavonoids Industry Life Cycle
- Historical Data and Forecast of Georgia Citrus Bioflavonoids Market Revenues & Volume By Type for the Period 2022-2032F
- Historical Data and Forecast of Georgia Citrus Bioflavonoids Market Revenues & Volume By Tengeretin for the Period 2022-2032F
- Historical Data and Forecast of Georgia Citrus Bioflavonoids Market Revenues & Volume By Hesperidin for the Period 2022-2032F
- Historical Data and Forecast of Georgia Citrus Bioflavonoids Market Revenues & Volume By Nobiletin for the Period 2022-2032F
- Historical Data and Forecast of Georgia Citrus Bioflavonoids Market Revenues & Volume By Rutin for the Period 2022-2032F
- Historical Data and Forecast of Georgia Citrus Bioflavonoids Market Revenues & Volume By Quercetin for the Period 2022-2032F
- Historical Data and Forecast of Georgia Citrus Bioflavonoids Market Revenues & Volume By Diosmin for the Period 2022-2032F
- Historical Data and Forecast of Georgia Citrus Bioflavonoids Market Revenues & Volume By Naringin for the Period 2022-2032F
- Historical Data and Forecast of Georgia Tengeretin Citrus Bioflavonoids Market Revenues & Volume By other for the Period 2022-2032F
- Historical Data and Forecast of Georgia Citrus Bioflavonoids Market Revenues & Volume By End-users for the Period 2022-2032F
- Historical Data and Forecast of Georgia Citrus Bioflavonoids Market Revenues & Volume By Pharmaceutical and Functional Foods for the Period 2022-2032F
- Historical Data and Forecast of Georgia Citrus Bioflavonoids Market Revenues & Volume By Dietary Supplements for the Period 2022-2032F
- Historical Data and Forecast of Georgia Citrus Bioflavonoids Market Revenues & Volume By Food and Beverages for the Period 2022-2032F
- Historical Data and Forecast of Georgia Citrus Bioflavonoids Market Revenues & Volume By Cosmetics and Personal Care for the Period 2022-2032F
- Historical Data and Forecast of Georgia Citrus Bioflavonoids Market Revenues & Volume By Animal Feed for the Period 2022-2032F
- Historical Data and Forecast of Georgia Citrus Bioflavonoids Market Revenues & Volume By Distribution Channel for the Period 2022-2032F
- Historical Data and Forecast of Georgia Citrus Bioflavonoids Market Revenues & Volume By Online Retail for the Period 2022-2032F
- Historical Data and Forecast of Georgia Citrus Bioflavonoids Market Revenues & Volume By Herbal Specialty Store for the Period 2022-2032F
- Historical Data and Forecast of Georgia Citrus Bioflavonoids Market Revenues & Volume By Retail for the Period 2022-2032F
- Historical Data and Forecast of Georgia Citrus Bioflavonoids Market Revenues & Volume By Supermarket for the Period 2022-2032F
- Georgia Citrus Bioflavonoids Import Export Trade Statistics
- Market Opportunity Assessment By Type
- Market Opportunity Assessment By End-users
- Market Opportunity Assessment By Distribution Channel
- Georgia Citrus Bioflavonoids Top Companies Market Share
- Georgia Citrus Bioflavonoids Competitive Benchmarking By Technical and Operational Parameters
- Georgia Citrus Bioflavonoids Company Profiles
- Georgia Citrus Bioflavonoids Key Strategic Recommendations
Georgia Citrus Bioflavonoids Market - Frequently Asked Questions
The market was estimated at USD 178 Million in 2025 and is projected to reach USD 194 Million by 2032, growing at a CAGR of 1.2% from 2026 to 2032.
Consumers are increasingly seeking products with natural ingredients and proven health benefits, driving demand for bioflavonoids in supplements and skincare.
Local sourcing enhances the quality and traceability of bioflavonoids, allowing producers to leverage Georgia's climate advantages for optimal cultivation.
Unpredictable weather patterns and competition from imported bioflavonoids affect local producers, necessitating adaptability and innovation.
Government policies oversee quality standards and sustainable practices in the citrus industry, which are crucial for market growth.
Many manufacturers are investing in R&D to develop eco-friendly extraction methods and promote transparency in their sourcing practices.
6Wresearch actively monitors the Georgia Citrus Bioflavonoids Market and publishes its comprehensive annual report, highlighting emerging trends, growth drivers, revenue analysis, and forecast outlook. Our insights help businesses to make data-backed strategic decisions with ongoing market dynamics. Our analysts track relevent industries related to the Georgia Citrus Bioflavonoids Market, allowing our clients with actionable intelligence and reliable forecasts tailored to emerging regional needs.
Yes, we provide customisation as per your requirements. To learn more, feel free to contact us on sales@6wresearch.com
1 Executive Summary |
2 Introduction |
2.1 Key Highlights of the Report |
2.2 Report Description |
2.3 Market Scope & Segmentation |
2.4 Research Methodology |
2.5 Assumptions |
3 Georgia Citrus Bioflavonoids Market Overview |
3.1 Georgia Country Macro Economic Indicators |
3.2 Georgia Citrus Bioflavonoids Market Revenues & Volume, 2022 & 2032F |
3.3 Georgia Citrus Bioflavonoids Market - Industry Life Cycle |
3.4 Georgia Citrus Bioflavonoids Market - Porter's Five Forces |
3.5 Georgia Citrus Bioflavonoids Market Revenues & Volume Share, By Type, 2022 & 2032F |
3.6 Georgia Citrus Bioflavonoids Market Revenues & Volume Share, By End-users, 2022 & 2032F |
3.7 Georgia Citrus Bioflavonoids Market Revenues & Volume Share, By Distribution Channel, 2022 & 2032F |
4 Georgia Citrus Bioflavonoids Market Dynamics |
4.1 Impact Analysis |
4.2 Market Drivers |
4.2.1 Increasing consumer awareness about the health benefits of bioflavonoids |
4.2.2 Growing demand for natural and plant-based ingredients in the food and beverage industry |
4.2.3 Rising prevalence of chronic diseases driving the demand for functional ingredients like bioflavonoids |
4.3 Market Restraints |
4.3.1 Seasonal fluctuations in citrus production impacting the availability of raw materials |
4.3.2 Price volatility in the citrus market affecting the cost of bioflavonoid production |
4.3.3 Regulatory challenges and stringent quality standards in the bioflavonoids industry |
5 Georgia Citrus Bioflavonoids Market Trends |
6 Georgia Citrus Bioflavonoids Market, By Types |
6.1 Georgia Citrus Bioflavonoids Market, By Type |
6.1.1 Overview and Analysis |
6.1.2 Georgia Citrus Bioflavonoids Market Revenues & Volume, By Type, 2022-2032F |
6.1.3 Georgia Citrus Bioflavonoids Market Revenues & Volume, By Tengeretin, 2022-2032F |
6.1.4 Georgia Citrus Bioflavonoids Market Revenues & Volume, By Hesperidin, 2022-2032F |
6.1.5 Georgia Citrus Bioflavonoids Market Revenues & Volume, By Nobiletin, 2022-2032F |
6.1.6 Georgia Citrus Bioflavonoids Market Revenues & Volume, By Rutin, 2022-2032F |
6.1.7 Georgia Citrus Bioflavonoids Market Revenues & Volume, By Quercetin, 2022-2032F |
6.1.8 Georgia Citrus Bioflavonoids Market Revenues & Volume, By Diosmin, 2022-2032F |
6.1.9 Georgia Citrus Bioflavonoids Market Revenues & Volume, By other, 2022-2032F |
6.1.10 Georgia Citrus Bioflavonoids Market Revenues & Volume, By other, 2022-2032F |
6.2 Georgia Citrus Bioflavonoids Market, By End-users |
6.2.1 Overview and Analysis |
6.2.2 Georgia Citrus Bioflavonoids Market Revenues & Volume, By Pharmaceutical and Functional Foods, 2022-2032F |
6.2.3 Georgia Citrus Bioflavonoids Market Revenues & Volume, By Dietary Supplements, 2022-2032F |
6.2.4 Georgia Citrus Bioflavonoids Market Revenues & Volume, By Food and Beverages, 2022-2032F |
6.2.5 Georgia Citrus Bioflavonoids Market Revenues & Volume, By Cosmetics and Personal Care, 2022-2032F |
6.2.6 Georgia Citrus Bioflavonoids Market Revenues & Volume, By Animal Feed, 2022-2032F |
6.3 Georgia Citrus Bioflavonoids Market, By Distribution Channel |
6.3.1 Overview and Analysis |
6.3.2 Georgia Citrus Bioflavonoids Market Revenues & Volume, By Online Retail, 2022-2032F |
6.3.3 Georgia Citrus Bioflavonoids Market Revenues & Volume, By Herbal Specialty Store, 2022-2032F |
6.3.4 Georgia Citrus Bioflavonoids Market Revenues & Volume, By Retail, 2022-2032F |
6.3.5 Georgia Citrus Bioflavonoids Market Revenues & Volume, By Supermarket, 2022-2032F |
7 Georgia Citrus Bioflavonoids Market Import-Export Trade Statistics |
7.1 Georgia Citrus Bioflavonoids Market Export to Major Countries |
7.2 Georgia Citrus Bioflavonoids Market Imports from Major Countries |
8 Georgia Citrus Bioflavonoids Market Key Performance Indicators |
8.1 Research and development investment in new bioflavonoid extraction technologies |
8.2 Number of new product launches containing georgia citrus bioflavonoids |
8.3 Adoption rate of georgia citrus bioflavonoids in different consumer segments |
8.4 Sustainability initiatives in citrus cultivation for bioflavonoid production |
8.5 Consumer perception and acceptance of georgia citrus bioflavonoids |
9 Georgia Citrus Bioflavonoids Market - Opportunity Assessment |
9.1 Georgia Citrus Bioflavonoids Market Opportunity Assessment, By Type, 2022 & 2032F |
9.2 Georgia Citrus Bioflavonoids Market Opportunity Assessment, By End-users, 2022 & 2032F |
9.3 Georgia Citrus Bioflavonoids Market Opportunity Assessment, By Distribution Channel, 2022 & 2032F |
10 Georgia Citrus Bioflavonoids Market - Competitive Landscape |
10.1 Georgia Citrus Bioflavonoids Market Revenue Share, By Companies, 2025 |
10.2 Georgia Citrus Bioflavonoids Market Competitive Benchmarking, By Operating and Technical Parameters |
11 Company Profiles |
12 Recommendations |
13 Disclaimer |
Global Go To Market Strategy - 2030
Export potential enables firms to identify high-growth global markets with greater confidence by combining advanced trade intelligence with a structured quantitative methodology. The framework analyzes emerging demand trends and country-level import patterns while integrating macroeconomic and trade datasets such as GDP and population forecasts, bilateral import–export flows, tariff structures, elasticity differentials between developed and developing economies, geographic distance, and import demand projections. Using weighted trade values from 2020–2024 as the base period to project country-to-country export potential for 2030, these inputs are operationalized through calculated drivers such as gravity model parameters, tariff impact factors, and projected GDP per-capita growth. Through an analysis of hidden potentials, demand hotspots, and market conditions that are most favorable to success, this method enables firms to focus on target countries, maximize returns, and global expansion with data, backed by accuracy.
By factoring in the projected importer demand gap that is currently unmet and could be potential opportunity, it identifies the potential for the Exporter (Country) among 190 countries, against the general trade analysis, which identifies the biggest importer or exporter.
To discover high-growth global markets and optimize your business strategy:
Click Here
Pricing
- Single User License$ 1,995
- Department License$ 2,400
- Site License$ 3,120
- Global License$ 3,795

Leadership Perspectives from Industry Events
Search
Thought Leadership and Analyst Meet


Our Clients
6WResearch In News
- India Air Conditioner Market Set for Strong Rebound in 2026 After Weather-Led Correction and GST-Driven Recovery: 6Wresearch
- ADAS in India: How Automatic Emergency Braking, Blind Spot Detection & Driver Monitoring are Transforming Road Safety
- Doha a strategic location for EV manufacturing hub: IPA Qatar
- Demand for luxury TVs surging in the GCC, says Samsung
- Empowering Growth: The Thriving Journey of Bangladesh’s Cable Industry
- Demand for luxury TVs surging in the GCC, says Samsung
Latest Reports
- Nicaragua RPG Gaming Market (2026-2032)
- New Zealand RPG Gaming Market (2026-2032)
- Netherlands RPG Gaming Market (2026-2032)
- Nauru RPG Gaming Market (2026-2032)
- Namibia RPG Gaming Market (2026-2032)
- Mozambique RPG Gaming Market (2026-2032)
- Montenegro RPG Gaming Market (2026-2032)
- Mongolia RPG Gaming Market (2026-2032)
- Monaco RPG Gaming Market (2026-2032)
- Micronesia RPG Gaming Market (2026-2032)
Industry Events and Analyst Meet

HIMTEX 2026

India Refining Summit 2026

India EV Show 2026

EV tech India Expo 2026

Auto Tech Asia 2026
Whitepaper
- Middle East & Africa Commercial Security Market Click here to view more.
- Middle East & Africa Fire Safety Systems & Equipment Market Click here to view more.
- GCC Drone Market Click here to view more.
- Middle East Lighting Fixture Market Click here to view more.
- GCC Physical & Perimeter Security Market Click here to view more.