Georgia Clay Products And Refractories Market (2026-2032) Outlook | Analysis, Companies, Trends, Industry, Growth, Value, Forecast, Size, Share & Revenue
Market Forecast By Type (Pottery, Ceramics, Plumbing Fixtures, Clay Building Material, Refractories), By Process (Grinding , Cutting , Mixing , Shaping, Honing), By Material (Quartz, Chamatte, Sand, Sawdust, Slag, Pulverized , Coal), By End-User Vertical (Construction , Automobiles , Steel Making , Cosmetics, Food Industry, Others) And Competitive Landscape
| Product Code: ETC319140 | Publication Date: Aug 2022 | Updated Date: Jul 2026 | Product Type: Market Research Report | |
| Publisher: 6Wresearch | Author: Ravi Bhandari | No. of Pages: 75 | No. of Figures: 35 | No. of Tables: 20 |
Georgia Clay Products And Refractories Market Size, Share & Growth Rate
The Georgia Clay Products And Refractories Market was estimated at USD 951 Million in 2025 and is projected to reach USD 1379 Million by 2032, growing at a CAGR of 5.5% from 2026 to 2032. This positive trajectory is fueled by increasing investments in infrastructure and real estate developments across the state, which create sustained demand for clay-based construction materials. Furthermore, the rising trend towards eco-friendly building practices is propelling innovation, as manufacturers strive to deliver sustainable clay products that meet evolving market expectations.
Georgia Clay Products And Refractories Market Year-wise Growth Rate and Key Drivers
This graph highlights how the Georgia Clay Products And Refractories Market has steadily grown over the years, supported by major growth factors.
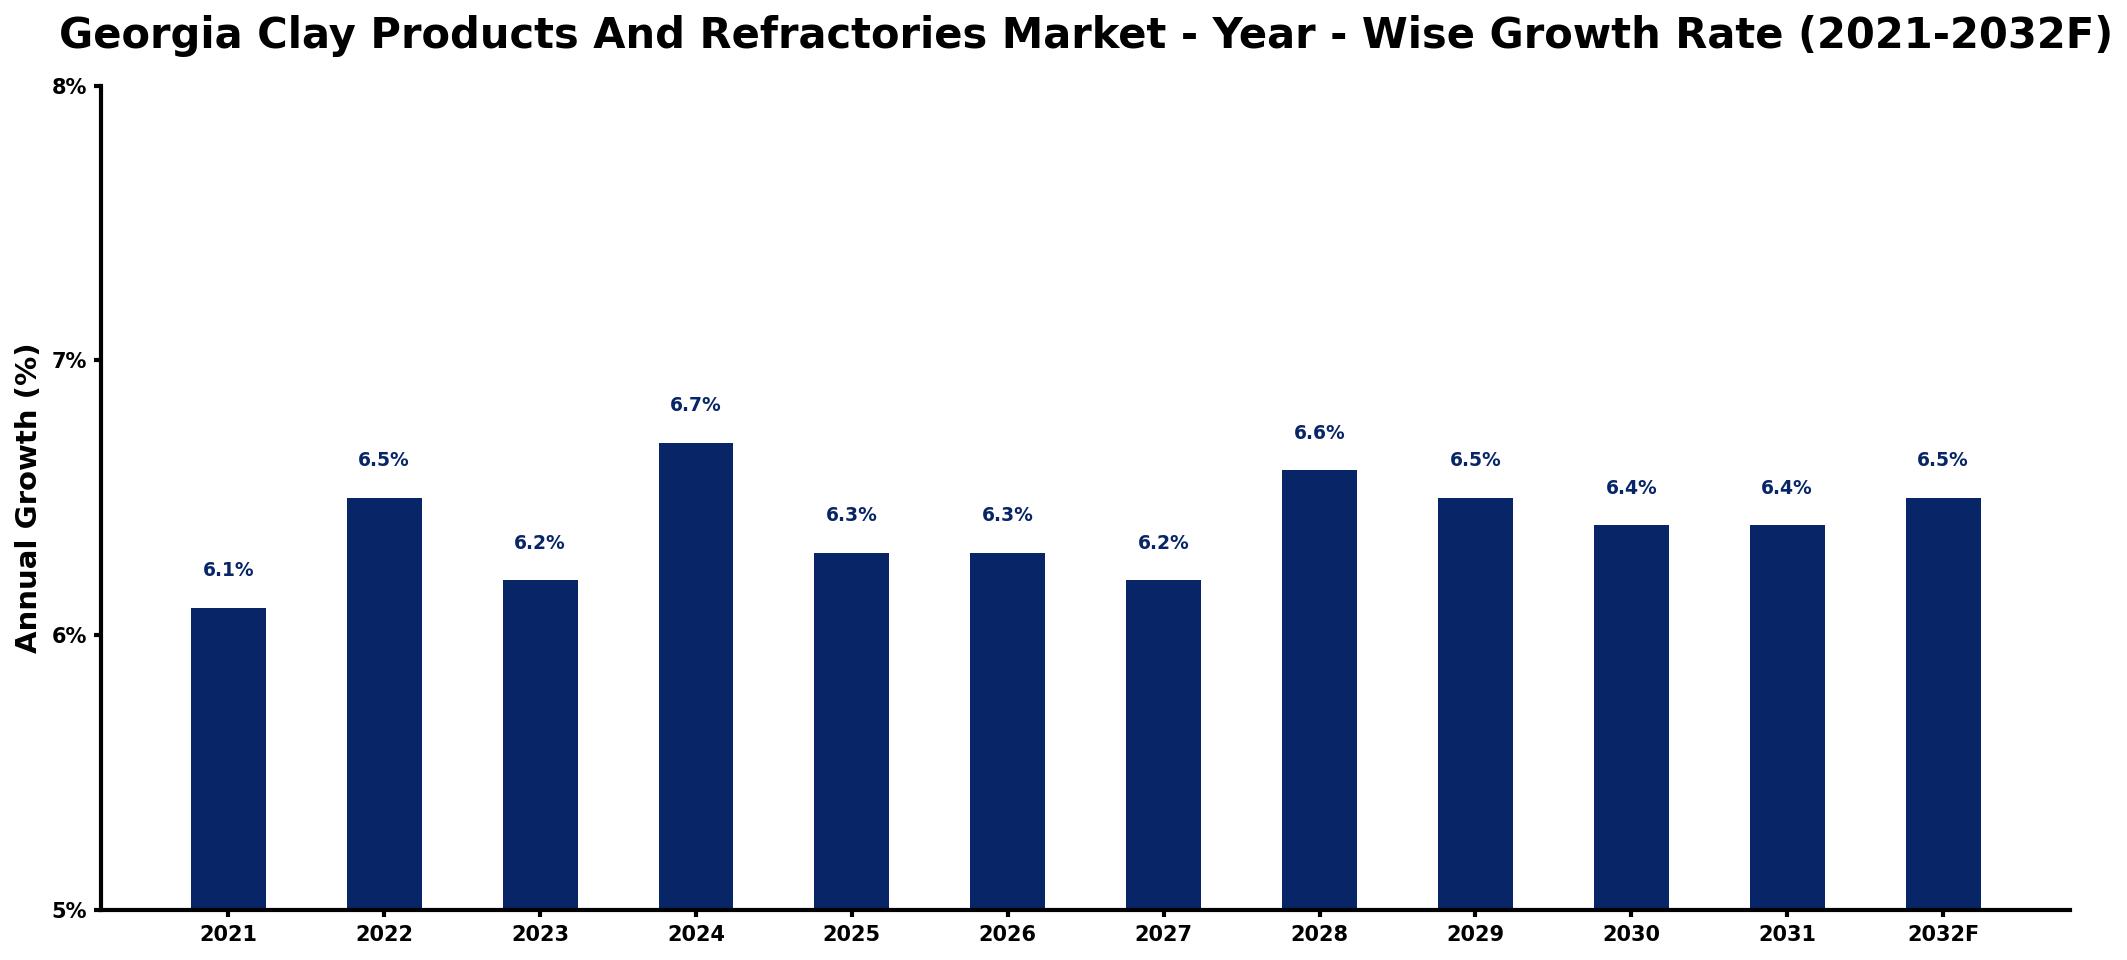
The table below presents the year‑wise growth rates along with the key drivers influencing the market
| Year | Growth Rate | Major Drivers |
| 2021 | 6.1% | Rising construction sector investments |
| 2022 | 6.5% | Increased industrial manufacturing activities |
| 2023 | 6.2% | Expansion in energy sector projects |
| 2024 | 6.7% | Growing demand for infrastructure development |
| 2025 | 6.3% | Surge in automotive industry requirements |
| 2026 | 6.3% | Boost in aerospace manufacturing growth |
| 2027 | 6.2% | Increased exports to international markets |
| 2028 | 6.6% | Heightened demand from electronics sector |
| 2029 | 6.5% | Growing focus on sustainable practices |
| 2030 | 6.4% | Emerging technologies driving innovation |
| 2031 | 6.4% | Rising investments in renewable energy |
| 2032 | 6.5% | Strengthened global supply chain networks |
Note: Market size estimations and growth projections presented in this report are based on 6Wresearch's proprietary forecasting methodology, utilizing the latest available industry data, government publications, and primary research inputs.
Georgia Clay Products And Refractories Market Synopsis
In Georgia, the clay products and refractories market benefits significantly from the state's abundant local clay reserves, which provide a reliable raw material source for various manufacturing processes. The versatility of these products enables their application in residential, commercial, and industrial sectors, underscoring their integral role in the region's economic development.
As the construction industry continues to expand, the demand for bricks, tiles, and specialized refractory materials remains strong. This market not only serves the local infrastructure needs but also positions itself strategically for exports, particularly in high-performance applications, thus enhancing Georgia's competitive edge in the global marketplace.
Georgia Clay Products And Refractories Market Key Takeaways
- The market is poised for steady growth driven by ongoing infrastructure projects and increased construction activity.
- Sustainable product innovations are becoming a focal point, aligning with broader environmental goals in construction.
- Government support through favorable policies enhances the operational landscape for manufacturers.
- Ongoing competition from alternative materials necessitates continuous innovation and adaptation in product offerings.
- Quality and safety regulations play a crucial role in maintaining market integrity and competitiveness.
Evaluation of Restraints in Georgia Clay Products And Refractories Market
Despite its growth potential, the Georgia Clay Products And Refractories Market faces several restraints that could impede progress. One significant challenge is the rising cost of raw materials, which directly impacts production costs and pricing strategies. Additionally, the market is experiencing increased competition from alternative building materials that offer superior performance or lower prices, compelling traditional clay manufacturers to innovate continually. The pressure to meet evolving industry standards related to heat resistance and durability also necessitates investment in R&D, straining resources for smaller companies.
Georgia Clay Products And Refractories Market Trends
Current trends indicate a marked shift towards sustainable construction practices, driving manufacturers to explore eco-friendly clay alternatives. Technological advancements, including automation in production processes, are also reshaping the industry landscape, enhancing efficiency and lowering production costs. Furthermore, there is a growing emphasis on designing clay products that meet specific aesthetic and functional requirements, which is reshaping product development in the market.
Georgia Clay Products And Refractories Market Opportunities
The opportunities for growth within the Georgia Clay Products And Refractories Market are substantial. Increased infrastructure investment, particularly in renewable energy and transportation, presents a lucrative avenue for clay product manufacturers. Additionally, tapping into international markets for high-performance refractories can drive exports and generate new revenue streams. Innovative product development targeting sustainability can also help companies differentiate themselves and appeal to environmentally-conscious consumers.
Government Initiatives in the Georgia Clay Products And Refractories Market
Government policies have significantly bolstered the Georgia clay products and refractories market through strategic initiatives aimed at manufacturing support. Tax incentives for investment in modern equipment and infrastructure are crucial in promoting growth within the industry. Moreover, regulatory frameworks ensure product safety and quality, facilitating competitiveness in both domestic and international markets while simultaneously encouraging sustainable practices.
Future Insights of the Georgia Clay Products And Refractories Market
Looking ahead to the period from 2026 to 2032, the Georgia Clay Products And Refractories Market is anticipated to evolve in response to changing consumer demands and technological advancements. A continued focus on sustainability will likely reshape product offerings, with an increase in the development of eco-friendly alternatives. Moreover, the integration of digital technologies in production processes is expected to enhance efficiency and flexibility, enabling manufacturers to respond swiftly to market changes and consumer preferences.
Georgia Clay Products And Refractories Market Latest Developments (2025 - 2026)
Recent developments in the Georgia clay products and refractories market reflect an ongoing commitment to innovation and sustainability. Manufacturers are increasingly adopting new technologies to optimize production processes, reduce waste, and improve product quality. Additionally, collaborations between industry stakeholders and academic institutions are fostering research initiatives aimed at developing advanced materials that meet the demands of modern construction and industrial applications.
Georgia Clay Products And Refractories Market - Key Attractiveness of the Report
- 10 Years of Market Numbers
- Historical Data Starting from 2022 to 2025
- Base Year: 2025
- Forecast Data until 2032
- Key Performance Indicators Impacting the Market
- Major Upcoming Developments and Projects
Key Highlights of the Report:
- Georgia Clay Products And Refractories Market Outlook
- Market Size of Georgia Clay Products And Refractories Market, 2025
- Forecast of Georgia Clay Products And Refractories Market, 2032
- Historical Data and Forecast of Georgia Clay Products And Refractories Revenues & Volume for the Period 2022-2032F
- Georgia Clay Products And Refractories Market Trend Evolution
- Georgia Clay Products And Refractories Market Drivers and Challenges
- Georgia Clay Products And Refractories Price Trends
- Georgia Clay Products And Refractories Porter's Five Forces
- Georgia Clay Products And Refractories Industry Life Cycle
- Historical Data and Forecast of Georgia Clay Products And Refractories Market Revenues & Volume By Type for the Period 2022-2032F
- Historical Data and Forecast of Georgia Clay Products And Refractories Market Revenues & Volume By Pottery for the Period 2022-2032F
- Historical Data and Forecast of Georgia Clay Products And Refractories Market Revenues & Volume By Ceramics for the Period 2022-2032F
- Historical Data and Forecast of Georgia Clay Products And Refractories Market Revenues & Volume By Plumbing Fixtures for the Period 2022-2032F
- Historical Data and Forecast of Georgia Clay Products And Refractories Market Revenues & Volume By Clay Building Material for the Period 2022-2032F
- Historical Data and Forecast of Georgia Clay Products And Refractories Market Revenues & Volume By Refractories for the Period 2022-2032F
- Historical Data and Forecast of Georgia Clay Products And Refractories Market Revenues & Volume By Process for the Period 2022-2032F
- Historical Data and Forecast of Georgia Clay Products And Refractories Market Revenues & Volume By Grinding for the Period 2022-2032F
- Historical Data and Forecast of Georgia Clay Products And Refractories Market Revenues & Volume By Cutting for the Period 2022-2032F
- Historical Data and Forecast of Georgia Clay Products And Refractories Market Revenues & Volume By Mixing for the Period 2022-2032F
- Historical Data and Forecast of Georgia Clay Products And Refractories Market Revenues & Volume By Shaping for the Period 2022-2032F
- Historical Data and Forecast of Georgia Clay Products And Refractories Market Revenues & Volume By Honing for the Period 2022-2032F
- Historical Data and Forecast of Georgia Clay Products And Refractories Market Revenues & Volume By Material for the Period 2022-2032F
- Historical Data and Forecast of Georgia Clay Products And Refractories Market Revenues & Volume By Quartz for the Period 2022-2032F
- Historical Data and Forecast of Georgia Clay Products And Refractories Market Revenues & Volume By Chamatte for the Period 2022-2032F
- Historical Data and Forecast of Georgia Clay Products And Refractories Market Revenues & Volume By Sand for the Period 2022-2032F
- Historical Data and Forecast of Georgia Clay Products And Refractories Market Revenues & Volume By Sawdust for the Period 2022-2032F
- Historical Data and Forecast of Georgia Clay Products And Refractories Market Revenues & Volume By Slag for the Period 2022-2032F
- Historical Data and Forecast of Georgia Clay Products And Refractories Market Revenues & Volume By Pulverized for the Period 2022-2032F
- Historical Data and Forecast of Georgia Clay Products And Refractories Market Revenues & Volume By Coal for the Period 2022-2032F
- Historical Data and Forecast of Georgia Clay Products And Refractories Market Revenues & Volume By End-User Vertical for the Period 2022-2032F
- Historical Data and Forecast of Georgia Clay Products And Refractories Market Revenues & Volume By Construction for the Period 2022-2032F
- Historical Data and Forecast of Georgia Clay Products And Refractories Market Revenues & Volume By Automobiles for the Period 2022-2032F
- Historical Data and Forecast of Georgia Clay Products And Refractories Market Revenues & Volume By Steel Making for the Period 2022-2032F
- Historical Data and Forecast of Georgia Clay Products And Refractories Market Revenues & Volume By Cosmetics for the Period 2022-2032F
- Historical Data and Forecast of Georgia Clay Products And Refractories Market Revenues & Volume By Food Industry for the Period 2022-2032F
- Historical Data and Forecast of Georgia Clay Products And Refractories Market Revenues & Volume By Others for the Period 2022-2032F
- Georgia Clay Products And Refractories Import Export Trade Statistics
- Market Opportunity Assessment By Type
- Market Opportunity Assessment By Process
- Market Opportunity Assessment By Material
- Market Opportunity Assessment By End-User Vertical
- Georgia Clay Products And Refractories Top Companies Market Share
- Georgia Clay Products And Refractories Competitive Benchmarking By Technical and Operational Parameters
- Georgia Clay Products And Refractories Company Profiles
- Georgia Clay Products And Refractories Key Strategic Recommendations
Frequently Asked Questions About the Market Study (FAQs):
The primary growth drivers include the booming construction industry, infrastructure developments, and a heightened emphasis on sustainable construction practices.
The Georgia Clay Products And Refractories Market was valued at USD 951 Million in 2025 and is projected to grow to USD 1379 Million by 2032, at a CAGR of 5.5% from 2026 to 2032.
Companies are contending with rising raw material costs, intense competition from alternative materials, and the need to innovate to comply with evolving industry standards.
Government initiatives, including tax incentives and quality regulations, are fostering an environment that supports growth and competitiveness in the clay products and refractories market.
Key trends include a focus on sustainability, technological advancements in manufacturing, and an increasing demand for aesthetically pleasing and functional building materials.
Opportunities abound in export markets for high-performance refractories, as well as in developing sustainable product lines to meet the evolving needs of environmentally-conscious consumers.
6Wresearch actively monitors the Georgia Clay Products And Refractories Market and publishes its comprehensive annual report, highlighting emerging trends, growth drivers, revenue analysis, and forecast outlook. Our insights help businesses to make data-backed strategic decisions with ongoing market dynamics. Our analysts track relevent industries related to the Georgia Clay Products And Refractories Market, allowing our clients with actionable intelligence and reliable forecasts tailored to emerging regional needs.
Yes, we provide customisation as per your requirements. To learn more, feel free to contact us on sales@6wresearch.com
1 Executive Summary |
2 Introduction |
2.1 Key Highlights of the Report |
2.2 Report Description |
2.3 Market Scope & Segmentation |
2.4 Research Methodology |
2.5 Assumptions |
3 Georgia Clay Products And Refractories Market Overview |
3.1 Georgia Country Macro Economic Indicators |
3.2 Georgia Clay Products And Refractories Market Revenues & Volume, 2022 & 2032F |
3.3 Georgia Clay Products And Refractories Market - Industry Life Cycle |
3.4 Georgia Clay Products And Refractories Market - Porter's Five Forces |
3.5 Georgia Clay Products And Refractories Market Revenues & Volume Share, By Type, 2022 & 2032F |
3.6 Georgia Clay Products And Refractories Market Revenues & Volume Share, By Process , 2022 & 2032F |
3.7 Georgia Clay Products And Refractories Market Revenues & Volume Share, By Material , 2022 & 2032F |
3.8 Georgia Clay Products And Refractories Market Revenues & Volume Share, By End-User Vertical , 2022 & 2032F |
4 Georgia Clay Products And Refractories Market Dynamics |
4.1 Impact Analysis |
4.2 Market Drivers |
4.2.1 Increasing demand for construction materials and refractories in industries such as steel, cement, and glass due to infrastructure development and industrial growth. |
4.2.2 Growing focus on sustainable and eco-friendly building materials, where Georgia clay products are seen as a viable option. |
4.2.3 Technological advancements in clay processing and refractory manufacturing leading to improved product quality and performance. |
4.3 Market Restraints |
4.3.1 Fluctuating raw material prices, especially for clay and other refractory materials, impacting production costs and profitability. |
4.3.2 Intense competition from alternative materials such as synthetic refractories and metal alloys, affecting market share and pricing strategies. |
5 Georgia Clay Products And Refractories Market Trends |
6 Georgia Clay Products And Refractories Market, By Types |
6.1 Georgia Clay Products And Refractories Market, By Type |
6.1.1 Overview and Analysis |
6.1.2 Georgia Clay Products And Refractories Market Revenues & Volume, By Type, 2022-2032F |
6.1.3 Georgia Clay Products And Refractories Market Revenues & Volume, By Pottery, 2022-2032F |
6.1.4 Georgia Clay Products And Refractories Market Revenues & Volume, By Ceramics, 2022-2032F |
6.1.5 Georgia Clay Products And Refractories Market Revenues & Volume, By Plumbing Fixtures, 2022-2032F |
6.1.6 Georgia Clay Products And Refractories Market Revenues & Volume, By Clay Building Material, 2022-2032F |
6.1.7 Georgia Clay Products And Refractories Market Revenues & Volume, By Refractories, 2022-2032F |
6.2 Georgia Clay Products And Refractories Market, By Process |
6.2.1 Overview and Analysis |
6.2.2 Georgia Clay Products And Refractories Market Revenues & Volume, By Grinding , 2022-2032F |
6.2.3 Georgia Clay Products And Refractories Market Revenues & Volume, By Cutting , 2022-2032F |
6.2.4 Georgia Clay Products And Refractories Market Revenues & Volume, By Mixing , 2022-2032F |
6.2.5 Georgia Clay Products And Refractories Market Revenues & Volume, By Shaping, 2022-2032F |
6.2.6 Georgia Clay Products And Refractories Market Revenues & Volume, By Honing, 2022-2032F |
6.3 Georgia Clay Products And Refractories Market, By Material |
6.3.1 Overview and Analysis |
6.3.2 Georgia Clay Products And Refractories Market Revenues & Volume, By Quartz, 2022-2032F |
6.3.3 Georgia Clay Products And Refractories Market Revenues & Volume, By Chamatte, 2022-2032F |
6.3.4 Georgia Clay Products And Refractories Market Revenues & Volume, By Sand, 2022-2032F |
6.3.5 Georgia Clay Products And Refractories Market Revenues & Volume, By Sawdust, 2022-2032F |
6.3.6 Georgia Clay Products And Refractories Market Revenues & Volume, By Slag, 2022-2032F |
6.3.7 Georgia Clay Products And Refractories Market Revenues & Volume, By Pulverized , 2022-2032F |
6.4 Georgia Clay Products And Refractories Market, By End-User Vertical |
6.4.1 Overview and Analysis |
6.4.2 Georgia Clay Products And Refractories Market Revenues & Volume, By Construction , 2022-2032F |
6.4.3 Georgia Clay Products And Refractories Market Revenues & Volume, By Automobiles , 2022-2032F |
6.4.4 Georgia Clay Products And Refractories Market Revenues & Volume, By Steel Making , 2022-2032F |
6.4.5 Georgia Clay Products And Refractories Market Revenues & Volume, By Cosmetics, 2022-2032F |
6.4.6 Georgia Clay Products And Refractories Market Revenues & Volume, By Food Industry, 2022-2032F |
6.4.7 Georgia Clay Products And Refractories Market Revenues & Volume, By Others, 2022-2032F |
7 Georgia Clay Products And Refractories Market Import-Export Trade Statistics |
7.1 Georgia Clay Products And Refractories Market Export to Major Countries |
7.2 Georgia Clay Products And Refractories Market Imports from Major Countries |
8 Georgia Clay Products And Refractories Market Key Performance Indicators |
8.1 Energy efficiency of clay products and refractories, indicating sustainability and cost-effectiveness. |
8.2 RD investment in developing innovative clay products and refractories, reflecting future market competitiveness. |
8.3 Adoption rate of Georgia clay products and refractories in key industries like steel, cement, and glass, demonstrating market acceptance and growth potential. |
9 Georgia Clay Products And Refractories Market - Opportunity Assessment |
9.1 Georgia Clay Products And Refractories Market Opportunity Assessment, By Type, 2022 & 2032F |
9.2 Georgia Clay Products And Refractories Market Opportunity Assessment, By Process , 2022 & 2032F |
9.3 Georgia Clay Products And Refractories Market Opportunity Assessment, By Material , 2022 & 2032F |
9.4 Georgia Clay Products And Refractories Market Opportunity Assessment, By End-User Vertical , 2022 & 2032F |
10 Georgia Clay Products And Refractories Market - Competitive Landscape |
10.1 Georgia Clay Products And Refractories Market Revenue Share, By Companies, 2025 |
10.2 Georgia Clay Products And Refractories Market Competitive Benchmarking, By Operating and Technical Parameters |
11 Company Profiles |
12 Recommendations |
13 Disclaimer |
Global Go To Market Strategy - 2030
Export potential enables firms to identify high-growth global markets with greater confidence by combining advanced trade intelligence with a structured quantitative methodology. The framework analyzes emerging demand trends and country-level import patterns while integrating macroeconomic and trade datasets such as GDP and population forecasts, bilateral import–export flows, tariff structures, elasticity differentials between developed and developing economies, geographic distance, and import demand projections. Using weighted trade values from 2020–2024 as the base period to project country-to-country export potential for 2030, these inputs are operationalized through calculated drivers such as gravity model parameters, tariff impact factors, and projected GDP per-capita growth. Through an analysis of hidden potentials, demand hotspots, and market conditions that are most favorable to success, this method enables firms to focus on target countries, maximize returns, and global expansion with data, backed by accuracy.
By factoring in the projected importer demand gap that is currently unmet and could be potential opportunity, it identifies the potential for the Exporter (Country) among 190 countries, against the general trade analysis, which identifies the biggest importer or exporter.
To discover high-growth global markets and optimize your business strategy:
Click Here
Pricing
- Single User License$ 1,995
- Department License$ 2,400
- Site License$ 3,120
- Global License$ 3,795

Leadership Perspectives from Industry Events
Search
Thought Leadership and Analyst Meet


Our Clients
6WResearch In News
- India Air Conditioner Market Set for Strong Rebound in 2026 After Weather-Led Correction and GST-Driven Recovery: 6Wresearch
- ADAS in India: How Automatic Emergency Braking, Blind Spot Detection & Driver Monitoring are Transforming Road Safety
- Doha a strategic location for EV manufacturing hub: IPA Qatar
- Demand for luxury TVs surging in the GCC, says Samsung
- Empowering Growth: The Thriving Journey of Bangladesh’s Cable Industry
- Demand for luxury TVs surging in the GCC, says Samsung
Latest Reports
- Nicaragua RPG Gaming Market (2026-2032)
- New Zealand RPG Gaming Market (2026-2032)
- Netherlands RPG Gaming Market (2026-2032)
- Nauru RPG Gaming Market (2026-2032)
- Namibia RPG Gaming Market (2026-2032)
- Mozambique RPG Gaming Market (2026-2032)
- Montenegro RPG Gaming Market (2026-2032)
- Mongolia RPG Gaming Market (2026-2032)
- Monaco RPG Gaming Market (2026-2032)
- Micronesia RPG Gaming Market (2026-2032)
Industry Events and Analyst Meet

EV India Expo 2026

HIMTEX 2026

India Refining Summit 2026

India EV Show 2026

EV tech India Expo 2026
Whitepaper
- Middle East & Africa Commercial Security Market Click here to view more.
- Middle East & Africa Fire Safety Systems & Equipment Market Click here to view more.
- GCC Drone Market Click here to view more.
- Middle East Lighting Fixture Market Click here to view more.
- GCC Physical & Perimeter Security Market Click here to view more.