Georgia Commercial Printing Market (2020-2026) | Value, Growth, Industry, Size, Analysis, Revenue, Companies, Forecast, Share, Trends, COVID-19 IMPACT & Outlook
Market Forecast By Type (Offset Lithography, Inkjet, Flexographic, Screen, Gravure, Other), By Applications (Packaging, Advertising, Publishing, Other) And Competitive Landscape
| Product Code: ETC037482 | Publication Date: Jan 2021 | Updated Date: Apr 2025 | Product Type: Report | |
| Publisher: 6Wresearch | Author: Ravi Bhandari | No. of Pages: 70 | No. of Figures: 35 | No. of Tables: 5 |
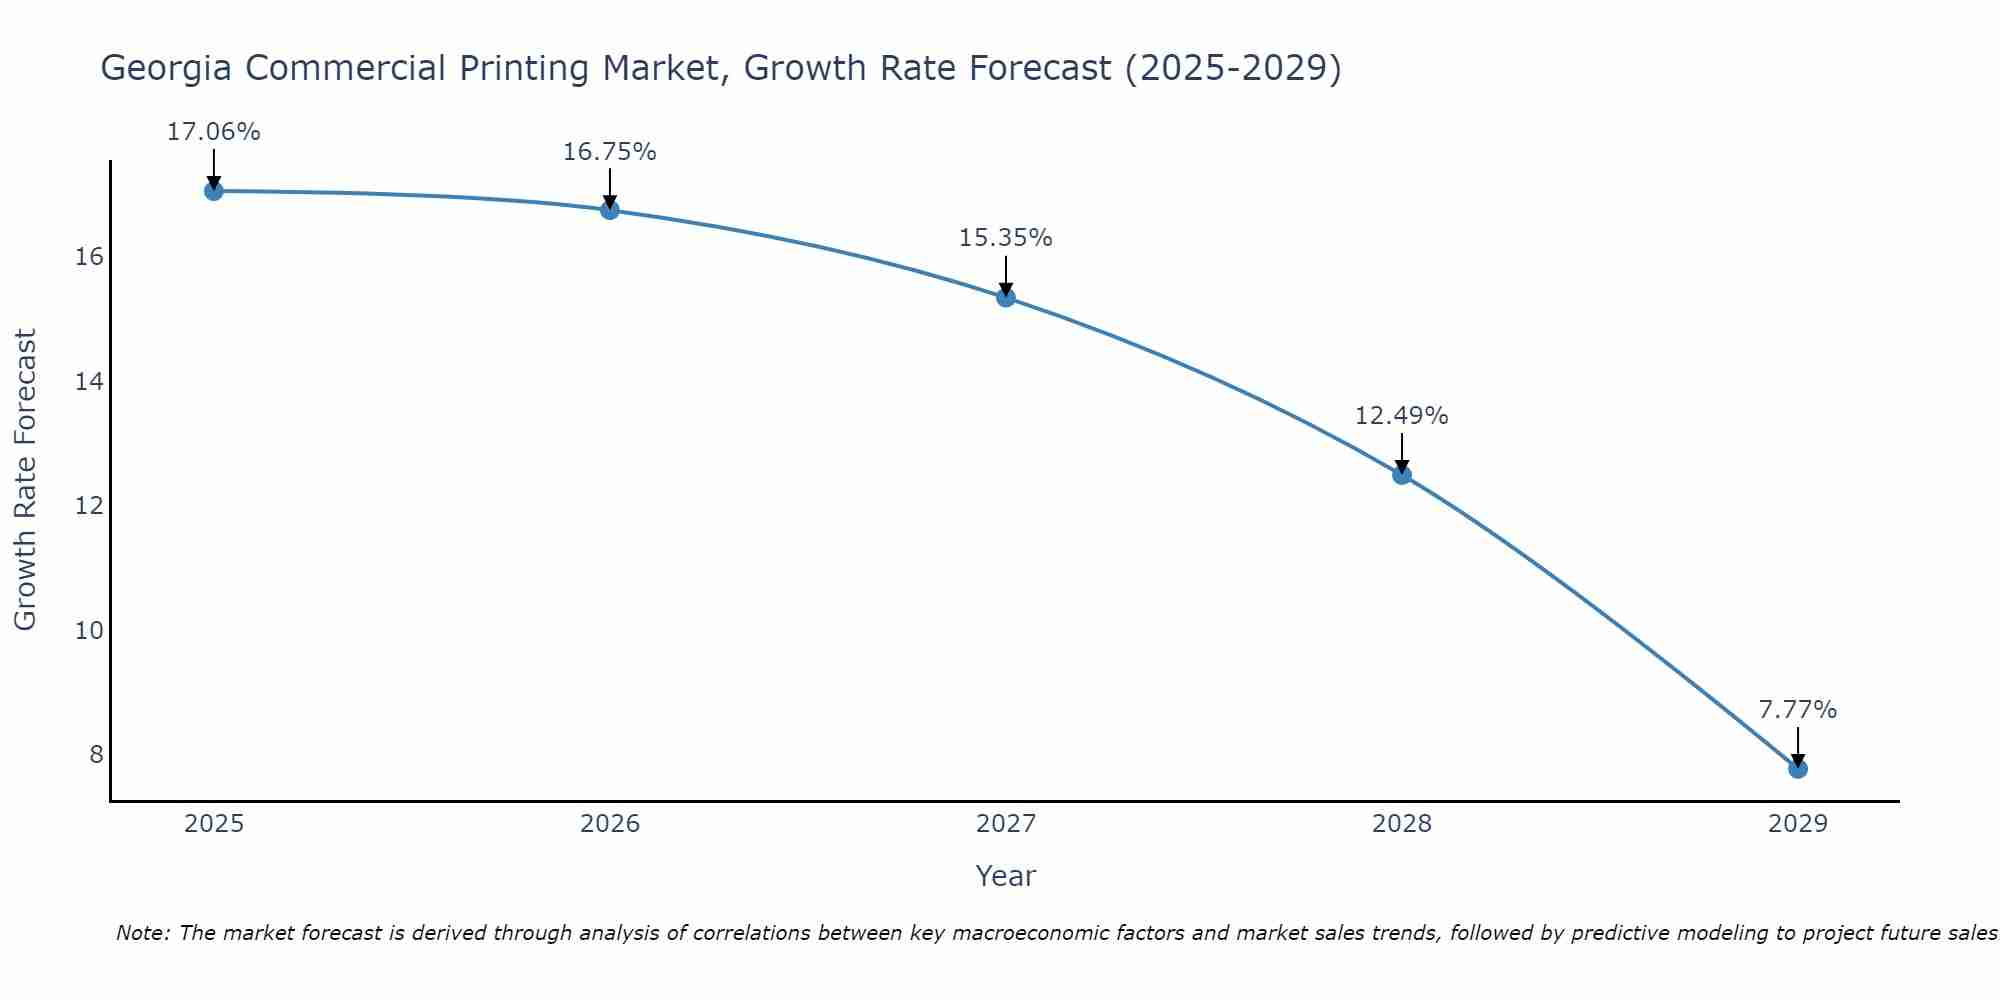
Georgia Commercial Printing Market Size Growth Rate
The Georgia Commercial Printing Market may undergo a gradual slowdown in growth rates between 2025 and 2029. Starting high at 17.06% in 2025, the market steadily declines to 7.77% by 2029.
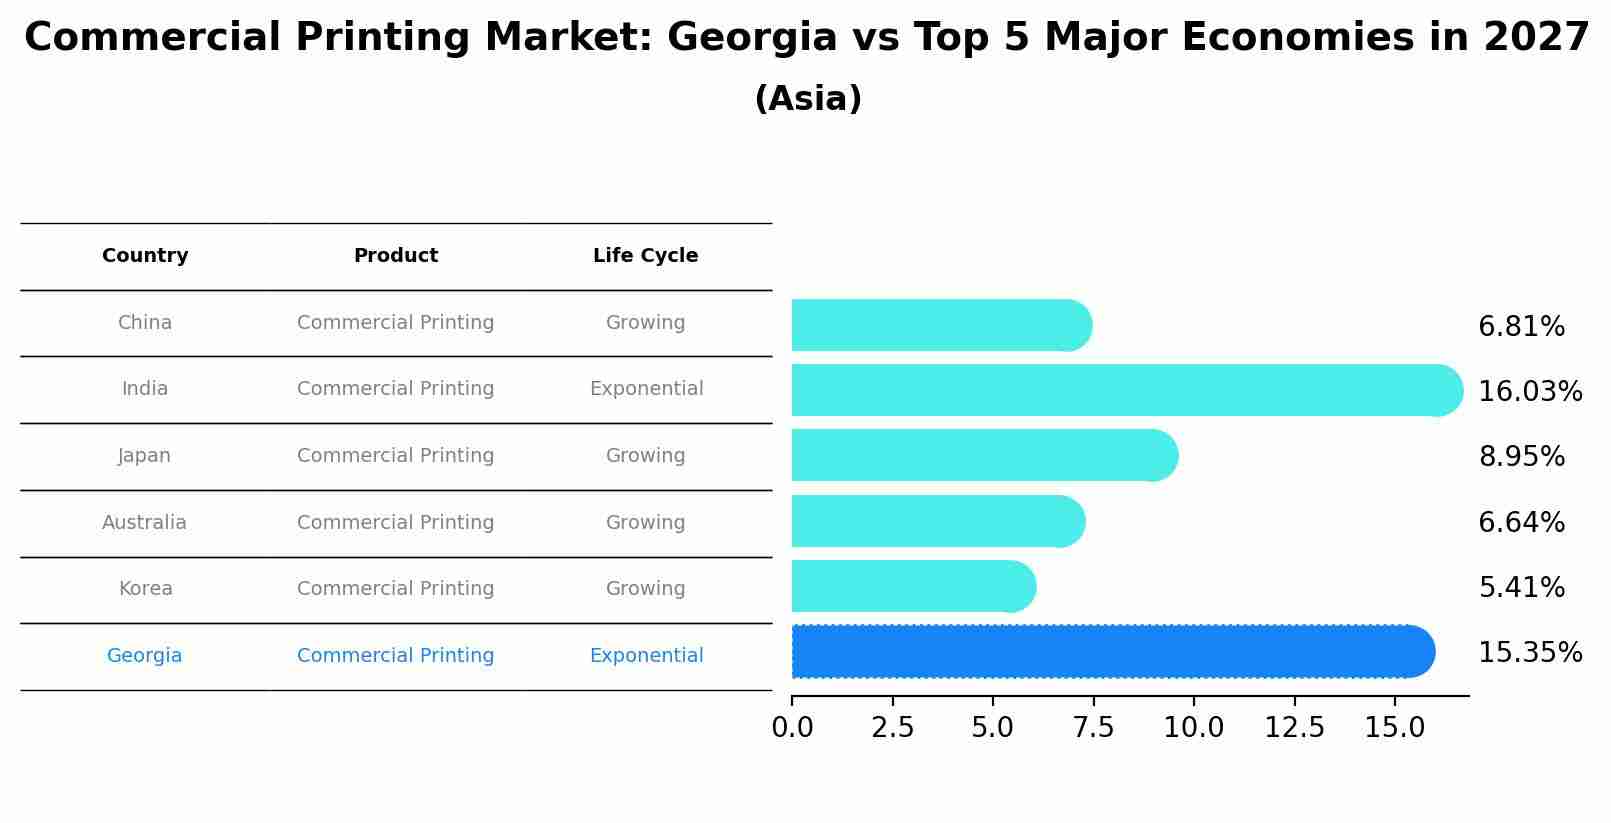
Commercial Printing Market: Georgia vs Top 5 Major Economies in 2027 (Asia)
In the Asia region, the Commercial Printing market in Georgia is projected to expand at a exponential growth rate of 15.35% by 2027. The largest economy is China, followed by India, Japan, Australia and South Korea.
Georgia Commercial Printing Market Overview
The commercial printing market in Georgia remains resilient despite digitalization trends, with a focus on niche printing services, packaging solutions, and personalized marketing materials. Printing companies are investing in advanced printing technologies, sustainable practices, and value-added services to meet the diverse needs of clients across industries such as advertising, publishing, and retail.
Drivers of the market
The commercial printing market in Georgia is witnessing steady growth, driven by the evolving needs of businesses and advancements in printing technology. Despite the digitalization trend, print media continues to play a significant role in marketing, advertising, packaging, and publishing sectors. The demand for high-quality printing services, personalized marketing collateral, and packaging solutions is driving market growth. Moreover, the emergence of digital printing technologies, such as inkjet and laser printing, is enabling faster turnaround times, customization capabilities, and cost-effectiveness, further fueling market expansion in Georgia.
Challenges of the market
In an increasingly digital age, Georgia commercial printing market grapples with declining demand for traditional printing services. Adapting to changing consumer preferences, such as the shift towards online advertising and digital media, presents a formidable challenge for printing companies seeking to remain competitive.
Government Policy of the market
In Georgia, the commercial printing market is influenced by government policies related to environmental sustainability, labor regulations, and industry standards. Government agencies may implement regulations to reduce waste and promote recycling in the printing industry, encouraging companies to adopt eco-friendly practices. Additionally, there may be labor laws governing working conditions and employee rights, impacting the operations of printing businesses. Compliance with industry standards and certifications is essential for companies to remain competitive in the market and meet customer expectations for quality and reliability.
Key Highlights of the Report:
- Georgia Commercial Printing Market Outlook
- Market Size of Georgia Commercial Printing Market, 2019
- Forecast of Georgia Commercial Printing Market, 2026
- Historical Data and Forecast of Georgia Commercial Printing Revenues & Volume for the Period 2016 - 2026
- Georgia Commercial Printing Market Trend Evolution
- Georgia Commercial Printing Market Drivers and Challenges
- Georgia Commercial Printing Price Trends
- Georgia Commercial Printing Porter's Five Forces
- Georgia Commercial Printing Industry Life Cycle
- Historical Data and Forecast of Georgia Commercial Printing Market Revenues & Volume By Type for the Period 2016 - 2026
- Historical Data and Forecast of Georgia Commercial Printing Market Revenues & Volume By Offset Lithography for the Period 2016 - 2026
- Historical Data and Forecast of Georgia Commercial Printing Market Revenues & Volume By Inkjet for the Period 2016 - 2026
- Historical Data and Forecast of Georgia Commercial Printing Market Revenues & Volume By Flexographic for the Period 2016 - 2026
- Historical Data and Forecast of Georgia Commercial Printing Market Revenues & Volume By Screen for the Period 2016 - 2026
- Historical Data and Forecast of Georgia Commercial Printing Market Revenues & Volume By Gravure for the Period 2016 - 2026
- Historical Data and Forecast of Georgia Commercial Printing Market Revenues & Volume By Other for the Period 2016 - 2026
- Historical Data and Forecast of Georgia Commercial Printing Market Revenues & Volume By Applications for the Period 2016 - 2026
- Historical Data and Forecast of Georgia Commercial Printing Market Revenues & Volume By Packaging for the Period 2016 - 2026
- Historical Data and Forecast of Georgia Commercial Printing Market Revenues & Volume By Advertising for the Period 2016 - 2026
- Historical Data and Forecast of Georgia Commercial Printing Market Revenues & Volume By Publishing for the Period 2016 - 2026
- Historical Data and Forecast of Georgia Commercial Printing Market Revenues & Volume By Other for the Period 2016 - 2026
- Georgia Commercial Printing Import Export Trade Statistics
- Market Opportunity Assessment By Type
- Market Opportunity Assessment By Applications
- Georgia Commercial Printing Top Companies Market Share
- Georgia Commercial Printing Competitive Benchmarking By Technical and Operational Parameters
- Georgia Commercial Printing Company Profiles
- Georgia Commercial Printing Key Strategic Recommendations
Frequently Asked Questions About the Market Study (FAQs):
6Wresearch actively monitors the Georgia Commercial Printing Market and publishes its comprehensive annual report, highlighting emerging trends, growth drivers, revenue analysis, and forecast outlook. Our insights help businesses to make data-backed strategic decisions with ongoing market dynamics. Our analysts track relevent industries related to the Georgia Commercial Printing Market, allowing our clients with actionable intelligence and reliable forecasts tailored to emerging regional needs.
Yes, we provide customisation as per your requirements. To learn more, feel free to contact us on sales@6wresearch.com
1 Executive Summary |
2 Introduction |
2.1 Key Highlights of the Report |
2.2 Report Description |
2.3 Market Scope & Segmentation |
2.4 Research Methodology |
2.5 Assumptions |
3 United States (US) Plastics Materials and Resins Market Overview |
3.1 United States (US) Country Macro Economic Indicators |
3.2 United States (US) Plastics Materials and Resins Market Revenues & Volume, 2019 & 2026F |
3.3 United States (US) Plastics Materials and Resins Market - Industry Life Cycle |
3.4 United States (US) Plastics Materials and Resins Market - Porter's Five Forces |
3.5 United States (US) Plastics Materials and Resins Market Revenues & Volume Share, By Type, 2019 & 2026F |
3.6 United States (US) Plastics Materials and Resins Market Revenues & Volume Share, By Applications, 2019 & 2026F |
4 United States (US) Plastics Materials and Resins Market Dynamics |
4.1 Impact Analysis |
4.2 Market Drivers |
4.3 Market Restraints |
5 United States (US) Plastics Materials and Resins Market Trends |
6 United States (US) Plastics Materials and Resins Market, By Types |
6.1 United States (US) Plastics Materials and Resins Market, By Type |
6.1.1 Overview and Analysis |
6.1.2 United States (US) Plastics Materials and Resins Market Revenues & Volume, By Type, 2016 - 2026F |
6.1.3 United States (US) Plastics Materials and Resins Market Revenues & Volume, By Polypropylene (PP), 2016 - 2026F |
6.1.4 United States (US) Plastics Materials and Resins Market Revenues & Volume, By High-density polyethylene (PE-HD), 2016 - 2026F |
6.1.5 United States (US) Plastics Materials and Resins Market Revenues & Volume, By Polyvinyl chloride (PVC), 2016 - 2026F |
6.1.6 United States (US) Plastics Materials and Resins Market Revenues & Volume, By Polyethylene terephthalate (PET), 2016 - 2026F |
6.2 United States (US) Plastics Materials and Resins Market, By Applications |
6.2.1 Overview and Analysis |
6.2.2 United States (US) Plastics Materials and Resins Market Revenues & Volume, By Chemical Industry, 2016 - 2026F |
6.2.3 United States (US) Plastics Materials and Resins Market Revenues & Volume, By Coating & Printing Industry, 2016 - 2026F |
6.2.4 United States (US) Plastics Materials and Resins Market Revenues & Volume, By Electronics Industry, 2016 - 2026F |
6.2.5 United States (US) Plastics Materials and Resins Market Revenues & Volume, By Food & Pharmaceutical Industry, 2016 - 2026F |
6.2.6 United States (US) Plastics Materials and Resins Market Revenues & Volume, By Others, 2016 - 2026F |
7 United States (US) Plastics Materials and Resins Market Import-Export Trade Statistics |
7.1 United States (US) Plastics Materials and Resins Market Export to Major Countries |
7.2 United States (US) Plastics Materials and Resins Market Imports from Major Countries |
8 United States (US) Plastics Materials and Resins Market Key Performance Indicators |
9 United States (US) Plastics Materials and Resins Market - Opportunity Assessment |
9.1 United States (US) Plastics Materials and Resins Market Opportunity Assessment, By Type, 2019 & 2026F |
9.2 United States (US) Plastics Materials and Resins Market Opportunity Assessment, By Applications, 2019 & 2026F |
10 United States (US) Plastics Materials and Resins Market - Competitive Landscape |
10.1 United States (US) Plastics Materials and Resins Market Revenue Share, By Companies, 2019 |
10.2 United States (US) Plastics Materials and Resins Market Competitive Benchmarking, By Operating and Technical Parameters |
11 Company Profiles |
12 Recommendations |
13 Disclaimer |
Global Go To Market Strategy - 2030
Export potential enables firms to identify high-growth global markets with greater confidence by combining advanced trade intelligence with a structured quantitative methodology. The framework analyzes emerging demand trends and country-level import patterns while integrating macroeconomic and trade datasets such as GDP and population forecasts, bilateral import–export flows, tariff structures, elasticity differentials between developed and developing economies, geographic distance, and import demand projections. Using weighted trade values from 2020–2024 as the base period to project country-to-country export potential for 2030, these inputs are operationalized through calculated drivers such as gravity model parameters, tariff impact factors, and projected GDP per-capita growth. Through an analysis of hidden potentials, demand hotspots, and market conditions that are most favorable to success, this method enables firms to focus on target countries, maximize returns, and global expansion with data, backed by accuracy.
By factoring in the projected importer demand gap that is currently unmet and could be potential opportunity, it identifies the potential for the Exporter (Country) among 190 countries, against the general trade analysis, which identifies the biggest importer or exporter.
To discover high-growth global markets and optimize your business strategy:
Click Here
Pricing
- Single User License$ 1,995
- Department License$ 2,400
- Site License$ 3,120
- Global License$ 3,795

Leadership Perspectives from Industry Events
Search
Thought Leadership and Analyst Meet


Our Clients
6WResearch In News
- India Air Conditioner Market Set for Strong Rebound in 2026 After Weather-Led Correction and GST-Driven Recovery: 6Wresearch
- ADAS in India: How Automatic Emergency Braking, Blind Spot Detection & Driver Monitoring are Transforming Road Safety
- Doha a strategic location for EV manufacturing hub: IPA Qatar
- Demand for luxury TVs surging in the GCC, says Samsung
- Empowering Growth: The Thriving Journey of Bangladesh’s Cable Industry
- Demand for luxury TVs surging in the GCC, says Samsung
Latest Reports
- Nicaragua RPG Gaming Market (2026-2032)
- New Zealand RPG Gaming Market (2026-2032)
- Netherlands RPG Gaming Market (2026-2032)
- Nauru RPG Gaming Market (2026-2032)
- Namibia RPG Gaming Market (2026-2032)
- Mozambique RPG Gaming Market (2026-2032)
- Montenegro RPG Gaming Market (2026-2032)
- Mongolia RPG Gaming Market (2026-2032)
- Monaco RPG Gaming Market (2026-2032)
- Micronesia RPG Gaming Market (2026-2032)
Industry Events and Analyst Meet

EV India Expo 2026

HIMTEX 2026

India Refining Summit 2026

India EV Show 2026

EV tech India Expo 2026
Whitepaper
- Middle East & Africa Commercial Security Market Click here to view more.
- Middle East & Africa Fire Safety Systems & Equipment Market Click here to view more.
- GCC Drone Market Click here to view more.
- Middle East Lighting Fixture Market Click here to view more.
- GCC Physical & Perimeter Security Market Click here to view more.