Georgia Cupric And Cuprous Chloride Market Outlook | Size, COVID-19 IMPACT, Share, Trends, Forecast, Industry, Companies, Revenue, Analysis, Growth & Value
Market Forecast By By Type (Copper(I) Chloride, Copper (II) Chloride, Others), By By Form (Powder, Crystal, Granular, Others), By By Packaging Type (Drums, Bag, Bottle, Others), By By Application (Fungicides, Blue Displays, Photography, Glass, Ceramics, Dye, Printing Fabrics, others), By By End-Use Industry (Building & Construction, Agriculture, Chemical & Petrochemicals, Textile & Apparel, Electronics, Others) And Competitive Landscape
| Product Code: ETC195132 | Publication Date: Jun 2023 | Updated Date: Jun 2026 | Product Type: Market Research Report | |
| Publisher: 6Wresearch | Author: Ravi Bhandari | No. of Pages: 60 | No. of Figures: 40 | No. of Tables: 7 |
Georgia Cupric And Cuprous Chloride Market Size, Share & Growth Rate
The Georgia Cupric And Cuprous Chloride Market was estimated at USD 105 Million in 2025 and is projected to reach USD 115 Million by 2032, growing at a CAGR of 1.3% from 2026 to 2032. This positive outlook is largely driven by the rising industrial applications of these compounds across various sectors including water treatment, electroplating, and chemical manufacturing. Additionally, Georgia's expanding manufacturing base and increased investments in sustainable industrial processes are expected to further fuel demand.
Georgia Cupric And Cuprous Chloride Market Growth Rate Analysis (2021-2032)
The Georgia cupric and cuprous chloride market in the U.S. has exhibited notable fluctuations in growth, reflective of evolving industrial demands and technological advancements. After contracting by 3.6% in 2021, the market rebounded robustly with growth rates of 5.2% in 2022 and 5.8% in 2023, driven largely by increased applications in agriculture and electronics. Despite a slight slowdown to 0.4% in 2024, growth is anticipated to stabilize, fueled by ongoing investments in infrastructure and a transition towards more sustainable practices. By 2028, the market is projected to achieve a growth rate of 2.0%, supported by steady consumer demand and innovations in production technologies, further contributing to its upward trend.
Georgia Cupric And Cuprous Chloride Market Year-wise Growth Rate and Key Drivers
This graph highlights how the Georgia Cupric And Cuprous Chloride Market has steadily grown over the past five years, supported by major growth factors.
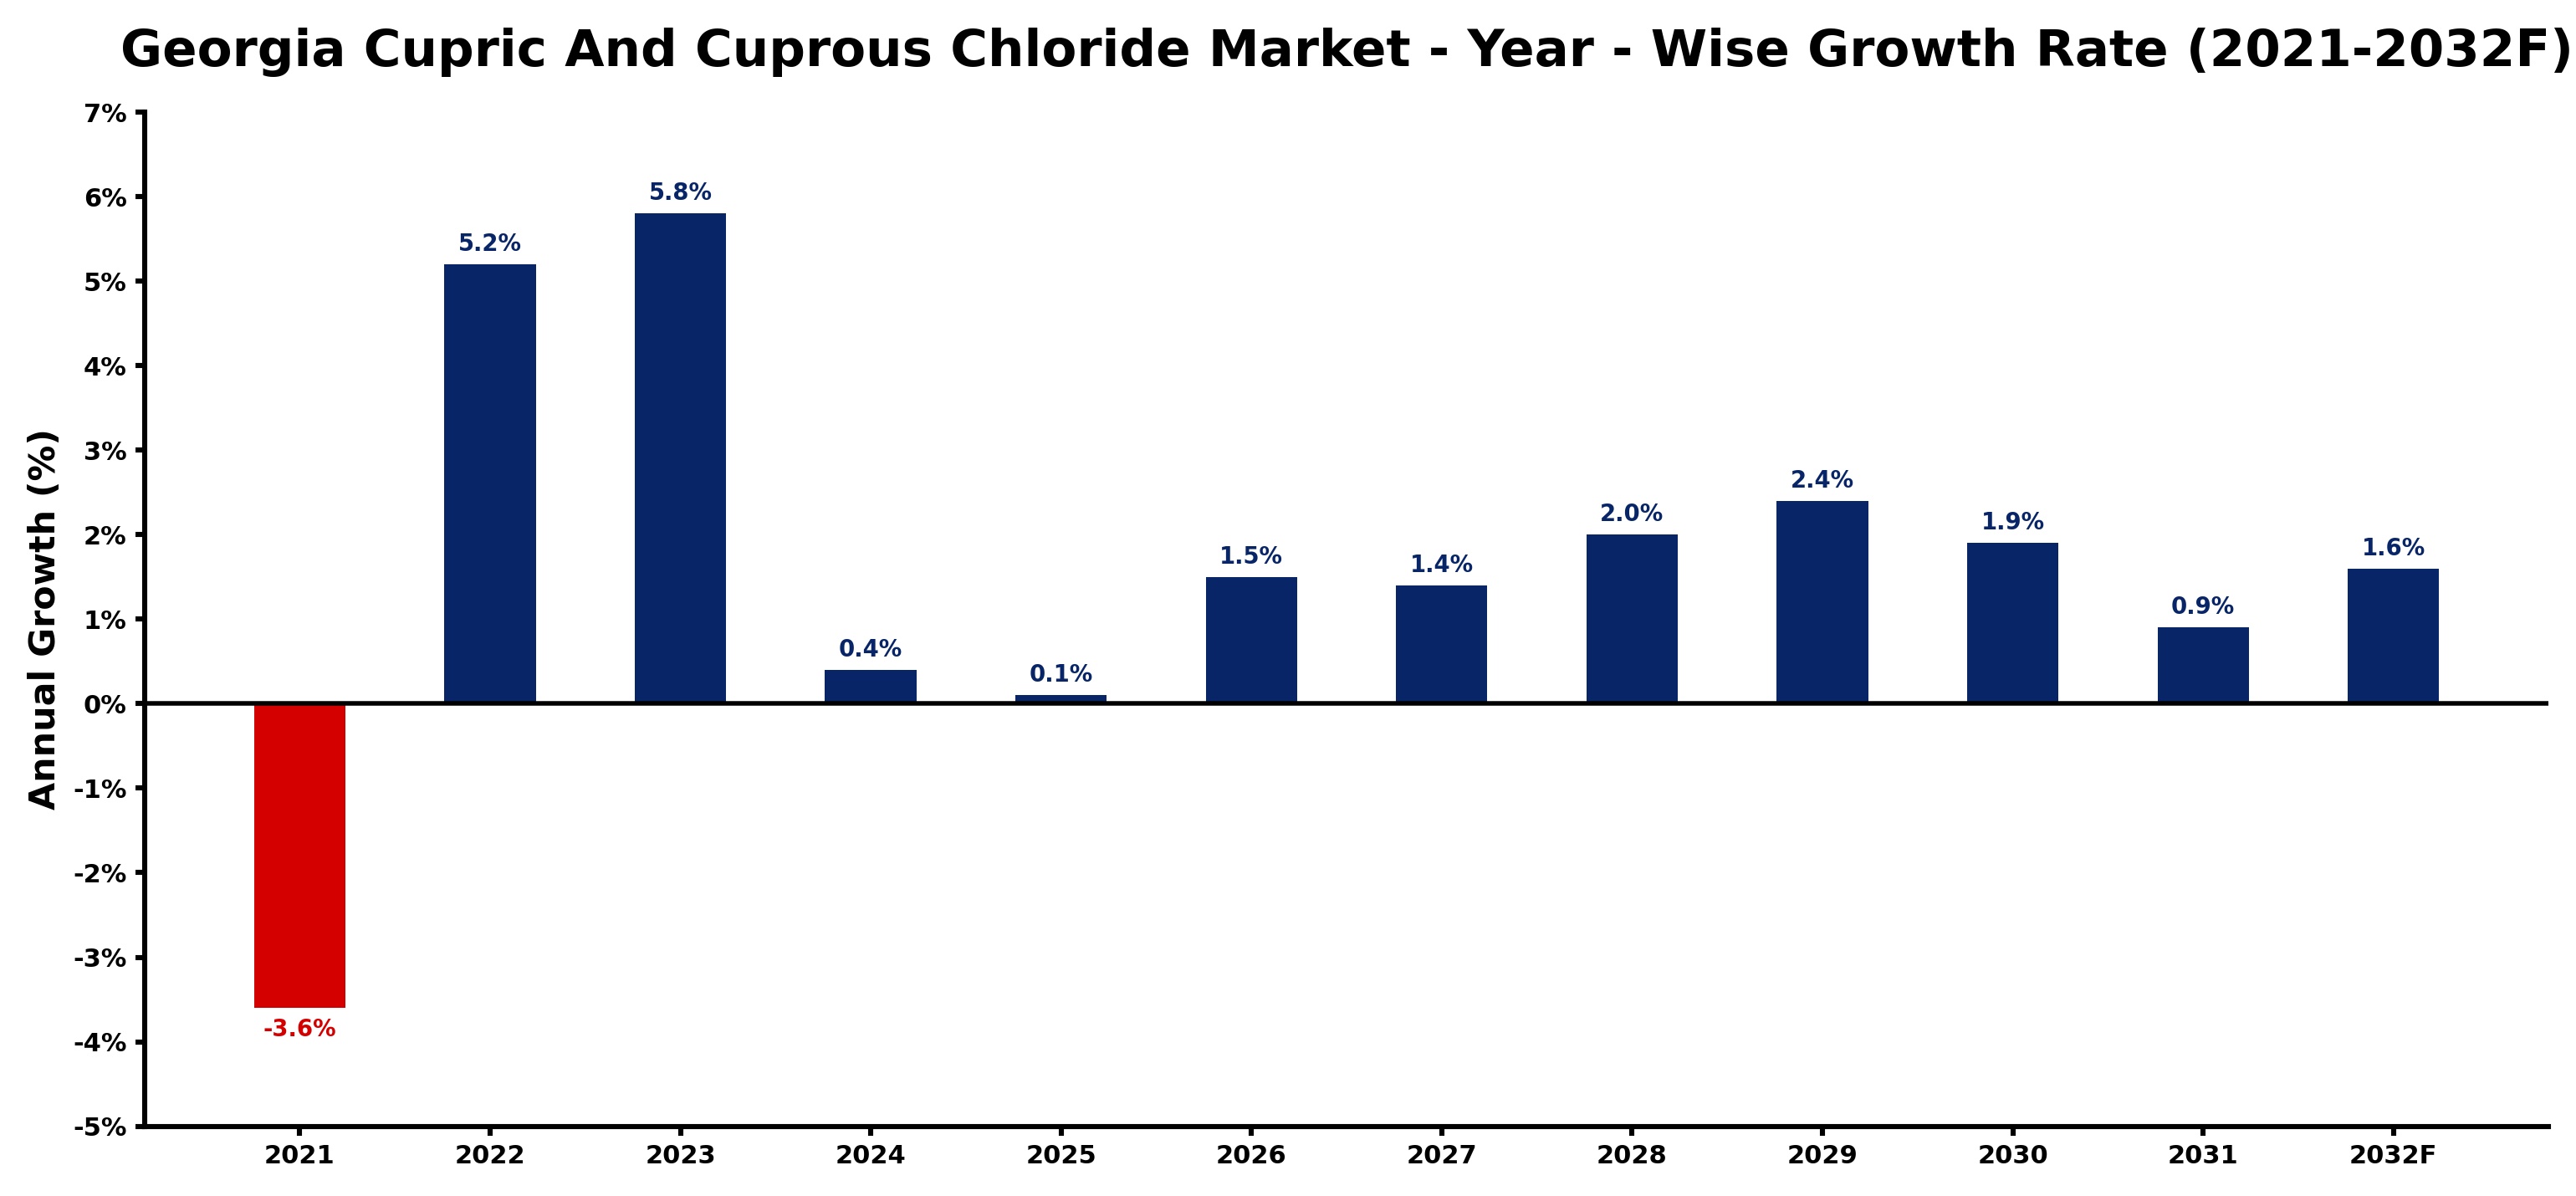
The table below presents the year‑wise growth rates along with the key drivers influencing the market
| Year | Growth Rate | Major Drivers |
| 2021 | -3.6% | Supply chain disruptions limited availability |
| 2022 | 5.2% | Manufacturing capacity increased significantly |
| 2023 | 5.8% | Export opportunities expanded rapidly |
| 2024 | 0.4% | New applications drove market interest |
| 2025 | 0.1% | Technological advancements enhanced production |
| 2026 | 1.5% | Sustainability initiatives gained traction |
| 2027 | 1.4% | Market diversification created new segments |
| 2028 | 2.0% | Consumer awareness of benefits increased |
| 2029 | 2.4% | Strategic partnerships enhanced distribution |
| 2030 | 1.9% | Regulatory support fostered growth |
| 2031 | 0.9% | Investment in R&D accelerated innovation |
| 2032 | 1.6% | Global demand for products expanded |
Note - Market size estimations and growth projections presented in this report are based on 6Wresearch’s advanced forecasting approach, validated with industry datasets as of June 2026.
Georgia Cupric And Cuprous Chloride Market Synopsis
The most influential factor currently shaping the Georgia Cupric And Cuprous Chloride Market is the increasing emphasis on water purification and environmental sustainability. As regulatory measures tighten and public awareness grows, industries are seeking effective and eco-friendly solutions, thereby driving demand for cupric and cuprous chloride.
Moreover, technological advancements in industrial applications are creating new avenues for growth. The integration of these compounds into modern manufacturing processes not only enhances product quality but also aligns with the strategic goals of companies focusing on sustainability and innovation.
Georgia Cupric And Cuprous Chloride Market Key Takeaways
- The market is projected to grow steadily due to rising industrial applications in key sectors.
- Water treatment and electroplating are the leading sectors driving demand for these chemicals.
- Technological advancements are paving the way for more efficient uses of cupric and cuprous chloride.
- Georgia's regulatory environment is increasingly favoring sustainable chemical solutions.
- Investments in the manufacturing sector are anticipated to bolster market growth.
Evaluation of Restraints in Georgia Cupric And Cuprous Chloride Market
Despite a generally optimistic outlook, several restraints could potentially limit the growth of the Georgia Cupric And Cuprous Chloride Market. Fluctuations in raw material prices can pose challenges for manufacturers, impacting their production costs and pricing strategies. Additionally, the need for adherence to stringent environmental regulations may complicate operational processes for some smaller players in the market, restricting their ability to compete effectively. The industry's reliance on traditional applications may also slow the adoption of newer technologies that could further enhance efficiency.
Georgia Cupric And Cuprous Chloride Market Trends
Current trends in the Georgia Cupric And Cuprous Chloride Market reflect a significant shift towards eco-friendly chemical processes. Companies are increasingly prioritizing the development of greener technologies that utilize cupric and cuprous chloride in environmentally sustainable ways. Additionally, the rise of automation in manufacturing is changing how these chemicals are used, increasing efficiency and reducing waste. Emerging applications, particularly in innovative sectors like renewable energy and biochemistry, are expected to broaden the market's scope further.
Georgia Cupric And Cuprous Chloride Market Opportunities
The Georgia Cupric And Cuprous Chloride Market presents several promising growth and investment opportunities. Expansion in sectors such as electronics manufacturing and new wastewater treatment technologies indicates a rising need for these chemicals. Additionally, collaboration between industry players and research institutions can lead to the development of advanced applications, enhancing market value. Companies looking to invest in sustainable practices or transition towards greener technologies are likely to find significant potential in the evolving landscape of this market.
Government Initiatives in the Georgia Cupric And Cuprous Chloride Market
Government initiatives in Georgia are increasingly focusing on environmental protection and industrial sustainability, positively influencing the cupric and cuprous chloride market. Regulatory frameworks encouraging the adoption of eco-friendly processes are gaining traction, motivating industries to invest in cleaner technologies. Public spending on water infrastructure and environmental projects also supports the growth of the market, making it an opportune time for stakeholders to align with governmental objectives.
Future Insights of the Georgia Cupric And Cuprous Chloride Market
Looking ahead to the period from 2026 to 2032, the Georgia Cupric And Cuprous Chloride Market is expected to evolve significantly. As new applications and technologies emerge, the demand for these compounds will likely diversify. Innovations in water treatment and the manufacturing of electronic components may play a critical role in shaping the market's future. By focusing on sustainability and efficiency, companies can position themselves favorably within a dynamic and expanding marketplace.
Georgia Cupric And Cuprous Chloride Market Latest Developments (May 2025 - June 2026)
Recent developments within the Georgia Cupric And Cuprous Chloride Market indicate a strong push towards innovation and sustainable practices. Various industries are actively exploring advanced applications of these chemicals, particularly in emerging technologies and eco-friendly manufacturing processes. Collaborative efforts between businesses and research entities are also on the rise, aimed at enhancing the efficiency and effectiveness of cupric and cuprous chloride in various applications.
Georgia Cupric And Cuprous Chloride Market - Key Attractiveness of the Report
- 10 Years of Market Numbers
- Historical Data Starting from 2022 to 2025
- Base Year: 2025
- Forecast Data until 2032
- Key Performance Indicators Impacting the Market
- Major Upcoming Developments and Projects
Key Highlights of the Report:
- Georgia Cupric And Cuprous Chloride Market Outlook
- Market Size of Georgia Cupric And Cuprous Chloride Market, 2025
- Forecast of Georgia Cupric And Cuprous Chloride Market, 2032
- Historical Data and Forecast of Georgia Cupric And Cuprous Chloride Revenues & Volume for the Period 2022-2032F
- Georgia Cupric And Cuprous Chloride Market Trend Evolution
- Georgia Cupric And Cuprous Chloride Market Drivers and Challenges
- Georgia Cupric And Cuprous Chloride Price Trends
- Georgia Cupric And Cuprous Chloride Porter's Five Forces
- Georgia Cupric And Cuprous Chloride Industry Life Cycle
- Historical Data and Forecast of Georgia Cupric And Cuprous Chloride Market Revenues & Volume By By Type for the Period 2022-2032F
- Historical Data and Forecast of Georgia Cupric And Cuprous Chloride Market Revenues & Volume By Copper(I) Chloride for the Period 2022-2032F
- Historical Data and Forecast of Georgia Cupric And Cuprous Chloride Market Revenues & Volume By Copper (II) Chloride for the Period 2022-2032F
- Historical Data and Forecast of Georgia Cupric And Cuprous Chloride Market Revenues & Volume By Others for the Period 2022-2032F
- Historical Data and Forecast of Georgia Cupric And Cuprous Chloride Market Revenues & Volume By By Form for the Period 2022-2032F
- Historical Data and Forecast of Georgia Cupric And Cuprous Chloride Market Revenues & Volume By Powder for the Period 2022-2032F
- Historical Data and Forecast of Georgia Cupric And Cuprous Chloride Market Revenues & Volume By Crystal for the Period 2022-2032F
- Historical Data and Forecast of Georgia Cupric And Cuprous Chloride Market Revenues & Volume By Granular for the Period 2022-2032F
- Historical Data and Forecast of Georgia Cupric And Cuprous Chloride Market Revenues & Volume By Others for the Period 2022-2032F
- Historical Data and Forecast of Georgia Cupric And Cuprous Chloride Market Revenues & Volume By By Packaging Type for the Period 2022-2032F
- Historical Data and Forecast of Georgia Cupric And Cuprous Chloride Market Revenues & Volume By Drums for the Period 2022-2032F
- Historical Data and Forecast of Georgia Cupric And Cuprous Chloride Market Revenues & Volume By Bag for the Period 2022-2032F
- Historical Data and Forecast of Georgia Cupric And Cuprous Chloride Market Revenues & Volume By Bottle for the Period 2022-2032F
- Historical Data and Forecast of Georgia Cupric And Cuprous Chloride Market Revenues & Volume By Others for the Period 2022-2032F
- Historical Data and Forecast of Georgia Cupric And Cuprous Chloride Market Revenues & Volume By By Application for the Period 2022-2032F
- Historical Data and Forecast of Georgia Cupric And Cuprous Chloride Market Revenues & Volume By Fungicides for the Period 2022-2032F
- Historical Data and Forecast of Georgia Cupric And Cuprous Chloride Market Revenues & Volume By Blue Displays for the Period 2022-2032F
- Historical Data and Forecast of Georgia Cupric And Cuprous Chloride Market Revenues & Volume By Photography for the Period 2022-2032F
- Historical Data and Forecast of Georgia Cupric And Cuprous Chloride Market Revenues & Volume By Glass for the Period 2022-2032F
- Historical Data and Forecast of Georgia Cupric And Cuprous Chloride Market Revenues & Volume By Ceramics for the Period 2022-2032F
- Historical Data and Forecast of Georgia Cupric And Cuprous Chloride Market Revenues & Volume By Dye for the Period 2022-2032F
- Historical Data and Forecast of Georgia Cupric And Cuprous Chloride Market Revenues & Volume By Printing Fabrics for the Period 2022-2032F
- Historical Data and Forecast of Georgia Cupric And Cuprous Chloride Market Revenues & Volume By others for the Period 2022-2032F
- Historical Data and Forecast of Georgia Cupric And Cuprous Chloride Market Revenues & Volume By By End-Use Industry for the Period 2022-2032F
- Historical Data and Forecast of Georgia Cupric And Cuprous Chloride Market Revenues & Volume By Building & Construction for the Period 2022-2032F
- Historical Data and Forecast of Georgia Cupric And Cuprous Chloride Market Revenues & Volume By Agriculture for the Period 2022-2032F
- Historical Data and Forecast of Georgia Cupric And Cuprous Chloride Market Revenues & Volume By Chemical & Petrochemicals for the Period 2022-2032F
- Historical Data and Forecast of Georgia Cupric And Cuprous Chloride Market Revenues & Volume By Textile & Apparel for the Period 2022-2032F
- Historical Data and Forecast of Georgia Cupric And Cuprous Chloride Market Revenues & Volume By Electronics for the Period 2022-2032F
- Historical Data and Forecast of Georgia Cupric And Cuprous Chloride Market Revenues & Volume By Others for the Period 2022-2032F
- Georgia Cupric And Cuprous Chloride Import Export Trade Statistics
- Market Opportunity Assessment By By Type
- Market Opportunity Assessment By By Form
- Market Opportunity Assessment By By Packaging Type
- Market Opportunity Assessment By By Application
- Market Opportunity Assessment By By End-Use Industry
- Georgia Cupric And Cuprous Chloride Top Companies Market Share
- Georgia Cupric And Cuprous Chloride Competitive Benchmarking By Technical and Operational Parameters
- Georgia Cupric And Cuprous Chloride Company Profiles
- Georgia Cupric And Cuprous Chloride Key Strategic Recommendations
Georgia Cupric And Cuprous Chloride Market - Frequently Asked Questions
The market was estimated at USD 105 Million in 2025 and is projected to reach USD 115 Million by 2032, growing at a CAGR of 1.3% from 2026 to 2032.
Technological advancements are enhancing the efficiency and effectiveness of cupric and cuprous chloride applications, particularly in sectors like water treatment and electroplating.
The primary consumers include industries involved in water treatment, electroplating, and chemical manufacturing, all of which are witnessing increased demand for these compounds.
Stricter environmental regulations are pushing industries to adopt more sustainable practices, which in turn enhances demand for eco-friendly applications of these chemicals.
Future trends include a shift towards greener technologies and innovations in applications, particularly in the electronics manufacturing sector, which is expected to broaden the market scope.
6Wresearch actively monitors the Georgia Cupric And Cuprous Chloride Market and publishes its comprehensive annual report, highlighting emerging trends, growth drivers, revenue analysis, and forecast outlook. Our insights help businesses to make data-backed strategic decisions with ongoing market dynamics. Our analysts track relevent industries related to the Georgia Cupric And Cuprous Chloride Market, allowing our clients with actionable intelligence and reliable forecasts tailored to emerging regional needs.
Yes, we provide customisation as per your requirements. To learn more, feel free to contact us on sales@6wresearch.com
1 Executive Summary |
2 Introduction |
2.1 Key Highlights of the Report |
2.2 Report Description |
2.3 Market Scope & Segmentation |
2.4 Research Methodology |
2.5 Assumptions |
3 Georgia Cupric And Cuprous Chloride Market Overview |
3.1 Georgia Country Macro Economic Indicators |
3.2 Georgia Cupric And Cuprous Chloride Market Revenues & Volume, 2022 & 2032F |
3.3 Georgia Cupric And Cuprous Chloride Market - Industry Life Cycle |
3.4 Georgia Cupric And Cuprous Chloride Market - Porter's Five Forces |
3.5 Georgia Cupric And Cuprous Chloride Market Revenues & Volume Share, By By Type, 2022 & 2032F |
3.6 Georgia Cupric And Cuprous Chloride Market Revenues & Volume Share, By By Form, 2022 & 2032F |
3.7 Georgia Cupric And Cuprous Chloride Market Revenues & Volume Share, By By Packaging Type, 2022 & 2032F |
3.8 Georgia Cupric And Cuprous Chloride Market Revenues & Volume Share, By By Application, 2022 & 2032F |
3.9 Georgia Cupric And Cuprous Chloride Market Revenues & Volume Share, By By End-Use Industry, 2022 & 2032F |
4 Georgia Cupric And Cuprous Chloride Market Dynamics |
4.1 Impact Analysis |
4.2 Market Drivers |
4.3 Market Restraints |
5 Georgia Cupric And Cuprous Chloride Market Trends |
6 Georgia Cupric And Cuprous Chloride Market, By Types |
6.1 Georgia Cupric And Cuprous Chloride Market, By By Type |
6.1.1 Overview and Analysis |
6.1.2 Georgia Cupric And Cuprous Chloride Market Revenues & Volume, By By Type, 2022-2032F |
6.1.3 Georgia Cupric And Cuprous Chloride Market Revenues & Volume, By Copper(I) Chloride, 2022-2032F |
6.1.4 Georgia Cupric And Cuprous Chloride Market Revenues & Volume, By Copper (II) Chloride, 2022-2032F |
6.1.5 Georgia Cupric And Cuprous Chloride Market Revenues & Volume, By Others, 2022-2032F |
6.2 Georgia Cupric And Cuprous Chloride Market, By By Form |
6.2.1 Overview and Analysis |
6.2.2 Georgia Cupric And Cuprous Chloride Market Revenues & Volume, By Powder, 2022-2032F |
6.2.3 Georgia Cupric And Cuprous Chloride Market Revenues & Volume, By Crystal, 2022-2032F |
6.2.4 Georgia Cupric And Cuprous Chloride Market Revenues & Volume, By Granular, 2022-2032F |
6.2.5 Georgia Cupric And Cuprous Chloride Market Revenues & Volume, By Others, 2022-2032F |
6.3 Georgia Cupric And Cuprous Chloride Market, By By Packaging Type |
6.3.1 Overview and Analysis |
6.3.2 Georgia Cupric And Cuprous Chloride Market Revenues & Volume, By Drums, 2022-2032F |
6.3.3 Georgia Cupric And Cuprous Chloride Market Revenues & Volume, By Bag, 2022-2032F |
6.3.4 Georgia Cupric And Cuprous Chloride Market Revenues & Volume, By Bottle, 2022-2032F |
6.3.5 Georgia Cupric And Cuprous Chloride Market Revenues & Volume, By Others, 2022-2032F |
6.4 Georgia Cupric And Cuprous Chloride Market, By By Application |
6.4.1 Overview and Analysis |
6.4.2 Georgia Cupric And Cuprous Chloride Market Revenues & Volume, By Fungicides, 2022-2032F |
6.4.3 Georgia Cupric And Cuprous Chloride Market Revenues & Volume, By Blue Displays, 2022-2032F |
6.4.4 Georgia Cupric And Cuprous Chloride Market Revenues & Volume, By Photography, 2022-2032F |
6.4.5 Georgia Cupric And Cuprous Chloride Market Revenues & Volume, By Glass, 2022-2032F |
6.4.6 Georgia Cupric And Cuprous Chloride Market Revenues & Volume, By Ceramics, 2022-2032F |
6.4.7 Georgia Cupric And Cuprous Chloride Market Revenues & Volume, By Dye, 2022-2032F |
6.4.8 Georgia Cupric And Cuprous Chloride Market Revenues & Volume, By others, 2022-2032F |
6.4.9 Georgia Cupric And Cuprous Chloride Market Revenues & Volume, By others, 2022-2032F |
6.5 Georgia Cupric And Cuprous Chloride Market, By By End-Use Industry |
6.5.1 Overview and Analysis |
6.5.2 Georgia Cupric And Cuprous Chloride Market Revenues & Volume, By Building & Construction, 2022-2032F |
6.5.3 Georgia Cupric And Cuprous Chloride Market Revenues & Volume, By Agriculture, 2022-2032F |
6.5.4 Georgia Cupric And Cuprous Chloride Market Revenues & Volume, By Chemical & Petrochemicals, 2022-2032F |
6.5.5 Georgia Cupric And Cuprous Chloride Market Revenues & Volume, By Textile & Apparel, 2022-2032F |
6.5.6 Georgia Cupric And Cuprous Chloride Market Revenues & Volume, By Electronics, 2022-2032F |
6.5.7 Georgia Cupric And Cuprous Chloride Market Revenues & Volume, By Others, 2022-2032F |
7 Georgia Cupric And Cuprous Chloride Market Import-Export Trade Statistics |
7.1 Georgia Cupric And Cuprous Chloride Market Export to Major Countries |
7.2 Georgia Cupric And Cuprous Chloride Market Imports from Major Countries |
8 Georgia Cupric And Cuprous Chloride Market Key Performance Indicators |
9 Georgia Cupric And Cuprous Chloride Market - Opportunity Assessment |
9.1 Georgia Cupric And Cuprous Chloride Market Opportunity Assessment, By By Type, 2022 & 2032F |
9.2 Georgia Cupric And Cuprous Chloride Market Opportunity Assessment, By By Form, 2022 & 2032F |
9.3 Georgia Cupric And Cuprous Chloride Market Opportunity Assessment, By By Packaging Type, 2022 & 2032F |
9.4 Georgia Cupric And Cuprous Chloride Market Opportunity Assessment, By By Application, 2022 & 2032F |
9.5 Georgia Cupric And Cuprous Chloride Market Opportunity Assessment, By By End-Use Industry, 2022 & 2032F |
10 Georgia Cupric And Cuprous Chloride Market - Competitive Landscape |
10.1 Georgia Cupric And Cuprous Chloride Market Revenue Share, By Companies, 2025 |
10.2 Georgia Cupric And Cuprous Chloride Market Competitive Benchmarking, By Operating and Technical Parameters |
11 Company Profiles |
12 Recommendations |
13 Disclaimer |
Global Go To Market Strategy - 2030
Export potential enables firms to identify high-growth global markets with greater confidence by combining advanced trade intelligence with a structured quantitative methodology. The framework analyzes emerging demand trends and country-level import patterns while integrating macroeconomic and trade datasets such as GDP and population forecasts, bilateral import–export flows, tariff structures, elasticity differentials between developed and developing economies, geographic distance, and import demand projections. Using weighted trade values from 2020–2024 as the base period to project country-to-country export potential for 2030, these inputs are operationalized through calculated drivers such as gravity model parameters, tariff impact factors, and projected GDP per-capita growth. Through an analysis of hidden potentials, demand hotspots, and market conditions that are most favorable to success, this method enables firms to focus on target countries, maximize returns, and global expansion with data, backed by accuracy.
By factoring in the projected importer demand gap that is currently unmet and could be potential opportunity, it identifies the potential for the Exporter (Country) among 190 countries, against the general trade analysis, which identifies the biggest importer or exporter.
To discover high-growth global markets and optimize your business strategy:
Click Here
Pricing
- Single User License$ 1,995
- Department License$ 2,400
- Site License$ 3,120
- Global License$ 3,795

Leadership Perspectives from Industry Events
Search
Thought Leadership and Analyst Meet


Our Clients
6WResearch In News
- India Air Conditioner Market Set for Strong Rebound in 2026 After Weather-Led Correction and GST-Driven Recovery: 6Wresearch
- ADAS in India: How Automatic Emergency Braking, Blind Spot Detection & Driver Monitoring are Transforming Road Safety
- Doha a strategic location for EV manufacturing hub: IPA Qatar
- Demand for luxury TVs surging in the GCC, says Samsung
- Empowering Growth: The Thriving Journey of Bangladesh’s Cable Industry
- Demand for luxury TVs surging in the GCC, says Samsung
Latest Reports
- Nicaragua RPG Gaming Market (2026-2032)
- New Zealand RPG Gaming Market (2026-2032)
- Netherlands RPG Gaming Market (2026-2032)
- Nauru RPG Gaming Market (2026-2032)
- Namibia RPG Gaming Market (2026-2032)
- Mozambique RPG Gaming Market (2026-2032)
- Montenegro RPG Gaming Market (2026-2032)
- Mongolia RPG Gaming Market (2026-2032)
- Monaco RPG Gaming Market (2026-2032)
- Micronesia RPG Gaming Market (2026-2032)
Industry Events and Analyst Meet

EV India Expo 2026

HIMTEX 2026

India Refining Summit 2026

India EV Show 2026

EV tech India Expo 2026
Whitepaper
- Middle East & Africa Commercial Security Market Click here to view more.
- Middle East & Africa Fire Safety Systems & Equipment Market Click here to view more.
- GCC Drone Market Click here to view more.
- Middle East Lighting Fixture Market Click here to view more.
- GCC Physical & Perimeter Security Market Click here to view more.