Georgia Gold Potassium Cyanide Market (2026-2032) Outlook | Forecast, Share, Trends, Companies, Growth, Analysis, Industry, Revenue, Value & Size
Market Forecast By Type (Low Purity, High Purity), By Applications (Electroplating of Metals, Decorative Costume Jewellery, Electronic Devices, Watches, Others) And Competitive Landscape
| Product Code: ETC196212 | Publication Date: May 2022 | Updated Date: Jun 2026 | Product Type: Market Research Report | |
| Publisher: 6Wresearch | Author: Sachin Kumar Rai | No. of Pages: 60 | No. of Figures: 40 | No. of Tables: 7 |
Georgia Gold Potassium Cyanide Market Size, Share & Growth Rate
The Georgia Gold Potassium Cyanide Market was estimated at USD 1064 Million in 2025 and is projected to reach USD 1509 Million by 2032, growing at a CAGR of 5.1% from 2026 to 2032. This growth is primarily fueled by the resurgence in gold mining activities within the state, spurred by heightened global demand for gold as a safe-haven asset. Additionally, expanding applications of potassium cyanide in sectors like electroplating are contributing to a robust outlook for this niche market.
Georgia Gold Potassium Cyanide Market Year-wise Growth Rate and Key Drivers
This graph highlights how the Georgia Gold Potassium Cyanide Market has steadily grown over the years, supported by major growth factors.
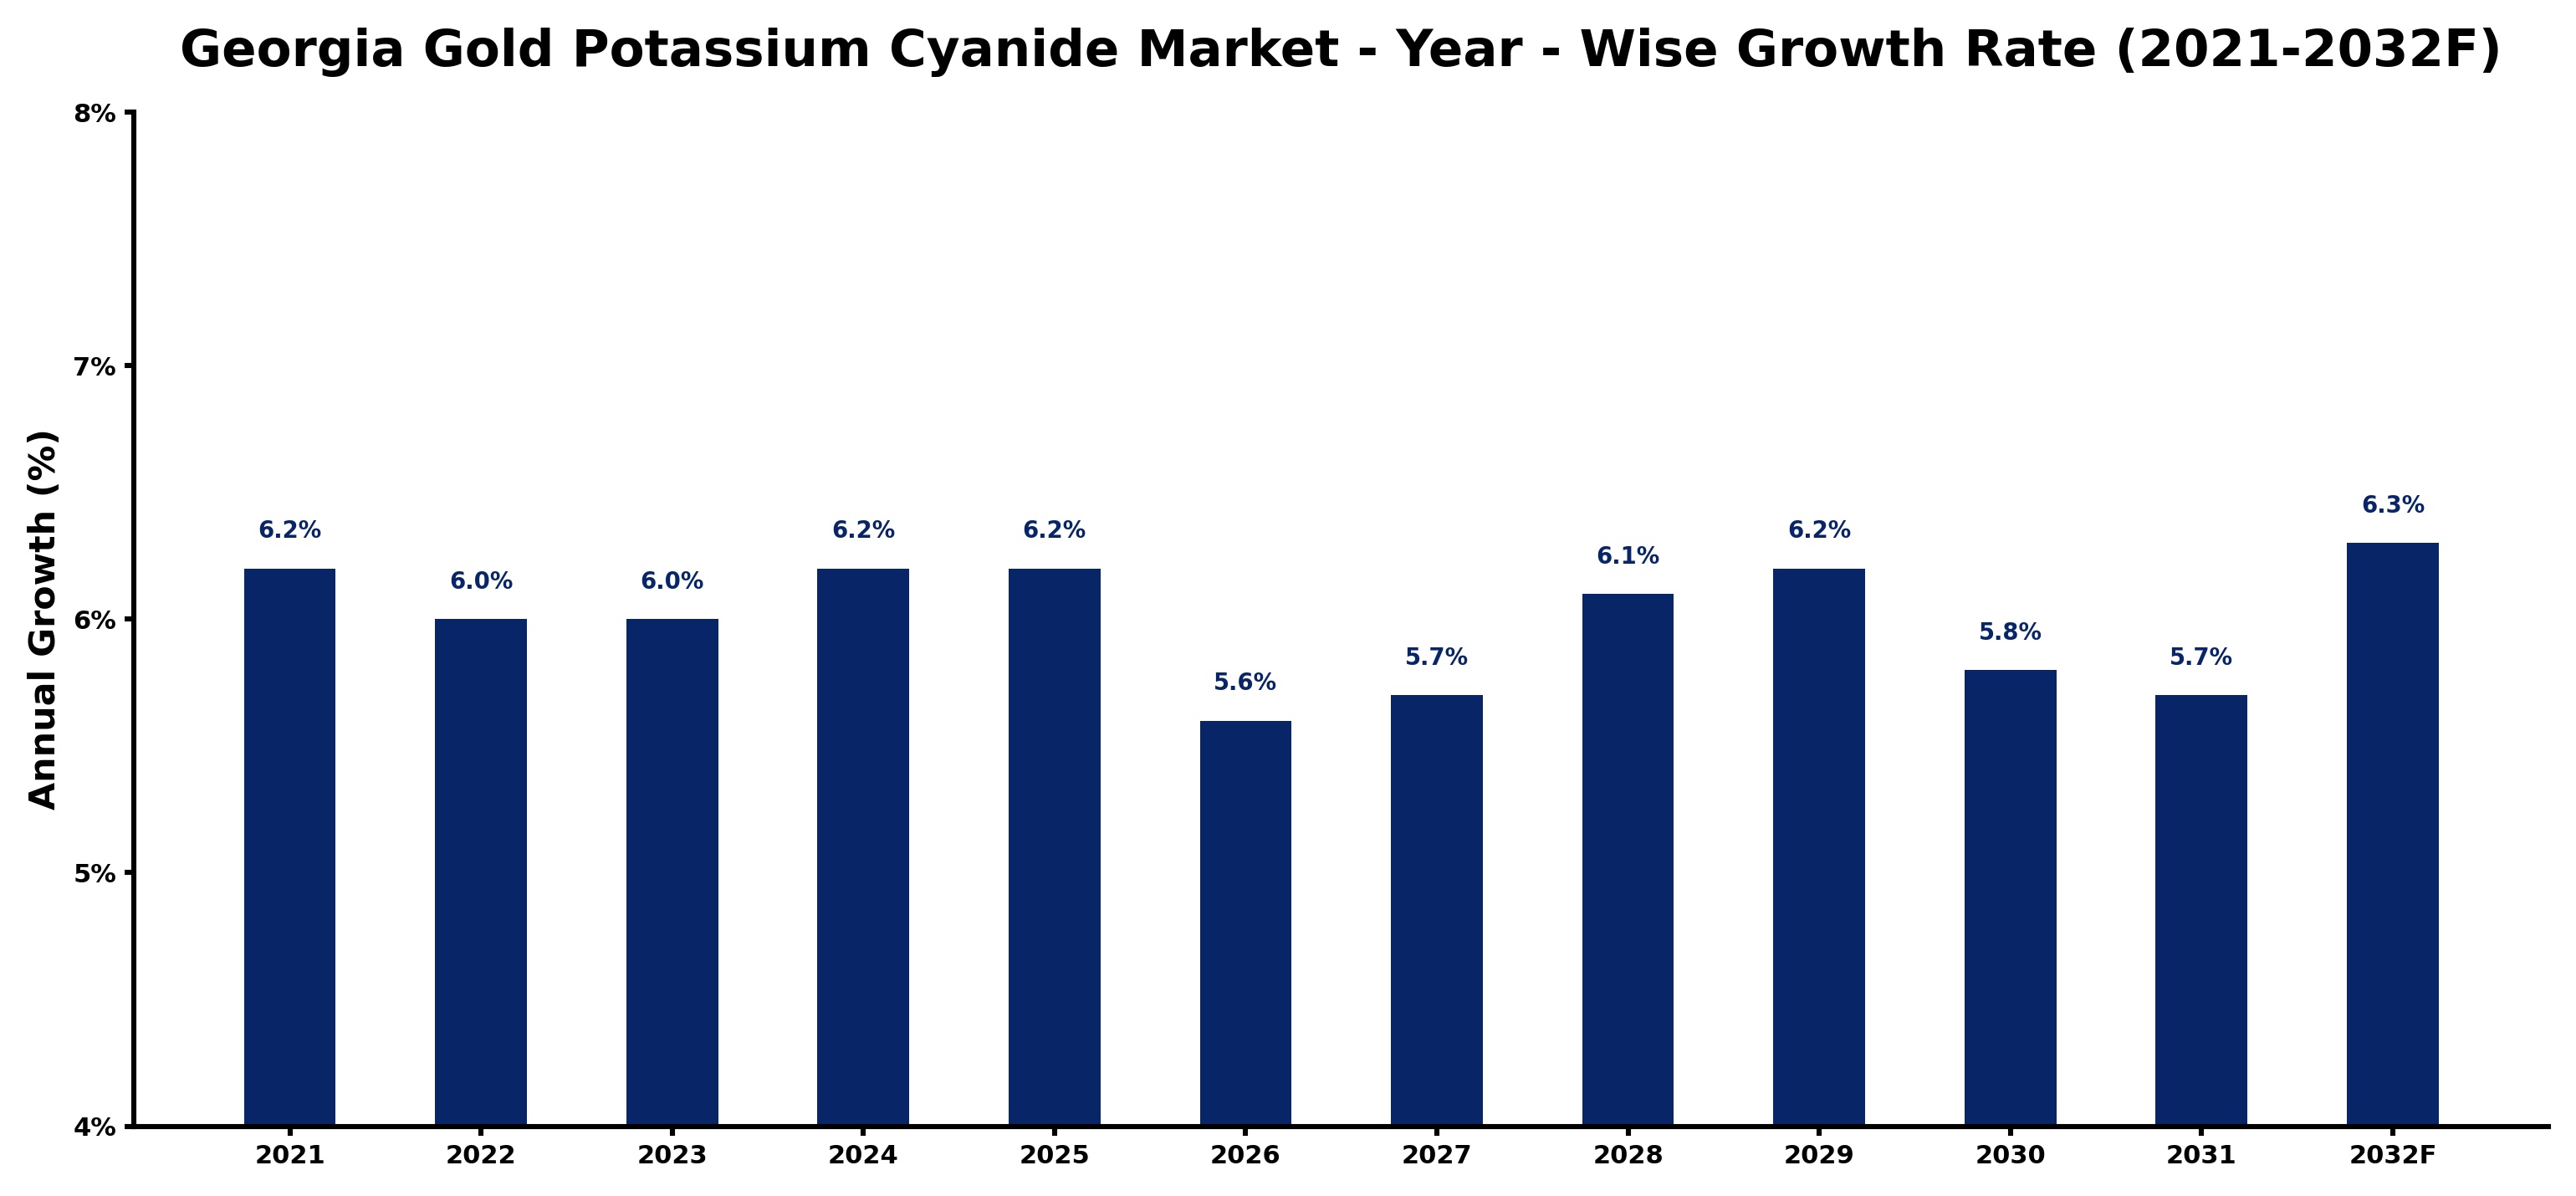
The table below presents the year‑wise growth rates along with the key drivers influencing the market
| Year | Growth Rate | Major Drivers |
| 2021 | 6.2% | Mining sector recovery accelerated demand |
| 2022 | 6.0% | Technological advancements enhanced production |
| 2023 | 6.0% | Increased regulatory support for mining |
| 2024 | 6.2% | Rising gold prices spurred interest |
| 2025 | 6.2% | Emerging markets expanded consumption base |
| 2026 | 5.6% | Sustainable mining practices gained traction |
| 2027 | 5.7% | Innovative extraction methods improved efficiency |
| 2028 | 6.1% | Global trade agreements facilitated exports |
| 2029 | 6.2% | R&D investments drove product innovation |
| 2030 | 5.8% | Consumer awareness of product benefits |
| 2031 | 5.7% | Strategic partnerships enhanced market reach |
| 2032 | 6.3% | Environmental initiatives attracted investments |
Note - Market size estimations and growth projections presented in this report are based on 6Wresearch’s advanced forecasting approach, validated with industry datasets as of June 2026.
Georgia Gold Potassium Cyanide Market Synopsis
The most significant force shaping the Georgia Gold Potassium Cyanide Market today is the booming gold mining sector. This surge is not only boosting local economic prospects but also enhancing demand for potassium cyanide, which is indispensable in the extraction process. As gold prices continue to reflect upward trends, mining operations are likely to intensify, further driving the consumption of potassium cyanide in the region.
Additionally, the market is being positively influenced by a growing emphasis on sustainability and eco-friendly practices in chemical manufacturing. Companies are innovating to comply with stricter environmental regulations while also meeting the needs of an evolving industrial landscape. This dual focus on safety and effectiveness is crucial for maintaining a competitive edge in the Georgia market.
Georgia Gold Potassium Cyanide Market Key Takeaways
- The market is predominantly driven by the growth of the gold mining sector in Georgia.
- Increasing demand for potassium cyanide in industrial applications is fostering market expansion.
- Sustainability efforts are prompting innovations in production and waste management practices.
- Strict regulatory frameworks govern the handling and distribution of potassium cyanide, ensuring safety.
- Investment opportunities are ripe as the market is projected to grow steadily through 2032.
Evaluation of Restraints in Georgia Gold Potassium Cyanide Market
Despite its growth potential, the Georgia Gold Potassium Cyanide Market faces considerable restraints. The stringent regulatory landscape surrounding the production and transportation of potassium cyanide poses challenges for manufacturers, necessitating adherence to extensive safety protocols. Moreover, the high cost and limited availability of raw materials impact the ability to offer competitive pricing, which can be a significant hurdle. The market's concentration, with a few major players holding significant market share, also makes it difficult for new entrants to carve out a position.
Georgia Gold Potassium Cyanide Market Trends
Current trends in the Georgia Gold Potassium Cyanide Market indicate a shift towards eco-friendly production methods and technologies. As companies look to improve their environmental footprints, the development of sustainable extraction processes is becoming increasingly paramount. Moreover, the industry is witnessing advancements in potassium cyanide's applications beyond gold mining, such as in the electronics sector, which is further diversifying demand and creating opportunities for growth.
Georgia Gold Potassium Cyanide Market Opportunities
There exists a wealth of investment opportunities within the Georgia Gold Potassium Cyanide Market, driven by rising gold demand across diverse sectors such as jewelry and electronics. Companies that specialize in innovative extraction technologies stand to gain significantly. Furthermore, investment in R&D for sustainable and efficient chemical processes presents an avenue for impactful growth. As regulatory frameworks evolve, the ability to adapt and align with new standards will create strategic advantages for key players in the market.
Government Initiatives in the Georgia Gold Potassium Cyanide Market
The Georgia government is actively involved in overseeing the Gold Potassium Cyanide Market through stringent regulations aimed at ensuring safety and environmental protection. Companies engaged in the production and distribution of potassium cyanide must comply with comprehensive licensing and safety protocols. These regulations not only mitigate health and environmental risks associated with this hazardous material but also promote responsible operational practices within the industry.
Future Insights of the Georgia Gold Potassium Cyanide Market
Looking ahead to 2026-2032, the Georgia Gold Potassium Cyanide Market is anticipated to maintain a steady growth trajectory. The enduring demand for gold, fueled by its status as a secure investment, will continue to drive potassium cyanide consumption in mining and refining processes. Additionally, advancements in technology and an increasing commitment to sustainability will likely shape the market dynamics, steering it towards eco-friendlier practices and alternative solutions, all of which bode well for the industry's future.
Georgia Gold Potassium Cyanide Market Latest Developments (May 2025 - June 2026)
Recent developments in the Georgia Gold Potassium Cyanide Market highlight a focus on innovation and adherence to evolving regulatory standards. Companies are investing in research to enhance potassium cyanide's applications while ensuring compliance with environmental safety regulations. Furthermore, there is a noticeable uptick in collaborative efforts aimed at improving sustainable practices, ensuring that the market is well-positioned to adapt to the challenges and opportunities of the next several years.
Georgia Gold Potassium Cyanide Market - Key Attractiveness of the Report
- 10 Years of Market Numbers
- Historical Data Starting from 2022 to 2025
- Base Year: 2025
- Forecast Data until 2032
- Key Performance Indicators Impacting the Market
- Major Upcoming Developments and Projects
Key Highlights of the Report:
- Georgia Gold Potassium Cyanide Market Outlook
- Market Size of Georgia Gold Potassium Cyanide Market, 2025
- Forecast of Georgia Gold Potassium Cyanide Market, 2032
- Historical Data and Forecast of Georgia Gold Potassium Cyanide Revenues & Volume for the Period 2022-2032F
- Georgia Gold Potassium Cyanide Market Trend Evolution
- Georgia Gold Potassium Cyanide Market Drivers and Challenges
- Georgia Gold Potassium Cyanide Price Trends
- Georgia Gold Potassium Cyanide Porter's Five Forces
- Georgia Gold Potassium Cyanide Industry Life Cycle
- Historical Data and Forecast of Georgia Gold Potassium Cyanide Market Revenues & Volume By Type for the Period 2022-2032F
- Historical Data and Forecast of Georgia Gold Potassium Cyanide Market Revenues & Volume By Low Purity for the Period 2022-2032F
- Historical Data and Forecast of Georgia Gold Potassium Cyanide Market Revenues & Volume By High Purity for the Period 2022-2032F
- Historical Data and Forecast of Georgia Gold Potassium Cyanide Market Revenues & Volume By Applications for the Period 2022-2032F
- Historical Data and Forecast of Georgia Gold Potassium Cyanide Market Revenues & Volume By Electroplating of Metals for the Period 2022-2032F
- Historical Data and Forecast of Georgia Gold Potassium Cyanide Market Revenues & Volume By Decorative Costume Jewellery for the Period 2022-2032F
- Historical Data and Forecast of Georgia Gold Potassium Cyanide Market Revenues & Volume By Electronic Devices for the Period 2022-2032F
- Historical Data and Forecast of Georgia Gold Potassium Cyanide Market Revenues & Volume By Watches for the Period 2022-2032F
- Historical Data and Forecast of Georgia Gold Potassium Cyanide Market Revenues & Volume By Others for the Period 2022-2032F
- Georgia Gold Potassium Cyanide Import Export Trade Statistics
- Market Opportunity Assessment By Type
- Market Opportunity Assessment By Applications
- Georgia Gold Potassium Cyanide Top Companies Market Share
- Georgia Gold Potassium Cyanide Competitive Benchmarking By Technical and Operational Parameters
- Georgia Gold Potassium Cyanide Company Profiles
- Georgia Gold Potassium Cyanide Key Strategic Recommendations
Georgia Gold Potassium Cyanide Market - Frequently Asked Questions
The market was estimated at USD 1064 Million in 2025 and is expected to reach USD 1509 Million by 2032, growing at a CAGR of 5.1% from 2026 to 2032.
Regulatory frameworks play a pivotal role in shaping market dynamics, as they impose strict guidelines on the handling and distribution of potassium cyanide to ensure safety and minimize environmental risks.
There is a growing emphasis on sustainability and innovative production practices that not only enhance safety but also meet the evolving demands of various industries utilizing potassium cyanide.
Beyond gold mining, potassium cyanide is witnessing rising demand in sectors such as electronics for applications like electroplating, which is expanding the market’s scope.
Investors can find significant opportunities in companies focusing on R&D for sustainable technologies, as well as in enterprises specializing in innovative extraction processes to capitalize on the growing demand for gold.
6Wresearch actively monitors the Georgia Gold Potassium Cyanide Market and publishes its comprehensive annual report, highlighting emerging trends, growth drivers, revenue analysis, and forecast outlook. Our insights help businesses to make data-backed strategic decisions with ongoing market dynamics. Our analysts track relevent industries related to the Georgia Gold Potassium Cyanide Market, allowing our clients with actionable intelligence and reliable forecasts tailored to emerging regional needs.
Yes, we provide customisation as per your requirements. To learn more, feel free to contact us on sales@6wresearch.com
1 Executive Summary |
2 Introduction |
2.1 Key Highlights of the Report |
2.2 Report Description |
2.3 Market Scope & Segmentation |
2.4 Research Methodology |
2.5 Assumptions |
3 Georgia Gold Potassium Cyanide Market Overview |
3.1 Georgia Country Macro Economic Indicators |
3.2 Georgia Gold Potassium Cyanide Market Revenues & Volume, 2022 & 2032F |
3.3 Georgia Gold Potassium Cyanide Market - Industry Life Cycle |
3.4 Georgia Gold Potassium Cyanide Market - Porter's Five Forces |
3.5 Georgia Gold Potassium Cyanide Market Revenues & Volume Share, By Type, 2022 & 2032F |
3.6 Georgia Gold Potassium Cyanide Market Revenues & Volume Share, By Applications, 2022 & 2032F |
4 Georgia Gold Potassium Cyanide Market Dynamics |
4.1 Impact Analysis |
4.2 Market Drivers |
4.2.1 Growing demand for gold potassium cyanide in the jewelry industry |
4.2.2 Increasing use of gold potassium cyanide in electroplating applications |
4.2.3 Rising adoption of gold potassium cyanide in the electronics industry for manufacturing components |
4.3 Market Restraints |
4.3.1 Stringent regulatory requirements for handling and storage of potassium cyanide |
4.3.2 Volatility in raw material prices, such as gold and cyanide |
4.3.3 Environmental concerns and regulations related to the use of cyanide in industrial processes |
5 Georgia Gold Potassium Cyanide Market Trends |
6 Georgia Gold Potassium Cyanide Market, By Types |
6.1 Georgia Gold Potassium Cyanide Market, By Type |
6.1.1 Overview and Analysis |
6.1.2 Georgia Gold Potassium Cyanide Market Revenues & Volume, By Type, 2022-2032F |
6.1.3 Georgia Gold Potassium Cyanide Market Revenues & Volume, By Low Purity, 2022-2032F |
6.1.4 Georgia Gold Potassium Cyanide Market Revenues & Volume, By High Purity, 2022-2032F |
6.2 Georgia Gold Potassium Cyanide Market, By Applications |
6.2.1 Overview and Analysis |
6.2.2 Georgia Gold Potassium Cyanide Market Revenues & Volume, By Electroplating of Metals, 2022-2032F |
6.2.3 Georgia Gold Potassium Cyanide Market Revenues & Volume, By Decorative Costume Jewellery, 2022-2032F |
6.2.4 Georgia Gold Potassium Cyanide Market Revenues & Volume, By Electronic Devices, 2022-2032F |
6.2.5 Georgia Gold Potassium Cyanide Market Revenues & Volume, By Watches, 2022-2032F |
6.2.6 Georgia Gold Potassium Cyanide Market Revenues & Volume, By Others, 2022-2032F |
7 Georgia Gold Potassium Cyanide Market Import-Export Trade Statistics |
7.1 Georgia Gold Potassium Cyanide Market Export to Major Countries |
7.2 Georgia Gold Potassium Cyanide Market Imports from Major Countries |
8 Georgia Gold Potassium Cyanide Market Key Performance Indicators |
8.1 Average selling price of gold potassium cyanide in the market |
8.2 Number of new applications or industries adopting the use of gold potassium cyanide |
8.3 Research and development investment in improving the efficiency and safety of gold potassium cyanide production |
9 Georgia Gold Potassium Cyanide Market - Opportunity Assessment |
9.1 Georgia Gold Potassium Cyanide Market Opportunity Assessment, By Type, 2022 & 2032F |
9.2 Georgia Gold Potassium Cyanide Market Opportunity Assessment, By Applications, 2022 & 2032F |
10 Georgia Gold Potassium Cyanide Market - Competitive Landscape |
10.1 Georgia Gold Potassium Cyanide Market Revenue Share, By Companies, 2025 |
10.2 Georgia Gold Potassium Cyanide Market Competitive Benchmarking, By Operating and Technical Parameters |
11 Company Profiles |
12 Recommendations |
13 Disclaimer |
Global Go To Market Strategy - 2030
Export potential enables firms to identify high-growth global markets with greater confidence by combining advanced trade intelligence with a structured quantitative methodology. The framework analyzes emerging demand trends and country-level import patterns while integrating macroeconomic and trade datasets such as GDP and population forecasts, bilateral import–export flows, tariff structures, elasticity differentials between developed and developing economies, geographic distance, and import demand projections. Using weighted trade values from 2020–2024 as the base period to project country-to-country export potential for 2030, these inputs are operationalized through calculated drivers such as gravity model parameters, tariff impact factors, and projected GDP per-capita growth. Through an analysis of hidden potentials, demand hotspots, and market conditions that are most favorable to success, this method enables firms to focus on target countries, maximize returns, and global expansion with data, backed by accuracy.
By factoring in the projected importer demand gap that is currently unmet and could be potential opportunity, it identifies the potential for the Exporter (Country) among 190 countries, against the general trade analysis, which identifies the biggest importer or exporter.
To discover high-growth global markets and optimize your business strategy:
Click Here
Pricing
- Single User License$ 1,995
- Department License$ 2,400
- Site License$ 3,120
- Global License$ 3,795

Leadership Perspectives from Industry Events
Search
Thought Leadership and Analyst Meet


Our Clients
6WResearch In News
- India Air Conditioner Market Set for Strong Rebound in 2026 After Weather-Led Correction and GST-Driven Recovery: 6Wresearch
- ADAS in India: How Automatic Emergency Braking, Blind Spot Detection & Driver Monitoring are Transforming Road Safety
- Doha a strategic location for EV manufacturing hub: IPA Qatar
- Demand for luxury TVs surging in the GCC, says Samsung
- Empowering Growth: The Thriving Journey of Bangladesh’s Cable Industry
- Demand for luxury TVs surging in the GCC, says Samsung
Latest Reports
- Nicaragua RPG Gaming Market (2026-2032)
- New Zealand RPG Gaming Market (2026-2032)
- Netherlands RPG Gaming Market (2026-2032)
- Nauru RPG Gaming Market (2026-2032)
- Namibia RPG Gaming Market (2026-2032)
- Mozambique RPG Gaming Market (2026-2032)
- Montenegro RPG Gaming Market (2026-2032)
- Mongolia RPG Gaming Market (2026-2032)
- Monaco RPG Gaming Market (2026-2032)
- Micronesia RPG Gaming Market (2026-2032)
Industry Events and Analyst Meet

EV India Expo 2026

HIMTEX 2026

India Refining Summit 2026

India EV Show 2026

EV tech India Expo 2026
Whitepaper
- Middle East & Africa Commercial Security Market Click here to view more.
- Middle East & Africa Fire Safety Systems & Equipment Market Click here to view more.
- GCC Drone Market Click here to view more.
- Middle East Lighting Fixture Market Click here to view more.
- GCC Physical & Perimeter Security Market Click here to view more.