Georgia Hemp Clothing Market Outlook | COVID-19 IMPACT, Value, Size, Industry, Revenue, Trends, Analysis, Companies, Share, Growth & Forecast
Market Forecast By Raw Product (Hemp Seeds, Hemp Fiber, Hemp Shivs, Stalks), By Source (Conventional (Natural) Hemp Source, Organic Hemp Source), By Application (Fabrics, Denim, Fine Textiles, Canvas Bags, Carpets, Geotextiles), By Processing Technique (European Enzyme-Treated Fiber, Chinese Fiber, NRC Enzyme-Treated Fiber) And Competitive Landscape
| Product Code: ETC237840 | Publication Date: Jun 2023 | Updated Date: Jul 2026 | Product Type: Market Research Report | |
| Publisher: 6Wresearch | Author: Ravi Bhandari | No. of Pages: 75 | No. of Figures: 35 | No. of Tables: 20 |
Georgia Hemp Clothing Market Size, Share & Growth Rate
The Georgia Hemp Clothing Market was estimated at USD 1197 Million in 2025 and is projected to reach USD 1743 Million by 2032, growing at a CAGR of 5.5% from 2026 to 2032. This promising trajectory is largely driven by increasing consumer awareness of the environmental advantages of hemp textiles, which are sustainable and biodegradable. Furthermore, the recent legislative changes permitting local industrial hemp cultivation will facilitate a robust supply chain, positioning Georgia as a pivotal player in the hemp clothing sector.
Georgia Hemp Clothing Market Growth Rate Analysis (2021-2032)
The Georgia hemp clothing market has experienced stable growth, registering a yearly increase of 6.7% in 2021 and easing slightly to 6.4% in 2022. This trend reflects an expanding consumer demand for sustainable fashion, further fueled by heightened awareness of environmental issues. In 2023 and 2024, growth stabilized at 6.5%, supported by ongoing investments in hemp cultivation and processing infrastructure. The market is expected to maintain a steady course, with minor fluctuations, such as a dip to 6.2% in 2025 due to market saturation concerns. However, a resurgence to 6.7% is anticipated by 2030, driven by innovations in manufacturing technology and favorable policy developments that bolster the hemp sector.
Georgia Hemp Clothing Market Year-wise Growth Rate and Key Drivers
This graph highlights how the Georgia Hemp Clothing Market has steadily grown over the past five years, supported by major growth factors.
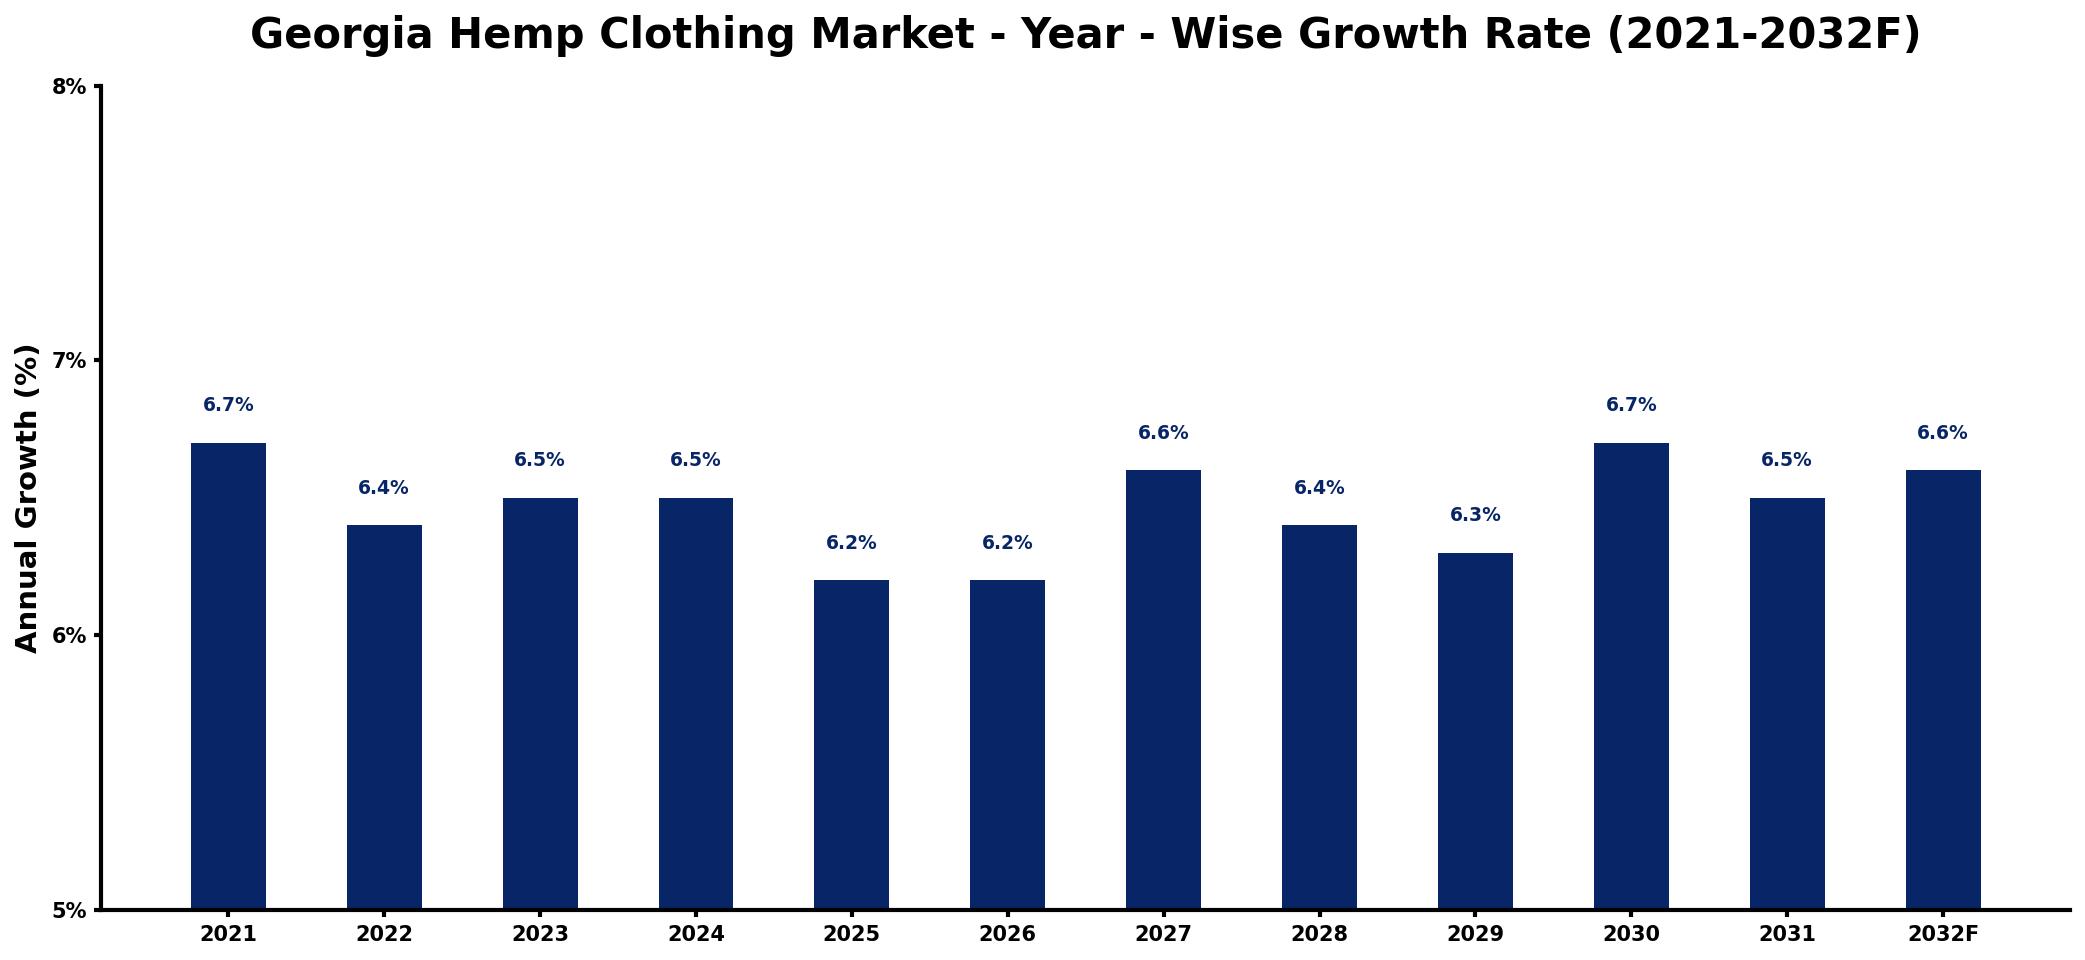
The table below presents the year‑wise growth rates along with the key drivers influencing the market
| Year | Growth Rate | Major Drivers |
| 2021 | 6.7% | Rising consumer sustainability awareness |
| 2022 | 6.4% | Increased investment in fiber technology |
| 2023 | 6.5% | Growing demand for eco-friendly textiles |
| 2024 | 6.5% | Expansion of retail distribution channels |
| 2025 | 6.2% | Strengthening partnerships with manufacturers |
| 2026 | 6.2% | Emerging trends in sustainable fashion |
| 2027 | 6.6% | Enhanced marketing strategies for awareness |
| 2028 | 6.4% | Increased adoption by eco-conscious brands |
| 2029 | 6.3% | Growing popularity of alternative fibers |
| 2030 | 6.7% | Strengthened online sales platforms |
| 2031 | 6.5% | Rising interest in renewable resources |
| 2032 | 6.6% | Increased collaboration with designers |
Note: Market size estimations and growth projections presented in this report are based on 6Wresearch's proprietary forecasting methodology, utilizing the latest available industry data, government publications, and primary research inputs.
Georgia Hemp Clothing Market Synopsis
The Georgia Hemp Clothing Market is witnessing a remarkable transformation, characterized by a surge in both consumer interest and production capabilities. The states favorable climate and growing support for sustainable agriculture are catalyzing the expansion of hemp cultivation, enhancing the local textile industry's potential.
As eco-consciousness rises among consumers, hemp clothing is being embraced not only for its eco-friendly properties but also for its durability and comfort. This burgeoning demand is reflected in the markets expansion, positioning Georgia as a competitive hub for hemp-based textiles.
Georgia Hemp Clothing Market Key Takeaways
- Increased legislative support is paving the way for the cultivation and manufacturing of hemp textiles.
- Consumer demand for sustainable and environmentally-friendly clothing is driving market growth.
- The local production of hemp is expected to reduce reliance on imported materials.
- Technological advancements in processing are enhancing the quality and appeal of hemp clothing.
- Strategic partnerships among local farmers and manufacturers are strengthening the supply chain.
Evaluation of Restraints in Georgia Hemp Clothing Market
Despite the optimistic outlook, several restraints could hinder the growth of the Georgia Hemp Clothing Market. Primarily, the nascent stage of local hemp farming may pose challenges in terms of scale and expertise. Additionally, consumer misconceptions about hemp products can impede widespread acceptance. Market players must also navigate the complexities of establishing a complete supply chain, from cultivation to retail, which remains a daunting task for new entrants in the industry.
Georgia Hemp Clothing Market Trends
The trend towards sustainability is fundamentally reshaping the clothing industry, with hemp textiles at the forefront. Consumers are increasingly gravitating towards brands that emphasize environmental responsibility, and hemps natural properties position it as a preferred alternative. Moreover, innovations in textile technology are enhancing the versatility of hemp fabrics, leading to a broader range of apparel options, from casual wear to high-fashion pieces.
Social media and influencer culture are playing significant roles in promoting hemp clothing, further igniting interest and awareness. Collaborations between eco-conscious brands and local artisans are also emerging, showcasing the unique attributes of hemp while supporting local economies.
Georgia Hemp Clothing Market Opportunities
The opportunities within the Georgia Hemp Clothing Market are abundant, particularly for entrepreneurs willing to innovate. As more consumers seek sustainable options, there is potential for new brands to enter the market with unique offerings that highlight the benefits of hemp. Additionally, expanding educational initiatives regarding the environmental impact of textiles can enhance consumer understanding and drive demand. Strategic investments in sustainable practices and local partnerships can further capitalize on the growing trend towards eco-friendly clothing.
Government Initiatives in the Georgia Hemp Clothing Market
Georgia's government has been actively supporting the hemp industry through various initiatives aimed at fostering growth and sustainability. Recent legislation has opened the door for farmers to cultivate industrial hemp, enhancing agricultural diversity. Additionally, public spending on research and development initiatives is helping to improve processing technologies and product quality, further promoting the state as a leader in hemp cultivation and textile production.
Future Insights of the Georgia Hemp Clothing Market
Looking ahead to 2026-2032, the Georgia Hemp Clothing Market is poised for substantial growth driven by continued legislative support and rising consumer demand for sustainable products. As the local supply chain matures, manufacturers will likely invest in expanding their operations and refining their offerings. This evolution will not only enhance market competitiveness but also solidify Georgia's reputation as a significant player in the hemp clothing landscape.
Georgia Hemp Clothing Market Latest Developments (2025 - 2026)
Recent developments in the Georgia Hemp Clothing Market showcase an increasing commitment to sustainable practices. Local manufacturers are actively participating in initiatives aimed at improving production processes, with an emphasis on reducing environmental impact. Additionally, collaborations between fashion designers and hemp growers are emerging, resulting in innovative product lines that highlight the benefits of hemp textiles. As consumer interest continues to rise, market players are expected to ramp up their marketing efforts to promote awareness and educate potential buyers.
Georgia Hemp Clothing Market - Key Attractiveness of the Report
- 10 Years of Market Numbers
- Historical Data Starting from 2022 to 2025
- Base Year: 2025
- Forecast Data until 2032
- Key Performance Indicators Impacting the Market
- Major Upcoming Developments and Projects
Key Highlights of the Report:
- Georgia Hemp Clothing Market Outlook
- Market Size of Georgia Hemp Clothing Market, 2025
- Forecast of Georgia Hemp Clothing Market, 2032
- Historical Data and Forecast of Georgia Hemp Clothing Revenues & Volume for the Period 2022-2032F
- Georgia Hemp Clothing Market Trend Evolution
- Georgia Hemp Clothing Market Drivers and Challenges
- Georgia Hemp Clothing Price Trends
- Georgia Hemp Clothing Porter's Five Forces
- Georgia Hemp Clothing Industry Life Cycle
- Historical Data and Forecast of Georgia Hemp Clothing Market Revenues & Volume By Raw Product for the Period 2022-2032F
- Historical Data and Forecast of Georgia Hemp Clothing Market Revenues & Volume By Hemp Seeds for the Period 2022-2032F
- Historical Data and Forecast of Georgia Hemp Clothing Market Revenues & Volume By Hemp Fiber for the Period 2022-2032F
- Historical Data and Forecast of Georgia Hemp Clothing Market Revenues & Volume By Hemp Shivs for the Period 2022-2032F
- Historical Data and Forecast of Georgia Hemp Clothing Market Revenues & Volume By Stalks for the Period 2022-2032F
- Historical Data and Forecast of Georgia Hemp Clothing Market Revenues & Volume By Source for the Period 2022-2032F
- Historical Data and Forecast of Georgia Hemp Clothing Market Revenues & Volume By Conventional (Natural) Hemp Source for the Period 2022-2032F
- Historical Data and Forecast of Georgia Hemp Clothing Market Revenues & Volume By Organic Hemp Source for the Period 2022-2032F
- Historical Data and Forecast of Georgia Hemp Clothing Market Revenues & Volume By Application for the Period 2022-2032F
- Historical Data and Forecast of Georgia Hemp Clothing Market Revenues & Volume By Fabrics for the Period 2022-2032F
- Historical Data and Forecast of Georgia Hemp Clothing Market Revenues & Volume By Denim for the Period 2022-2032F
- Historical Data and Forecast of Georgia Hemp Clothing Market Revenues & Volume By Fine Textiles for the Period 2022-2032F
- Historical Data and Forecast of Georgia Hemp Clothing Market Revenues & Volume By Canvas Bags for the Period 2022-2032F
- Historical Data and Forecast of Georgia Hemp Clothing Market Revenues & Volume By Carpets for the Period 2022-2032F
- Historical Data and Forecast of Georgia Hemp Clothing Market Revenues & Volume By Geotextiles for the Period 2022-2032F
- Historical Data and Forecast of Georgia Hemp Clothing Market Revenues & Volume By Processing Technique for the Period 2022-2032F
- Historical Data and Forecast of Georgia Hemp Clothing Market Revenues & Volume By European Enzyme-Treated Fiber for the Period 2022-2032F
- Historical Data and Forecast of Georgia Hemp Clothing Market Revenues & Volume By Chinese Fiber for the Period 2022-2032F
- Historical Data and Forecast of Georgia Hemp Clothing Market Revenues & Volume By NRC Enzyme-Treated Fiber for the Period 2022-2032F
- Georgia Hemp Clothing Import Export Trade Statistics
- Market Opportunity Assessment By Raw Product
- Market Opportunity Assessment By Source
- Market Opportunity Assessment By Application
- Market Opportunity Assessment By Processing Technique
- Georgia Hemp Clothing Top Companies Market Share
- Georgia Hemp Clothing Competitive Benchmarking By Technical and Operational Parameters
- Georgia Hemp Clothing Company Profiles
- Georgia Hemp Clothing Key Strategic Recommendations
Frequently Asked Questions About the Market Study (FAQs):
The Georgia Hemp Clothing Market is estimated to be USD 1197 Million in 2025, and it is projected to reach USD 1743 Million by 2032, growing at a CAGR of 5.5% from 2026 to 2032.
Recent legislative changes permitting industrial hemp cultivation have significantly bolstered local production capabilities, creating a strong foundation for the hemp clothing market in Georgia.
The growing consumer interest is driven by increased awareness of sustainability and the environmental benefits of hemp textiles, which are biodegradable and less resource-intensive than traditional fabrics.
New entrants can capitalize on the demand for unique, eco-friendly clothing lines, leverage local partnerships, and engage in educational initiatives to build consumer understanding of hemp's benefits.
Local cultivation fosters a self-sufficient supply chain, reducing reliance on imports, while also supporting local farmers and boosting the regional economy.
6Wresearch actively monitors the Georgia Hemp Clothing Market and publishes its comprehensive annual report, highlighting emerging trends, growth drivers, revenue analysis, and forecast outlook. Our insights help businesses to make data-backed strategic decisions with ongoing market dynamics. Our analysts track relevent industries related to the Georgia Hemp Clothing Market, allowing our clients with actionable intelligence and reliable forecasts tailored to emerging regional needs.
Yes, we provide customisation as per your requirements. To learn more, feel free to contact us on sales@6wresearch.com
1 Executive Summary |
2 Introduction |
2.1 Key Highlights of the Report |
2.2 Report Description |
2.3 Market Scope & Segmentation |
2.4 Research Methodology |
2.5 Assumptions |
3 Georgia Hemp Clothing Market Overview |
3.1 Georgia Country Macro Economic Indicators |
3.2 Georgia Hemp Clothing Market Revenues & Volume, 2022 & 2032F |
3.3 Georgia Hemp Clothing Market - Industry Life Cycle |
3.4 Georgia Hemp Clothing Market - Porter's Five Forces |
3.5 Georgia Hemp Clothing Market Revenues & Volume Share, By Raw Product, 2022 & 2032F |
3.6 Georgia Hemp Clothing Market Revenues & Volume Share, By Source, 2022 & 2032F |
3.7 Georgia Hemp Clothing Market Revenues & Volume Share, By Application, 2022 & 2032F |
3.8 Georgia Hemp Clothing Market Revenues & Volume Share, By Processing Technique, 2022 & 2032F |
4 Georgia Hemp Clothing Market Dynamics |
4.1 Impact Analysis |
4.2 Market Drivers |
4.3 Market Restraints |
5 Georgia Hemp Clothing Market Trends |
6 Georgia Hemp Clothing Market, By Types |
6.1 Georgia Hemp Clothing Market, By Raw Product |
6.1.1 Overview and Analysis |
6.1.2 Georgia Hemp Clothing Market Revenues & Volume, By Raw Product, 2022-2032F |
6.1.3 Georgia Hemp Clothing Market Revenues & Volume, By Hemp Seeds, 2022-2032F |
6.1.4 Georgia Hemp Clothing Market Revenues & Volume, By Hemp Fiber, 2022-2032F |
6.1.5 Georgia Hemp Clothing Market Revenues & Volume, By Hemp Shivs, 2022-2032F |
6.1.6 Georgia Hemp Clothing Market Revenues & Volume, By Stalks, 2022-2032F |
6.2 Georgia Hemp Clothing Market, By Source |
6.2.1 Overview and Analysis |
6.2.2 Georgia Hemp Clothing Market Revenues & Volume, By Conventional (Natural) Hemp Source, 2022-2032F |
6.2.3 Georgia Hemp Clothing Market Revenues & Volume, By Organic Hemp Source, 2022-2032F |
6.3 Georgia Hemp Clothing Market, By Application |
6.3.1 Overview and Analysis |
6.3.2 Georgia Hemp Clothing Market Revenues & Volume, By Fabrics, 2022-2032F |
6.3.3 Georgia Hemp Clothing Market Revenues & Volume, By Denim, 2022-2032F |
6.3.4 Georgia Hemp Clothing Market Revenues & Volume, By Fine Textiles, 2022-2032F |
6.3.5 Georgia Hemp Clothing Market Revenues & Volume, By Canvas Bags, 2022-2032F |
6.3.6 Georgia Hemp Clothing Market Revenues & Volume, By Carpets, 2022-2032F |
6.3.7 Georgia Hemp Clothing Market Revenues & Volume, By Geotextiles, 2022-2032F |
6.4 Georgia Hemp Clothing Market, By Processing Technique |
6.4.1 Overview and Analysis |
6.4.2 Georgia Hemp Clothing Market Revenues & Volume, By European Enzyme-Treated Fiber, 2022-2032F |
6.4.3 Georgia Hemp Clothing Market Revenues & Volume, By Chinese Fiber, 2022-2032F |
6.4.4 Georgia Hemp Clothing Market Revenues & Volume, By NRC Enzyme-Treated Fiber, 2022-2032F |
7 Georgia Hemp Clothing Market Import-Export Trade Statistics |
7.1 Georgia Hemp Clothing Market Export to Major Countries |
7.2 Georgia Hemp Clothing Market Imports from Major Countries |
8 Georgia Hemp Clothing Market Key Performance Indicators |
9 Georgia Hemp Clothing Market - Opportunity Assessment |
9.1 Georgia Hemp Clothing Market Opportunity Assessment, By Raw Product, 2022 & 2032F |
9.2 Georgia Hemp Clothing Market Opportunity Assessment, By Source, 2022 & 2032F |
9.3 Georgia Hemp Clothing Market Opportunity Assessment, By Application, 2022 & 2032F |
9.4 Georgia Hemp Clothing Market Opportunity Assessment, By Processing Technique, 2022 & 2032F |
10 Georgia Hemp Clothing Market - Competitive Landscape |
10.1 Georgia Hemp Clothing Market Revenue Share, By Companies, 2025 |
10.2 Georgia Hemp Clothing Market Competitive Benchmarking, By Operating and Technical Parameters |
11 Company Profiles |
12 Recommendations |
13 Disclaimer |
Global Go To Market Strategy - 2030
Export potential enables firms to identify high-growth global markets with greater confidence by combining advanced trade intelligence with a structured quantitative methodology. The framework analyzes emerging demand trends and country-level import patterns while integrating macroeconomic and trade datasets such as GDP and population forecasts, bilateral import–export flows, tariff structures, elasticity differentials between developed and developing economies, geographic distance, and import demand projections. Using weighted trade values from 2020–2024 as the base period to project country-to-country export potential for 2030, these inputs are operationalized through calculated drivers such as gravity model parameters, tariff impact factors, and projected GDP per-capita growth. Through an analysis of hidden potentials, demand hotspots, and market conditions that are most favorable to success, this method enables firms to focus on target countries, maximize returns, and global expansion with data, backed by accuracy.
By factoring in the projected importer demand gap that is currently unmet and could be potential opportunity, it identifies the potential for the Exporter (Country) among 190 countries, against the general trade analysis, which identifies the biggest importer or exporter.
To discover high-growth global markets and optimize your business strategy:
Click Here
Pricing
- Single User License$ 1,995
- Department License$ 2,400
- Site License$ 3,120
- Global License$ 3,795

Leadership Perspectives from Industry Events
Search
Thought Leadership and Analyst Meet


Our Clients
6WResearch In News
- India Air Conditioner Market Set for Strong Rebound in 2026 After Weather-Led Correction and GST-Driven Recovery: 6Wresearch
- ADAS in India: How Automatic Emergency Braking, Blind Spot Detection & Driver Monitoring are Transforming Road Safety
- Doha a strategic location for EV manufacturing hub: IPA Qatar
- Demand for luxury TVs surging in the GCC, says Samsung
- Empowering Growth: The Thriving Journey of Bangladesh’s Cable Industry
- Demand for luxury TVs surging in the GCC, says Samsung
Latest Reports
- Nicaragua RPG Gaming Market (2026-2032)
- New Zealand RPG Gaming Market (2026-2032)
- Netherlands RPG Gaming Market (2026-2032)
- Nauru RPG Gaming Market (2026-2032)
- Namibia RPG Gaming Market (2026-2032)
- Mozambique RPG Gaming Market (2026-2032)
- Montenegro RPG Gaming Market (2026-2032)
- Mongolia RPG Gaming Market (2026-2032)
- Monaco RPG Gaming Market (2026-2032)
- Micronesia RPG Gaming Market (2026-2032)
Industry Events and Analyst Meet

EV India Expo 2026

HIMTEX 2026

India Refining Summit 2026

India EV Show 2026

EV tech India Expo 2026
Whitepaper
- Middle East & Africa Commercial Security Market Click here to view more.
- Middle East & Africa Fire Safety Systems & Equipment Market Click here to view more.
- GCC Drone Market Click here to view more.
- Middle East Lighting Fixture Market Click here to view more.
- GCC Physical & Perimeter Security Market Click here to view more.