Georgia Inorganic Pigments Market (2026-2032) Outlook | Industry, Growth, Trends, Forecast, Share, Analysis, Revenue, Value, Size & Companies
Market Forecast By Type (Titanium Dioxide, Iron Oxide, Cadmium, Carbon Blank, Lead Chromate, Chromium Oxide, Others), By Colour (Red, Yellow, Orange, Green, Blue, Black, White, Others), By Chemistry (Oxide, Silicate, Carbonate, Sulphate, Sulphide, Others), By Grade (Food Grade, Pharmaceutical Grade, Industrial Grade, Others), By Form (Powder, Liquid), By Application (Plastics, Paints & Coatings, Printing Inks, Glass & Ceramics, Cosmetics, Paper Industry, Food Industry, Others) And Competitive Landscape
| Product Code: ETC190572 | Publication Date: May 2022 | Updated Date: Jun 2026 | Product Type: Market Research Report | |
| Publisher: 6Wresearch | Author: Ravi Bhandari | No. of Pages: 60 | No. of Figures: 40 | No. of Tables: 7 |
Georgia Inorganic Pigments Market Size, Share & Growth Rate
The Georgia Inorganic Pigments Market was estimated at USD 773 Million in 2025 and is projected to reach USD 1128 Million by 2032, growing at a CAGR of 5.5% from 2026 to 2032. This trajectory is primarily fueled by the robust expansion of the construction and coatings industries, coupled with increasing urbanization trends in the region. The demand for reliable and aesthetically pleasing pigments in various applications continues to bolster the market, as businesses seek products that offer both performance and sustainability.
Georgia Inorganic Pigments Market Year-wise Growth Rate and Key Drivers
This graph highlights how the Georgia Inorganic Pigments Market has steadily grown over the years, supported by major growth factors.
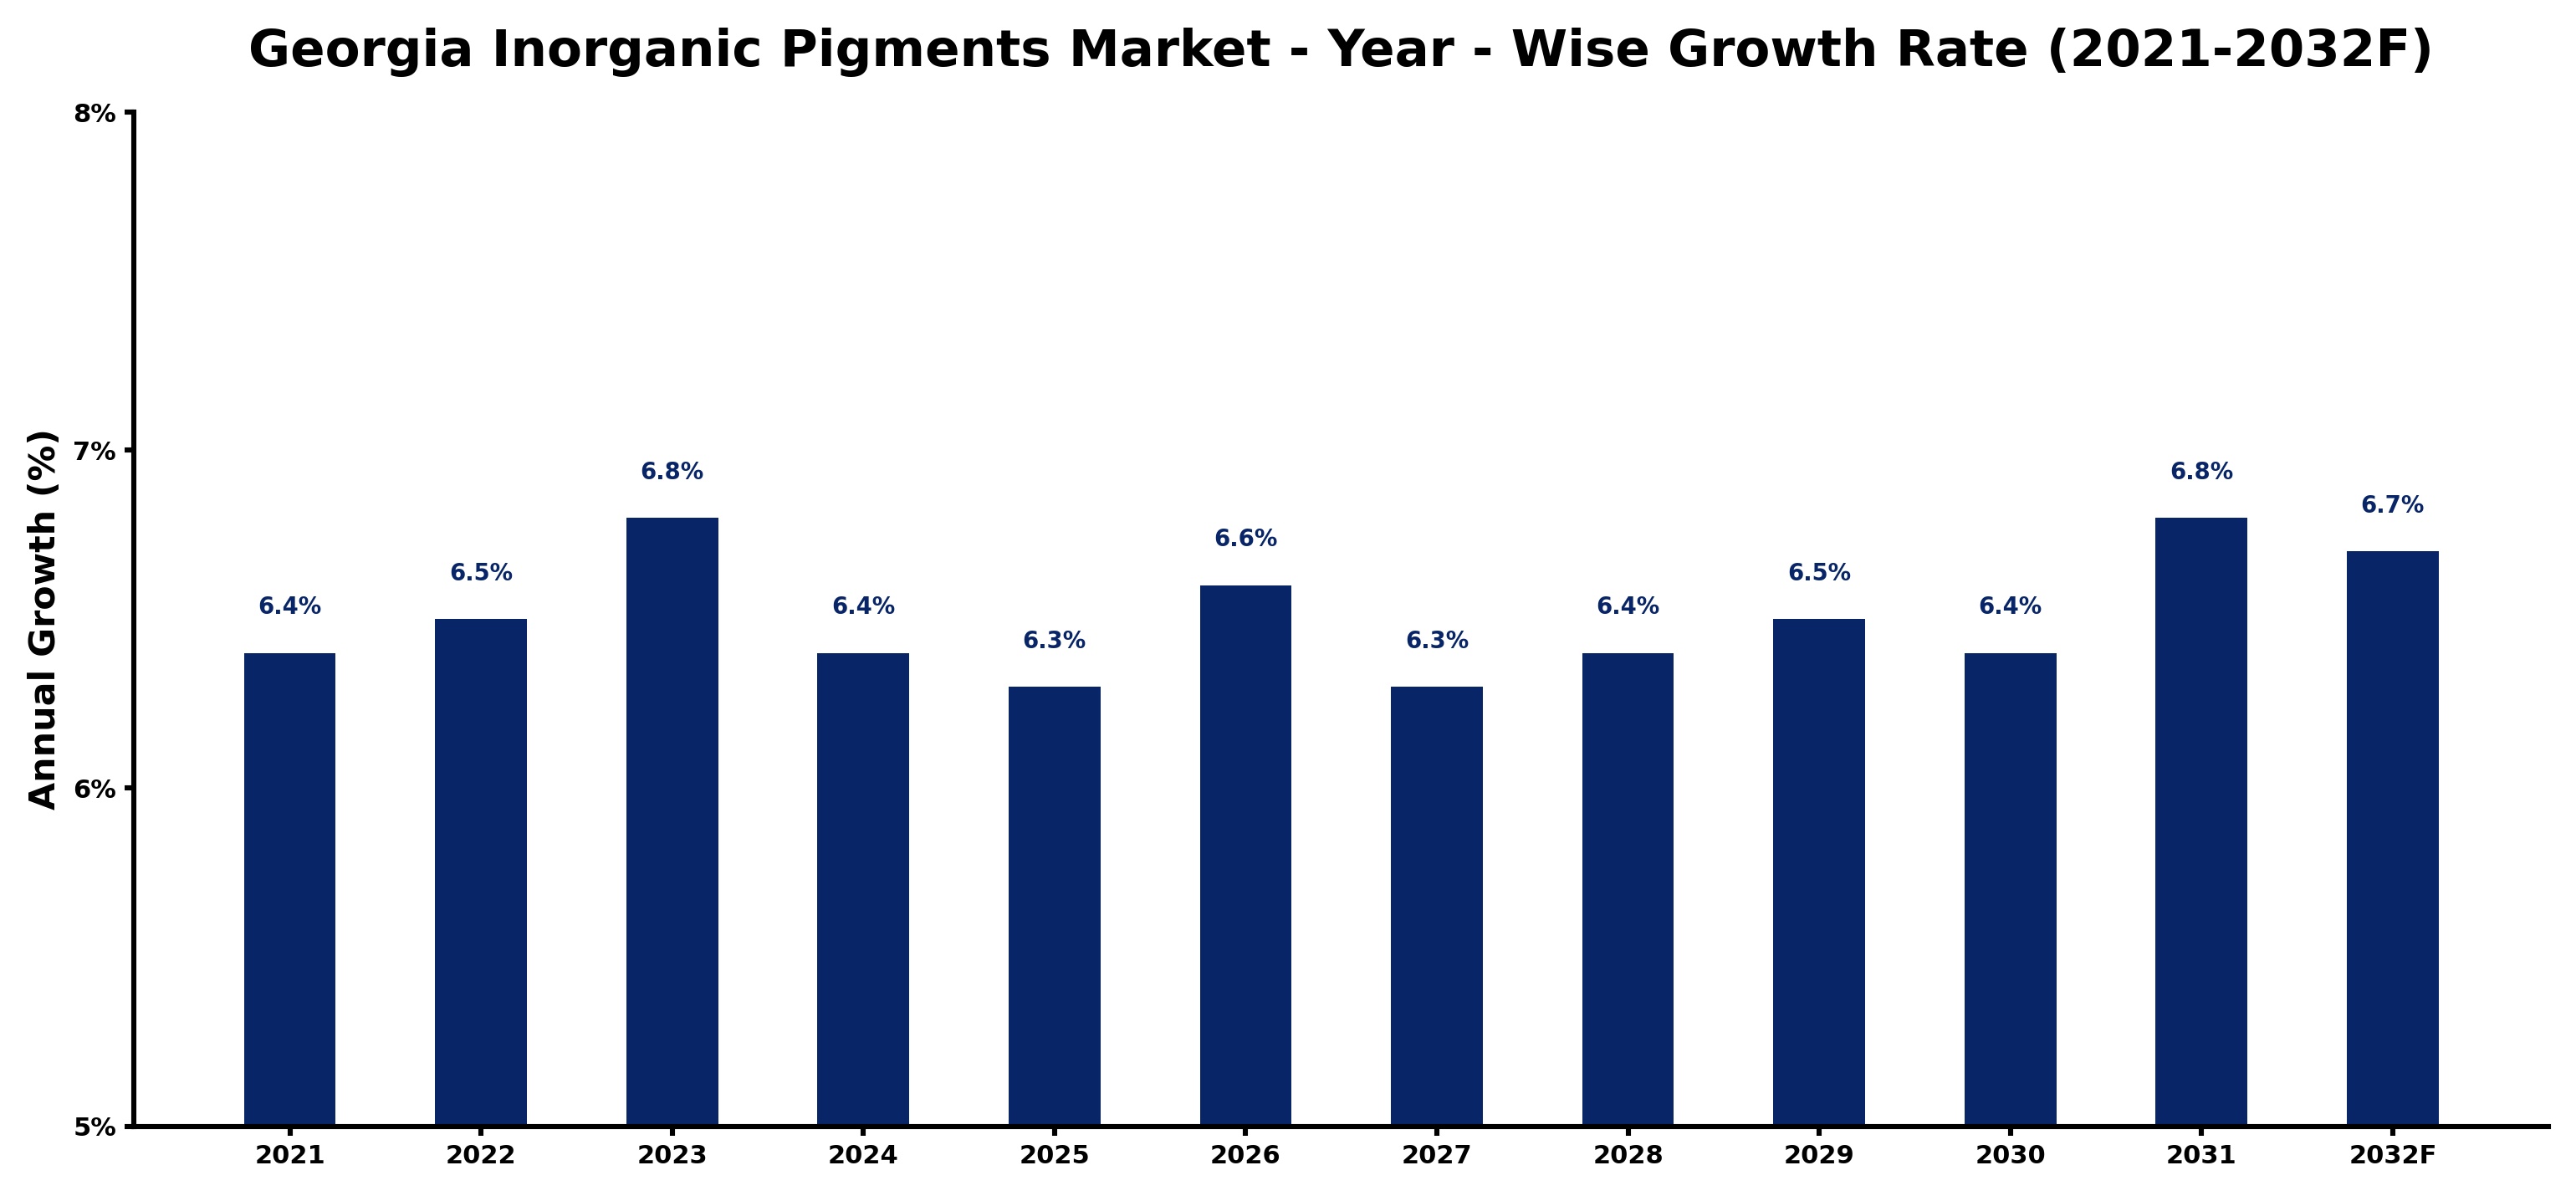
The table below presents the year‑wise growth rates along with the key drivers influencing the market
| Year | Growth Rate | Major Drivers |
| 2021 | 6.4% | Sustainable production methods adopted |
| 2022 | 6.5% | Construction sector demand increased |
| 2023 | 6.8% | Automotive industry growth accelerated |
| 2024 | 6.4% | Paint and coatings market expanded |
| 2025 | 6.3% | Consumer electronics usage surged |
| 2026 | 6.6% | Textile industry innovation advanced |
| 2027 | 6.3% | Agricultural applications expanded significantly |
| 2028 | 6.4% | Cosmetic industry demand increased |
| 2029 | 6.5% | Packaging solutions diversified offerings |
| 2030 | 6.4% | Infrastructure projects boosted demand |
| 2031 | 6.8% | Art and design trends evolved |
| 2032 | 6.7% | Environmental regulations enhanced sustainability |
Note - Market size estimations and growth projections presented in this report are based on 6Wresearch’s advanced forecasting approach, validated with industry datasets as of June 2026.
Georgia Inorganic Pigments Market Synopsis
The Georgia Inorganic Pigments Market is witnessing a dynamic shift, driven by the dual forces of infrastructure development and a growing preference for high-quality, durable products. As industries evolve, pigments made from titanium dioxide, iron oxide, and chromium oxide are becoming increasingly indispensable across various applications, ensuring vibrant colors and longevity.
This market is characterized by innovative solutions that meet both consumer and regulatory demands. Manufacturers are not only focusing on enhancing the performance of their pigments but also working towards developing eco-friendly alternatives that comply with strict environmental regulations, thereby aligning with the global shift towards sustainability.
Georgia Inorganic Pigments Market Key Takeaways
- Significant growth anticipated, with a market value projected to increase from USD 773 Million in 2025 to USD 1128 Million by 2032.
- Key drivers include booming construction, automotive, and coatings sectors requiring durable, UV-resistant pigments.
- Manufacturers are actively investing in R&D to create eco-friendly formulations and advanced production techniques.
- Regulatory pressures emphasize the need for sustainable practices and compliance, pushing innovation in the market.
- Competition from international producers presents both challenges and opportunities for local businesses to innovate and reduce costs.
Evaluation of Restraints in Georgia Inorganic Pigments Market
Despite the favorable growth prospects, the Georgia Inorganic Pigments Market faces certain constraints that could impede its expansion. The volatility in raw material prices—especially for metal oxides—poses a significant risk to profit margins, necessitating constant vigilance from manufacturers. Furthermore, the pressure to adopt sustainable practices requires substantial investment in research and development, which can strain smaller producers. As companies strive to balance pricing, quality, and environmental compliance, navigating these challenges will be pivotal for sustained market health.
Georgia Inorganic Pigments Market Trends
Currently, there is a notable trend towards innovation in pigment formulations, particularly those that emphasize eco-friendliness and reduced environmental impact. Manufacturers are also exploring advanced color technologies to meet diverse consumer demands. Furthermore, the increasing adoption of automation and smart manufacturing processes is reshaping production efficiency, paving the way for cost-effective solutions. As competition intensifies, these trends are likely to dictate the market's trajectory in the coming years.
Georgia Inorganic Pigments Market Opportunities
As Georgia continues to develop its infrastructure, significant opportunities arise for pigment manufacturers to supply construction and coating materials. The push towards green building practices offers an avenue for producers to innovate and create sustainable pigment solutions. Additionally, growing sectors such as automotive and plastics present further avenues for expansion and investment, particularly for companies that can quickly adapt to changing consumer preferences and regulatory requirements.
Government Initiatives in the Georgia Inorganic Pigments Market
The government of Georgia has initiated various policies aimed at supporting the inorganic pigments sector. Regulatory frameworks focusing on product safety, environmental impact, and sustainable manufacturing standards are becoming more stringent, promoting innovation in eco-friendly alternatives. State-sponsored research and development programs are also encouraging collaboration between academic institutions and industry players to drive advancements in sustainable pigment production. This supportive policy environment is critical in positioning Georgia as a competitive hub in the global inorganic pigments market.
Future Insights of the Georgia Inorganic Pigments Market
Looking ahead, the Georgia Inorganic Pigments Market is poised for robust growth, driven by continued advancements in manufacturing technologies and a steadfast commitment to sustainability. As consumer preferences shift towards eco-friendly products, companies that invest in innovative solutions are likely to thrive. Furthermore, the ongoing urbanization and construction activities in the region will sustain demand, ensuring that Georgia remains a vital player in the global inorganic pigments landscape.
Georgia Inorganic Pigments Market Latest Developments (May 2025 - June 2026)
Recent developments in the Georgia Inorganic Pigments Market highlight a significant focus on sustainability and innovation. Companies are increasingly exploring partnerships for the development of advanced, eco-friendly pigments. Furthermore, regulatory changes continue to influence product formulations, pushing manufacturers to adapt swiftly to new standards. The market is also seeing a rise in automation within production processes, aimed at enhancing efficiency and reducing operational costs, reflecting a broader trend of modernization across the industry.
Georgia Inorganic Pigments Market - Key Attractiveness of the Report
- 10 Years of Market Numbers
- Historical Data Starting from 2022 to 2025
- Base Year: 2025
- Forecast Data until 2032
- Key Performance Indicators Impacting the Market
- Major Upcoming Developments and Projects
Key Highlights of the Report:
- Georgia Inorganic Pigments Market Outlook
- Market Size of Georgia Inorganic Pigments Market, 2025
- Forecast of Georgia Inorganic Pigments Market, 2032
- Historical Data and Forecast of Georgia Inorganic Pigments Revenues & Volume for the Period 2022-2032F
- Georgia Inorganic Pigments Market Trend Evolution
- Georgia Inorganic Pigments Market Drivers and Challenges
- Georgia Inorganic Pigments Price Trends
- Georgia Inorganic Pigments Porter's Five Forces
- Georgia Inorganic Pigments Industry Life Cycle
- Historical Data and Forecast of Georgia Inorganic Pigments Market Revenues & Volume By Type for the Period 2022-2032F
- Historical Data and Forecast of Georgia Inorganic Pigments Market Revenues & Volume By Titanium Dioxide for the Period 2022-2032F
- Historical Data and Forecast of Georgia Inorganic Pigments Market Revenues & Volume By Iron Oxide, Cadmium for the Period 2022-2032F
- Historical Data and Forecast of Georgia Inorganic Pigments Market Revenues & Volume By Carbon Blank for the Period 2022-2032F
- Historical Data and Forecast of Georgia Inorganic Pigments Market Revenues & Volume By Lead Chromate for the Period 2022-2032F
- Historical Data and Forecast of Georgia Inorganic Pigments Market Revenues & Volume By Chromium Oxide for the Period 2022-2032F
- Historical Data and Forecast of Georgia Inorganic Pigments Market Revenues & Volume By Others for the Period 2022-2032F
- Historical Data and Forecast of Georgia Inorganic Pigments Market Revenues & Volume By Colour for the Period 2022-2032F
- Historical Data and Forecast of Georgia Inorganic Pigments Market Revenues & Volume By Red for the Period 2022-2032F
- Historical Data and Forecast of Georgia Inorganic Pigments Market Revenues & Volume By Yellow for the Period 2022-2032F
- Historical Data and Forecast of Georgia Inorganic Pigments Market Revenues & Volume By Orange for the Period 2022-2032F
- Historical Data and Forecast of Georgia Inorganic Pigments Market Revenues & Volume By Green for the Period 2022-2032F
- Historical Data and Forecast of Georgia Inorganic Pigments Market Revenues & Volume By Blue for the Period 2022-2032F
- Historical Data and Forecast of Georgia Inorganic Pigments Market Revenues & Volume By Black for the Period 2022-2032F
- Historical Data and Forecast of Georgia Inorganic Pigments Market Revenues & Volume By White for the Period 2022-2032F
- Historical Data and Forecast of Georgia Inorganic Pigments Market Revenues & Volume By Others for the Period 2022-2032F
- Historical Data and Forecast of Georgia Inorganic Pigments Market Revenues & Volume By Chemistry for the Period 2022-2032F
- Historical Data and Forecast of Georgia Inorganic Pigments Market Revenues & Volume By Oxide for the Period 2022-2032F
- Historical Data and Forecast of Georgia Inorganic Pigments Market Revenues & Volume By Silicate for the Period 2022-2032F
- Historical Data and Forecast of Georgia Inorganic Pigments Market Revenues & Volume By Carbonate for the Period 2022-2032F
- Historical Data and Forecast of Georgia Inorganic Pigments Market Revenues & Volume By Sulphate for the Period 2022-2032F
- Historical Data and Forecast of Georgia Inorganic Pigments Market Revenues & Volume By Sulphide for the Period 2022-2032F
- Historical Data and Forecast of Georgia Inorganic Pigments Market Revenues & Volume By Others for the Period 2022-2032F
- Historical Data and Forecast of Georgia Inorganic Pigments Market Revenues & Volume By Grade for the Period 2022-2032F
- Historical Data and Forecast of Georgia Inorganic Pigments Market Revenues & Volume By Food Grade for the Period 2022-2032F
- Historical Data and Forecast of Georgia Inorganic Pigments Market Revenues & Volume By Pharmaceutical Grade for the Period 2022-2032F
- Historical Data and Forecast of Georgia Inorganic Pigments Market Revenues & Volume By Industrial Grade for the Period 2022-2032F
- Historical Data and Forecast of Georgia Inorganic Pigments Market Revenues & Volume By Others for the Period 2022-2032F
- Historical Data and Forecast of Georgia Inorganic Pigments Market Revenues & Volume By Form for the Period 2022-2032F
- Historical Data and Forecast of Georgia Inorganic Pigments Market Revenues & Volume By Powder for the Period 2022-2032F
- Historical Data and Forecast of Georgia Inorganic Pigments Market Revenues & Volume By Liquid for the Period 2022-2032F
- Historical Data and Forecast of Georgia Inorganic Pigments Market Revenues & Volume By Application for the Period 2022-2032F
- Historical Data and Forecast of Georgia Inorganic Pigments Market Revenues & Volume By Plastics for the Period 2022-2032F
- Historical Data and Forecast of Georgia Inorganic Pigments Market Revenues & Volume By Paints & Coatings for the Period 2022-2032F
- Historical Data and Forecast of Georgia Inorganic Pigments Market Revenues & Volume By Printing Inks for the Period 2022-2032F
- Historical Data and Forecast of Georgia Inorganic Pigments Market Revenues & Volume By Glass & Ceramics for the Period 2022-2032F
- Historical Data and Forecast of Georgia Inorganic Pigments Market Revenues & Volume By Cosmetics for the Period 2022-2032F
- Historical Data and Forecast of Georgia Inorganic Pigments Market Revenues & Volume By Paper Industry for the Period 2022-2032F
- Historical Data and Forecast of Georgia Inorganic Pigments Market Revenues & Volume By Food Industry for the Period 2022-2032F
- Historical Data and Forecast of Georgia Inorganic Pigments Market Revenues & Volume By Others for the Period 2022-2032F
- Georgia Inorganic Pigments Import Export Trade Statistics
- Market Opportunity Assessment By Type
- Market Opportunity Assessment By Colour
- Market Opportunity Assessment By Chemistry
- Market Opportunity Assessment By Grade
- Market Opportunity Assessment By Form
- Market Opportunity Assessment By Application
- Georgia Inorganic Pigments Top Companies Market Share
- Georgia Inorganic Pigments Competitive Benchmarking By Technical and Operational Parameters
- Georgia Inorganic Pigments Company Profiles
- Georgia Inorganic Pigments Key Strategic Recommendations
Georgia Inorganic Pigments Market - Frequently Asked Questions
The primary applications include paints, coatings, plastics, ceramics, and construction materials, all of which require high stability and durability in their colorants.
Urbanization significantly drives demand for construction and decorative products, thereby increasing the need for quality pigments that enhance both appearance and performance.
The Georgia Inorganic Pigments Market is projected to grow from USD 773 Million in 2025 to USD 1128 Million by 2032, achieving a CAGR of 5.5% from 2026 to 2032.
Key trends include an increased focus on eco-friendly formulations and advanced manufacturing processes, as companies strive to meet stringent regulatory demands while improving efficiency.
The volatility of raw material prices, particularly for metal oxides, can lead to fluctuating production costs, posing a challenge for manufacturers in maintaining profitability.
6Wresearch actively monitors the Georgia Inorganic Pigments Market and publishes its comprehensive annual report, highlighting emerging trends, growth drivers, revenue analysis, and forecast outlook. Our insights help businesses to make data-backed strategic decisions with ongoing market dynamics. Our analysts track relevent industries related to the Georgia Inorganic Pigments Market, allowing our clients with actionable intelligence and reliable forecasts tailored to emerging regional needs.
Yes, we provide customisation as per your requirements. To learn more, feel free to contact us on sales@6wresearch.com
1 Executive Summary |
2 Introduction |
2.1 Key Highlights of the Report |
2.2 Report Description |
2.3 Market Scope & Segmentation |
2.4 Research Methodology |
2.5 Assumptions |
3 Georgia Inorganic Pigments Market Overview |
3.1 Georgia Country Macro Economic Indicators |
3.2 Georgia Inorganic Pigments Market Revenues & Volume, 2022 & 2032F |
3.3 Georgia Inorganic Pigments Market - Industry Life Cycle |
3.4 Georgia Inorganic Pigments Market - Porter's Five Forces |
3.5 Georgia Inorganic Pigments Market Revenues & Volume Share, By Type, 2022 & 2032F |
3.6 Georgia Inorganic Pigments Market Revenues & Volume Share, By Colour, 2022 & 2032F |
3.7 Georgia Inorganic Pigments Market Revenues & Volume Share, By Chemistry, 2022 & 2032F |
3.8 Georgia Inorganic Pigments Market Revenues & Volume Share, By Grade, 2022 & 2032F |
3.9 Georgia Inorganic Pigments Market Revenues & Volume Share, By Form, 2022 & 2032F |
3.10 Georgia Inorganic Pigments Market Revenues & Volume Share, By Application, 2022 & 2032F |
4 Georgia Inorganic Pigments Market Dynamics |
4.1 Impact Analysis |
4.2 Market Drivers |
4.2.1 Increasing demand for inorganic pigments in various industries such as paints and coatings, plastics, and construction. |
4.2.2 Growing investments in infrastructure development projects in Georgia. |
4.2.3 Rising awareness about the benefits of inorganic pigments over organic pigments in terms of durability and color stability. |
4.3 Market Restraints |
4.3.1 Fluctuating raw material prices impacting the production cost of inorganic pigments. |
4.3.2 Stringent regulations regarding the environmental impact of inorganic pigments production and usage. |
5 Georgia Inorganic Pigments Market Trends |
6 Georgia Inorganic Pigments Market, By Types |
6.1 Georgia Inorganic Pigments Market, By Type |
6.1.1 Overview and Analysis |
6.1.2 Georgia Inorganic Pigments Market Revenues & Volume, By Type, 2022-2032F |
6.1.3 Georgia Inorganic Pigments Market Revenues & Volume, By Titanium Dioxide, 2022-2032F |
6.1.4 Georgia Inorganic Pigments Market Revenues & Volume, By Iron Oxide, Cadmium, 2022-2032F |
6.1.5 Georgia Inorganic Pigments Market Revenues & Volume, By Carbon Blank, 2022-2032F |
6.1.6 Georgia Inorganic Pigments Market Revenues & Volume, By Lead Chromate, 2022-2032F |
6.1.7 Georgia Inorganic Pigments Market Revenues & Volume, By Chromium Oxide, 2022-2032F |
6.1.8 Georgia Inorganic Pigments Market Revenues & Volume, By Others, 2022-2032F |
6.2 Georgia Inorganic Pigments Market, By Colour |
6.2.1 Overview and Analysis |
6.2.2 Georgia Inorganic Pigments Market Revenues & Volume, By Red, 2022-2032F |
6.2.3 Georgia Inorganic Pigments Market Revenues & Volume, By Yellow, 2022-2032F |
6.2.4 Georgia Inorganic Pigments Market Revenues & Volume, By Orange, 2022-2032F |
6.2.5 Georgia Inorganic Pigments Market Revenues & Volume, By Green, 2022-2032F |
6.2.6 Georgia Inorganic Pigments Market Revenues & Volume, By Blue, 2022-2032F |
6.2.7 Georgia Inorganic Pigments Market Revenues & Volume, By Black, 2022-2032F |
6.2.8 Georgia Inorganic Pigments Market Revenues & Volume, By Others, 2022-2032F |
6.2.9 Georgia Inorganic Pigments Market Revenues & Volume, By Others, 2022-2032F |
6.3 Georgia Inorganic Pigments Market, By Chemistry |
6.3.1 Overview and Analysis |
6.3.2 Georgia Inorganic Pigments Market Revenues & Volume, By Oxide, 2022-2032F |
6.3.3 Georgia Inorganic Pigments Market Revenues & Volume, By Silicate, 2022-2032F |
6.3.4 Georgia Inorganic Pigments Market Revenues & Volume, By Carbonate, 2022-2032F |
6.3.5 Georgia Inorganic Pigments Market Revenues & Volume, By Sulphate, 2022-2032F |
6.3.6 Georgia Inorganic Pigments Market Revenues & Volume, By Sulphide, 2022-2032F |
6.3.7 Georgia Inorganic Pigments Market Revenues & Volume, By Others, 2022-2032F |
6.4 Georgia Inorganic Pigments Market, By Grade |
6.4.1 Overview and Analysis |
6.4.2 Georgia Inorganic Pigments Market Revenues & Volume, By Food Grade, 2022-2032F |
6.4.3 Georgia Inorganic Pigments Market Revenues & Volume, By Pharmaceutical Grade, 2022-2032F |
6.4.4 Georgia Inorganic Pigments Market Revenues & Volume, By Industrial Grade, 2022-2032F |
6.4.5 Georgia Inorganic Pigments Market Revenues & Volume, By Others, 2022-2032F |
6.5 Georgia Inorganic Pigments Market, By Form |
6.5.1 Overview and Analysis |
6.5.2 Georgia Inorganic Pigments Market Revenues & Volume, By Powder, 2022-2032F |
6.5.3 Georgia Inorganic Pigments Market Revenues & Volume, By Liquid, 2022-2032F |
6.6 Georgia Inorganic Pigments Market, By Application |
6.6.1 Overview and Analysis |
6.6.2 Georgia Inorganic Pigments Market Revenues & Volume, By Plastics, 2022-2032F |
6.6.3 Georgia Inorganic Pigments Market Revenues & Volume, By Paints & Coatings, 2022-2032F |
6.6.4 Georgia Inorganic Pigments Market Revenues & Volume, By Printing Inks, 2022-2032F |
6.6.5 Georgia Inorganic Pigments Market Revenues & Volume, By Glass & Ceramics, 2022-2032F |
6.6.6 Georgia Inorganic Pigments Market Revenues & Volume, By Cosmetics, 2022-2032F |
6.6.7 Georgia Inorganic Pigments Market Revenues & Volume, By Paper Industry, 2022-2032F |
6.6.8 Georgia Inorganic Pigments Market Revenues & Volume, By Others, 2022-2032F |
6.6.9 Georgia Inorganic Pigments Market Revenues & Volume, By Others, 2022-2032F |
7 Georgia Inorganic Pigments Market Import-Export Trade Statistics |
7.1 Georgia Inorganic Pigments Market Export to Major Countries |
7.2 Georgia Inorganic Pigments Market Imports from Major Countries |
8 Georgia Inorganic Pigments Market Key Performance Indicators |
8.1 Research and development investment in new inorganic pigment technologies. |
8.2 Adoption rate of inorganic pigments in emerging applications. |
8.3 Environmental sustainability initiatives in the production process of inorganic pigments. |
9 Georgia Inorganic Pigments Market - Opportunity Assessment |
9.1 Georgia Inorganic Pigments Market Opportunity Assessment, By Type, 2022 & 2032F |
9.2 Georgia Inorganic Pigments Market Opportunity Assessment, By Colour, 2022 & 2032F |
9.3 Georgia Inorganic Pigments Market Opportunity Assessment, By Chemistry, 2022 & 2032F |
9.4 Georgia Inorganic Pigments Market Opportunity Assessment, By Grade, 2022 & 2032F |
9.5 Georgia Inorganic Pigments Market Opportunity Assessment, By Form, 2022 & 2032F |
9.6 Georgia Inorganic Pigments Market Opportunity Assessment, By Application, 2022 & 2032F |
10 Georgia Inorganic Pigments Market - Competitive Landscape |
10.1 Georgia Inorganic Pigments Market Revenue Share, By Companies, 2025 |
10.2 Georgia Inorganic Pigments Market Competitive Benchmarking, By Operating and Technical Parameters |
11 Company Profiles |
12 Recommendations |
13 Disclaimer |
Global Go To Market Strategy - 2030
Export potential enables firms to identify high-growth global markets with greater confidence by combining advanced trade intelligence with a structured quantitative methodology. The framework analyzes emerging demand trends and country-level import patterns while integrating macroeconomic and trade datasets such as GDP and population forecasts, bilateral import–export flows, tariff structures, elasticity differentials between developed and developing economies, geographic distance, and import demand projections. Using weighted trade values from 2020–2024 as the base period to project country-to-country export potential for 2030, these inputs are operationalized through calculated drivers such as gravity model parameters, tariff impact factors, and projected GDP per-capita growth. Through an analysis of hidden potentials, demand hotspots, and market conditions that are most favorable to success, this method enables firms to focus on target countries, maximize returns, and global expansion with data, backed by accuracy.
By factoring in the projected importer demand gap that is currently unmet and could be potential opportunity, it identifies the potential for the Exporter (Country) among 190 countries, against the general trade analysis, which identifies the biggest importer or exporter.
To discover high-growth global markets and optimize your business strategy:
Click Here
Pricing
- Single User License$ 1,995
- Department License$ 2,400
- Site License$ 3,120
- Global License$ 3,795

Leadership Perspectives from Industry Events
Search
Thought Leadership and Analyst Meet


Our Clients
6WResearch In News
- India Air Conditioner Market Set for Strong Rebound in 2026 After Weather-Led Correction and GST-Driven Recovery: 6Wresearch
- ADAS in India: How Automatic Emergency Braking, Blind Spot Detection & Driver Monitoring are Transforming Road Safety
- Doha a strategic location for EV manufacturing hub: IPA Qatar
- Demand for luxury TVs surging in the GCC, says Samsung
- Empowering Growth: The Thriving Journey of Bangladesh’s Cable Industry
- Demand for luxury TVs surging in the GCC, says Samsung
Latest Reports
- Nicaragua RPG Gaming Market (2026-2032)
- New Zealand RPG Gaming Market (2026-2032)
- Netherlands RPG Gaming Market (2026-2032)
- Nauru RPG Gaming Market (2026-2032)
- Namibia RPG Gaming Market (2026-2032)
- Mozambique RPG Gaming Market (2026-2032)
- Montenegro RPG Gaming Market (2026-2032)
- Mongolia RPG Gaming Market (2026-2032)
- Monaco RPG Gaming Market (2026-2032)
- Micronesia RPG Gaming Market (2026-2032)
Industry Events and Analyst Meet

EV India Expo 2026

HIMTEX 2026

India Refining Summit 2026

India EV Show 2026

EV tech India Expo 2026
Whitepaper
- Middle East & Africa Commercial Security Market Click here to view more.
- Middle East & Africa Fire Safety Systems & Equipment Market Click here to view more.
- GCC Drone Market Click here to view more.
- Middle East Lighting Fixture Market Click here to view more.
- GCC Physical & Perimeter Security Market Click here to view more.