Georgia Lithographic Printing Chemicals Market (2026-2032) Outlook | Revenue, Companies, Analysis, Forecast, Growth, Industry, Trends, Share, Value & Size
Market Forecast By Product by Application (Inks, Fountain solutions, Cleaning solutions, Others), By Market by Application (Publication, Packaging, Promotion) And Competitive Landscape
| Product Code: ETC331380 | Publication Date: Aug 2022 | Updated Date: Jul 2026 | Product Type: Market Research Report | |
| Publisher: 6Wresearch | Author: Ravi Bhandari | No. of Pages: 75 | No. of Figures: 35 | No. of Tables: 20 |
Georgia Lithographic Printing Chemicals Market Size, Share & Growth Rate
The Georgia Lithographic Printing Chemicals Market was estimated at USD 756 Million in 2025 and is projected to reach USD 1103 Million by 2032, growing at a CAGR of 5.5% from 2026 to 2032. This growth trajectory is primarily fueled by the heightened demand for premium printed materials across diverse sectors such as packaging, advertising, and publishing. Additionally, the growing inclination towards sustainable and eco-friendly printing solutions is reshaping the market landscape, further driving the uptake of advanced lithographic chemicals.
Georgia Lithographic Printing Chemicals Market Year-wise Growth Rate and Key Drivers
This graph highlights how the Georgia Lithographic Printing Chemicals Market has steadily grown over the years, supported by major growth factors.
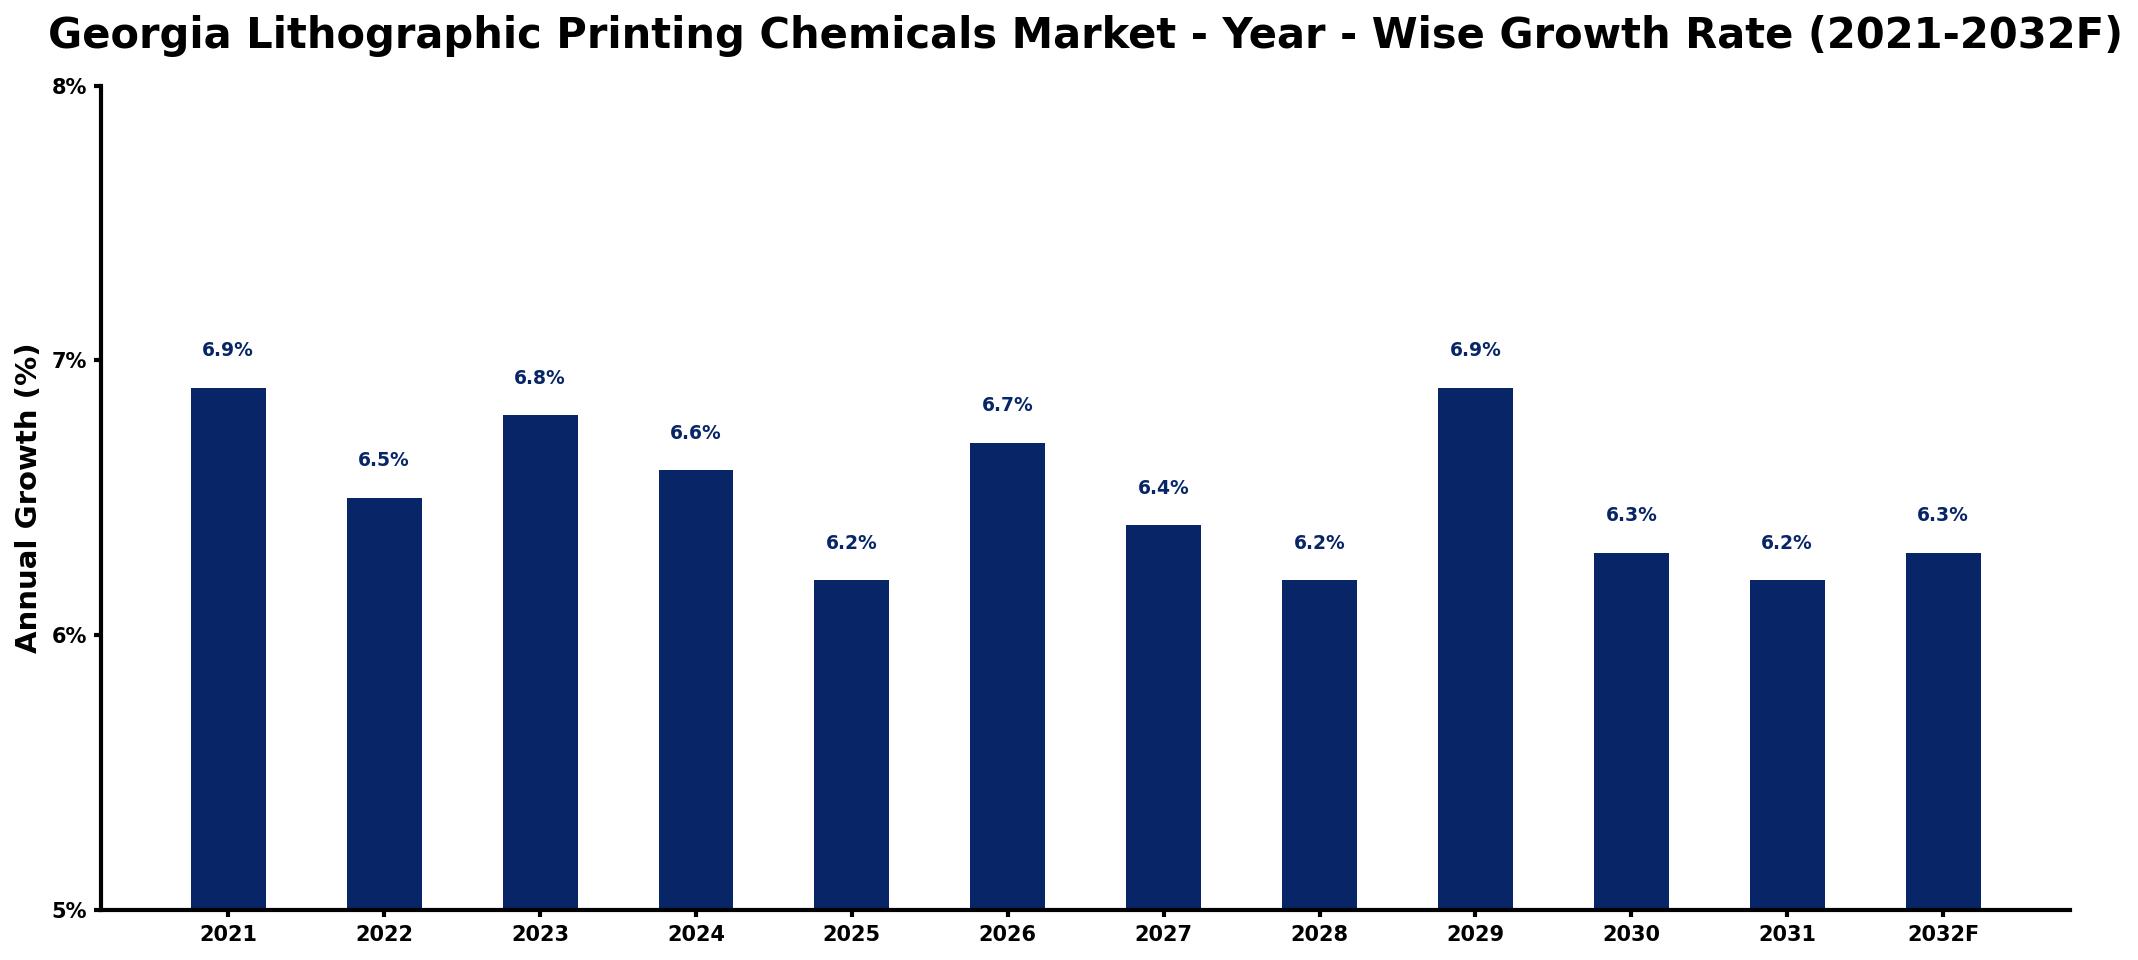
The table below presents the year‑wise growth rates along with the key drivers influencing the market
| Year | Growth Rate | Major Drivers |
| 2021 | 6.9% | Increased demand from packaging industry |
| 2022 | 6.5% | strengthening international trade flows |
| 2023 | 6.8% | Growth in commercial print volume |
| 2024 | 6.6% | Rising investment in automation solutions |
| 2025 | 6.2% | expanding manufacturing base activity |
| 2026 | 6.7% | Higher demand for specialty applications |
| 2027 | 6.4% | Increased focus on eco-friendly solutions |
| 2028 | 6.2% | growing emerging market penetration |
| 2029 | 6.9% | stronger distribution network expansion |
| 2030 | 6.3% | Expansion of customized print solutions |
| 2031 | 6.2% | Rising demand for flexible packaging |
| 2032 | 6.3% | Increased adoption of smart technologies |
Note: Market size estimations and growth projections presented in this report are based on 6Wresearch's proprietary forecasting methodology, utilizing the latest available industry data, government publications, and primary research inputs.
Georgia Lithographic Printing Chemicals Market Synopsis
In Georgia, the lithographic printing chemicals market is witnessing significant evolution, influenced by both technological advancements and changing consumer preferences. Companies are increasingly focusing on developing a broader range of products that meet both performance and environmental sustainability standards.
The rising adoption of digital printing techniques is also a notable trend, prompting chemical manufacturers to innovate continuously. As a hub for the printing industry in the Southeastern United States, Georgia's market dynamics are characterized by a robust competitive landscape where players strive for differentiation through eco-friendly formulations and enhanced product offerings.
Georgia Lithographic Printing Chemicals Market Key Takeaways
- The market is expanding due to increased demand for high-quality printed materials.
- There is a marked shift towards environmentally sustainable printing chemicals.
- Technological advancements are enhancing print quality and operational efficiency.
- Investment opportunities lie in the development of innovative, eco-friendly chemical solutions.
- Georgias strategic location bolsters its prominence in the printing and packaging sectors.
Evaluation of Restraints in Georgia Lithographic Printing Chemicals Market
Despite the positive growth outlook, the Georgia lithographic printing chemicals market faces several constraints that could hinder progress. Stringent environmental regulations pose challenges for companies in terms of compliance and the costs associated with adapting production processes to meet these standards. Furthermore, the competition from digital printing technologies, which often deliver faster and more environmentally friendly solutions, pressures traditional lithographic methods. Balancing innovation with compliance while remaining cost-effective remains a significant hurdle for companies in the sector.
Georgia Lithographic Printing Chemicals Market Trends
The market is experiencing a pronounced trend towards sustainability, with an increasing demand for eco-friendly inks and chemicals that reduce VOC emissions. Specialty chemicals designed to improve print quality while minimizing environmental impact are gaining traction. Moreover, industry players are ramping up research and development investments to create innovative formulations that align with both performance and sustainability requirements, enhancing their competitive edge in this evolving landscape.
Georgia Lithographic Printing Chemicals Market Opportunities
There are numerous investment opportunities in the Georgia lithographic printing chemicals market, particularly in the development of sustainable chemical solutions that adhere to rising environmental standards. Emphasizing research and innovation can unlock potential breakthroughs that elevate print quality and operational efficiency. Forming strategic partnerships with printing firms can also facilitate the development of customized chemical solutions, allowing businesses to expand their market presence and meet specific client needs effectively.
Government Initiatives in the Georgia Lithographic Printing Chemicals Market
The market is significantly influenced by government policies aimed at regulating chemical use and disposal. Compliance with the Georgia Hazardous Waste Management Act is imperative, as it mandates responsible handling and disposal practices for lithographic printing chemicals. Furthermore, the Georgia Environmental Protection Division enforces air and water quality standards to curb pollution from printing operations. Regulations from the Occupational Safety and Health Administration (OSHA) ensure safe workplace conditions concerning hazardous chemicals, promoting a healthier working environment in the industry.
Future Insights of the Georgia Lithographic Printing Chemicals Market
Looking ahead to 2026-2032, the Georgia lithographic printing chemicals market is poised for consistent growth. The integration of digital printing technologies, coupled with a sustained emphasis on sustainable practices, is likely to drive this expansion. Innovations in chemical formulations that enhance print quality and durability will further fuel market growth. As Georgia continues to establish itself as a vital center for the printing and packaging industries, opportunities abound for suppliers and manufacturers to adapt and thrive in this dynamic environment.
Georgia Lithographic Printing Chemicals Market Latest Developments (2025 - 2026)
Recent industry trends indicate a stronger push toward adopting environmentally responsible practices among lithographic printing chemical manufacturers. Firms are investing heavily in research and development to introduce breakthrough products that meet both performance and sustainability goals. Collaborations and partnerships within the industry are becoming more prevalent as companies seek to pool resources for innovative chemical solutions. Additionally, there is an increased focus on customer education regarding the benefits of using eco-friendly printing chemicals.
Georgia Lithographic Printing Chemicals Market - Key Attractiveness of the Report
- 10 Years of Market Numbers
- Historical Data Starting from 2022 to 2025
- Base Year: 2025
- Forecast Data until 2032
- Key Performance Indicators Impacting the Market
- Major Upcoming Developments and Projects
Key Highlights of the Report:
- Georgia Lithographic Printing Chemicals Market Outlook
- Market Size of Georgia Lithographic Printing Chemicals Market, 2025
- Forecast of Georgia Lithographic Printing Chemicals Market, 2032
- Historical Data and Forecast of Georgia Lithographic Printing Chemicals Revenues & Volume for the Period 2022-2032F
- Georgia Lithographic Printing Chemicals Market Trend Evolution
- Georgia Lithographic Printing Chemicals Market Drivers and Challenges
- Georgia Lithographic Printing Chemicals Price Trends
- Georgia Lithographic Printing Chemicals Porter's Five Forces
- Georgia Lithographic Printing Chemicals Industry Life Cycle
- Historical Data and Forecast of Georgia Lithographic Printing Chemicals Market Revenues & Volume By Product by Application for the Period 2022-2032F
- Historical Data and Forecast of Georgia Lithographic Printing Chemicals Market Revenues & Volume By Inks for the Period 2022-2032F
- Historical Data and Forecast of Georgia Lithographic Printing Chemicals Market Revenues & Volume By Fountain solutions for the Period 2022-2032F
- Historical Data and Forecast of Georgia Lithographic Printing Chemicals Market Revenues & Volume By Cleaning solutions for the Period 2022-2032F
- Historical Data and Forecast of Georgia Lithographic Printing Chemicals Market Revenues & Volume By Others for the Period 2022-2032F
- Historical Data and Forecast of Georgia Lithographic Printing Chemicals Market Revenues & Volume By Market by Application for the Period 2022-2032F
- Historical Data and Forecast of Georgia Lithographic Printing Chemicals Market Revenues & Volume By Publication for the Period 2022-2032F
- Historical Data and Forecast of Georgia Lithographic Printing Chemicals Market Revenues & Volume By Packaging for the Period 2022-2032F
- Historical Data and Forecast of Georgia Lithographic Printing Chemicals Market Revenues & Volume By Promotion for the Period 2022-2032F
- Georgia Lithographic Printing Chemicals Import Export Trade Statistics
- Market Opportunity Assessment By Product by Application
- Market Opportunity Assessment By Market by Application
- Georgia Lithographic Printing Chemicals Top Companies Market Share
- Georgia Lithographic Printing Chemicals Competitive Benchmarking By Technical and Operational Parameters
- Georgia Lithographic Printing Chemicals Company Profiles
- Georgia Lithographic Printing Chemicals Key Strategic Recommendations
Frequently Asked Questions About the Market Study (FAQs):
The growth is largely attributed to the rising demand for high-quality printed materials across various industries, alongside a significant shift towards eco-friendly and sustainable printing practices.
Companies are increasingly focusing on developing compliant, sustainable chemical formulations that minimize environmental impact while meeting performance standards, addressing both regulatory pressures and consumer demand.
The market was estimated at USD 756 Million in 2025 and is projected to reach USD 1103 Million by 2032, growing at a CAGR of 5.5% from 2026 to 2032.
Technological innovations are enhancing print quality, efficiency, and sustainability in the lithographic printing process, pushing manufacturers to innovate continuously and improve their offerings.
Investment opportunities lie in the research and development of eco-friendly chemical solutions, partnerships with printing companies, and the introduction of innovative products that enhance print quality and efficiency.
6Wresearch actively monitors the Georgia Lithographic Printing Chemicals Market and publishes its comprehensive annual report, highlighting emerging trends, growth drivers, revenue analysis, and forecast outlook. Our insights help businesses to make data-backed strategic decisions with ongoing market dynamics. Our analysts track relevent industries related to the Georgia Lithographic Printing Chemicals Market, allowing our clients with actionable intelligence and reliable forecasts tailored to emerging regional needs.
Yes, we provide customisation as per your requirements. To learn more, feel free to contact us on sales@6wresearch.com
1 Executive Summary |
2 Introduction |
2.1 Key Highlights of the Report |
2.2 Report Description |
2.3 Market Scope & Segmentation |
2.4 Research Methodology |
2.5 Assumptions |
3 Georgia Lithographic Printing Chemicals Market Overview |
3.1 Georgia Country Macro Economic Indicators |
3.2 Georgia Lithographic Printing Chemicals Market Revenues & Volume, 2022 & 2032F |
3.3 Georgia Lithographic Printing Chemicals Market - Industry Life Cycle |
3.4 Georgia Lithographic Printing Chemicals Market - Porter's Five Forces |
3.5 Georgia Lithographic Printing Chemicals Market Revenues & Volume Share, By Product by Application, 2022 & 2032F |
3.6 Georgia Lithographic Printing Chemicals Market Revenues & Volume Share, By Market by Application, 2022 & 2032F |
4 Georgia Lithographic Printing Chemicals Market Dynamics |
4.1 Impact Analysis |
4.2 Market Drivers |
4.2.1 Increasing demand for high-quality printing materials in the advertising and packaging industries |
4.2.2 Technological advancements leading to the development of more efficient and eco-friendly lithographic printing chemicals |
4.2.3 Growth in the publishing sector, especially in educational and promotional materials |
4.3 Market Restraints |
4.3.1 Volatility in raw material prices impacting the production costs of lithographic printing chemicals |
4.3.2 Stringent environmental regulations regarding the use and disposal of printing chemicals |
4.3.3 Competition from digital printing technologies affecting the traditional lithographic printing market |
5 Georgia Lithographic Printing Chemicals Market Trends |
6 Georgia Lithographic Printing Chemicals Market, By Types |
6.1 Georgia Lithographic Printing Chemicals Market, By Product by Application |
6.1.1 Overview and Analysis |
6.1.2 Georgia Lithographic Printing Chemicals Market Revenues & Volume, By Product by Application, 2022-2032F |
6.1.3 Georgia Lithographic Printing Chemicals Market Revenues & Volume, By Inks, 2022-2032F |
6.1.4 Georgia Lithographic Printing Chemicals Market Revenues & Volume, By Fountain solutions, 2022-2032F |
6.1.5 Georgia Lithographic Printing Chemicals Market Revenues & Volume, By Cleaning solutions, 2022-2032F |
6.1.6 Georgia Lithographic Printing Chemicals Market Revenues & Volume, By Others, 2022-2032F |
6.2 Georgia Lithographic Printing Chemicals Market, By Market by Application |
6.2.1 Overview and Analysis |
6.2.2 Georgia Lithographic Printing Chemicals Market Revenues & Volume, By Publication, 2022-2032F |
6.2.3 Georgia Lithographic Printing Chemicals Market Revenues & Volume, By Packaging, 2022-2032F |
6.2.4 Georgia Lithographic Printing Chemicals Market Revenues & Volume, By Promotion, 2022-2032F |
7 Georgia Lithographic Printing Chemicals Market Import-Export Trade Statistics |
7.1 Georgia Lithographic Printing Chemicals Market Export to Major Countries |
7.2 Georgia Lithographic Printing Chemicals Market Imports from Major Countries |
8 Georgia Lithographic Printing Chemicals Market Key Performance Indicators |
8.1 Adoption rate of eco-friendly lithographic printing chemicals in the market |
8.2 Average lifespan of lithographic printing equipment in Georgia |
8.3 Percentage of printing companies investing in research and development for lithographic printing chemicals |
9 Georgia Lithographic Printing Chemicals Market - Opportunity Assessment |
9.1 Georgia Lithographic Printing Chemicals Market Opportunity Assessment, By Product by Application, 2022 & 2032F |
9.2 Georgia Lithographic Printing Chemicals Market Opportunity Assessment, By Market by Application, 2022 & 2032F |
10 Georgia Lithographic Printing Chemicals Market - Competitive Landscape |
10.1 Georgia Lithographic Printing Chemicals Market Revenue Share, By Companies, 2025 |
10.2 Georgia Lithographic Printing Chemicals Market Competitive Benchmarking, By Operating and Technical Parameters |
11 Company Profiles |
12 Recommendations |
13 Disclaimer |
Global Go To Market Strategy - 2030
Export potential enables firms to identify high-growth global markets with greater confidence by combining advanced trade intelligence with a structured quantitative methodology. The framework analyzes emerging demand trends and country-level import patterns while integrating macroeconomic and trade datasets such as GDP and population forecasts, bilateral import–export flows, tariff structures, elasticity differentials between developed and developing economies, geographic distance, and import demand projections. Using weighted trade values from 2020–2024 as the base period to project country-to-country export potential for 2030, these inputs are operationalized through calculated drivers such as gravity model parameters, tariff impact factors, and projected GDP per-capita growth. Through an analysis of hidden potentials, demand hotspots, and market conditions that are most favorable to success, this method enables firms to focus on target countries, maximize returns, and global expansion with data, backed by accuracy.
By factoring in the projected importer demand gap that is currently unmet and could be potential opportunity, it identifies the potential for the Exporter (Country) among 190 countries, against the general trade analysis, which identifies the biggest importer or exporter.
To discover high-growth global markets and optimize your business strategy:
Click Here
Pricing
- Single User License$ 1,995
- Department License$ 2,400
- Site License$ 3,120
- Global License$ 3,795

Leadership Perspectives from Industry Events
Search
Thought Leadership and Analyst Meet


Our Clients
6WResearch In News
- India Air Conditioner Market Set for Strong Rebound in 2026 After Weather-Led Correction and GST-Driven Recovery: 6Wresearch
- ADAS in India: How Automatic Emergency Braking, Blind Spot Detection & Driver Monitoring are Transforming Road Safety
- Doha a strategic location for EV manufacturing hub: IPA Qatar
- Demand for luxury TVs surging in the GCC, says Samsung
- Empowering Growth: The Thriving Journey of Bangladesh’s Cable Industry
- Demand for luxury TVs surging in the GCC, says Samsung
Latest Reports
- Nicaragua RPG Gaming Market (2026-2032)
- New Zealand RPG Gaming Market (2026-2032)
- Netherlands RPG Gaming Market (2026-2032)
- Nauru RPG Gaming Market (2026-2032)
- Namibia RPG Gaming Market (2026-2032)
- Mozambique RPG Gaming Market (2026-2032)
- Montenegro RPG Gaming Market (2026-2032)
- Mongolia RPG Gaming Market (2026-2032)
- Monaco RPG Gaming Market (2026-2032)
- Micronesia RPG Gaming Market (2026-2032)
Industry Events and Analyst Meet

EV India Expo 2026

HIMTEX 2026

India Refining Summit 2026

India EV Show 2026

EV tech India Expo 2026
Whitepaper
- Middle East & Africa Commercial Security Market Click here to view more.
- Middle East & Africa Fire Safety Systems & Equipment Market Click here to view more.
- GCC Drone Market Click here to view more.
- Middle East Lighting Fixture Market Click here to view more.
- GCC Physical & Perimeter Security Market Click here to view more.