Georgia Low Fat Dairy Products Market (2026-2032) Outlook | Share, Revenue, Forecast, Analysis, Companies, Growth, Industry, Trends, Value & Size
Market Forecast By Nature (Organic, Conventional), By Type (Low Fat Butter, Low Fat Cheese, Low Fat Yoghurt, Low Fat Ice Cream, Reduced Fat Margarine, Fat Free Condensed Milk, Skimmed Milk, Others), By Distribution Channel (Supermarkets and Hypermarkets, Convenience Stores, Dairy Stores, Online, Others) And Competitive Landscape
| Product Code: ETC188292 | Publication Date: May 2022 | Updated Date: Jun 2026 | Product Type: Market Research Report | |
| Publisher: 6Wresearch | Author: Ravi Bhandari | No. of Pages: 60 | No. of Figures: 40 | No. of Tables: 7 |
Georgia Low Fat Dairy Products Market Size, Share & Growth Rate
The Georgia Low Fat Dairy Products Market was estimated at USD 1150 Million in 2025 and is projected to reach USD 2070 Million by 2032, growing at a CAGR of 8.8% from 2026 to 2032. This remarkable trajectory is largely driven by a significant shift towards health-conscious consumption among Georgia's population. As consumers increasingly prioritize a balanced diet, the appeal of low-fat dairy options is surging, reinforced by government initiatives and awareness campaigns focused on healthy eating habits.
Georgia Low Fat Dairy Products Market Year-wise Growth Rate and Key Drivers
This graph highlights how the Georgia Low Fat Dairy Products Market has steadily grown over the years, supported by major growth factors.
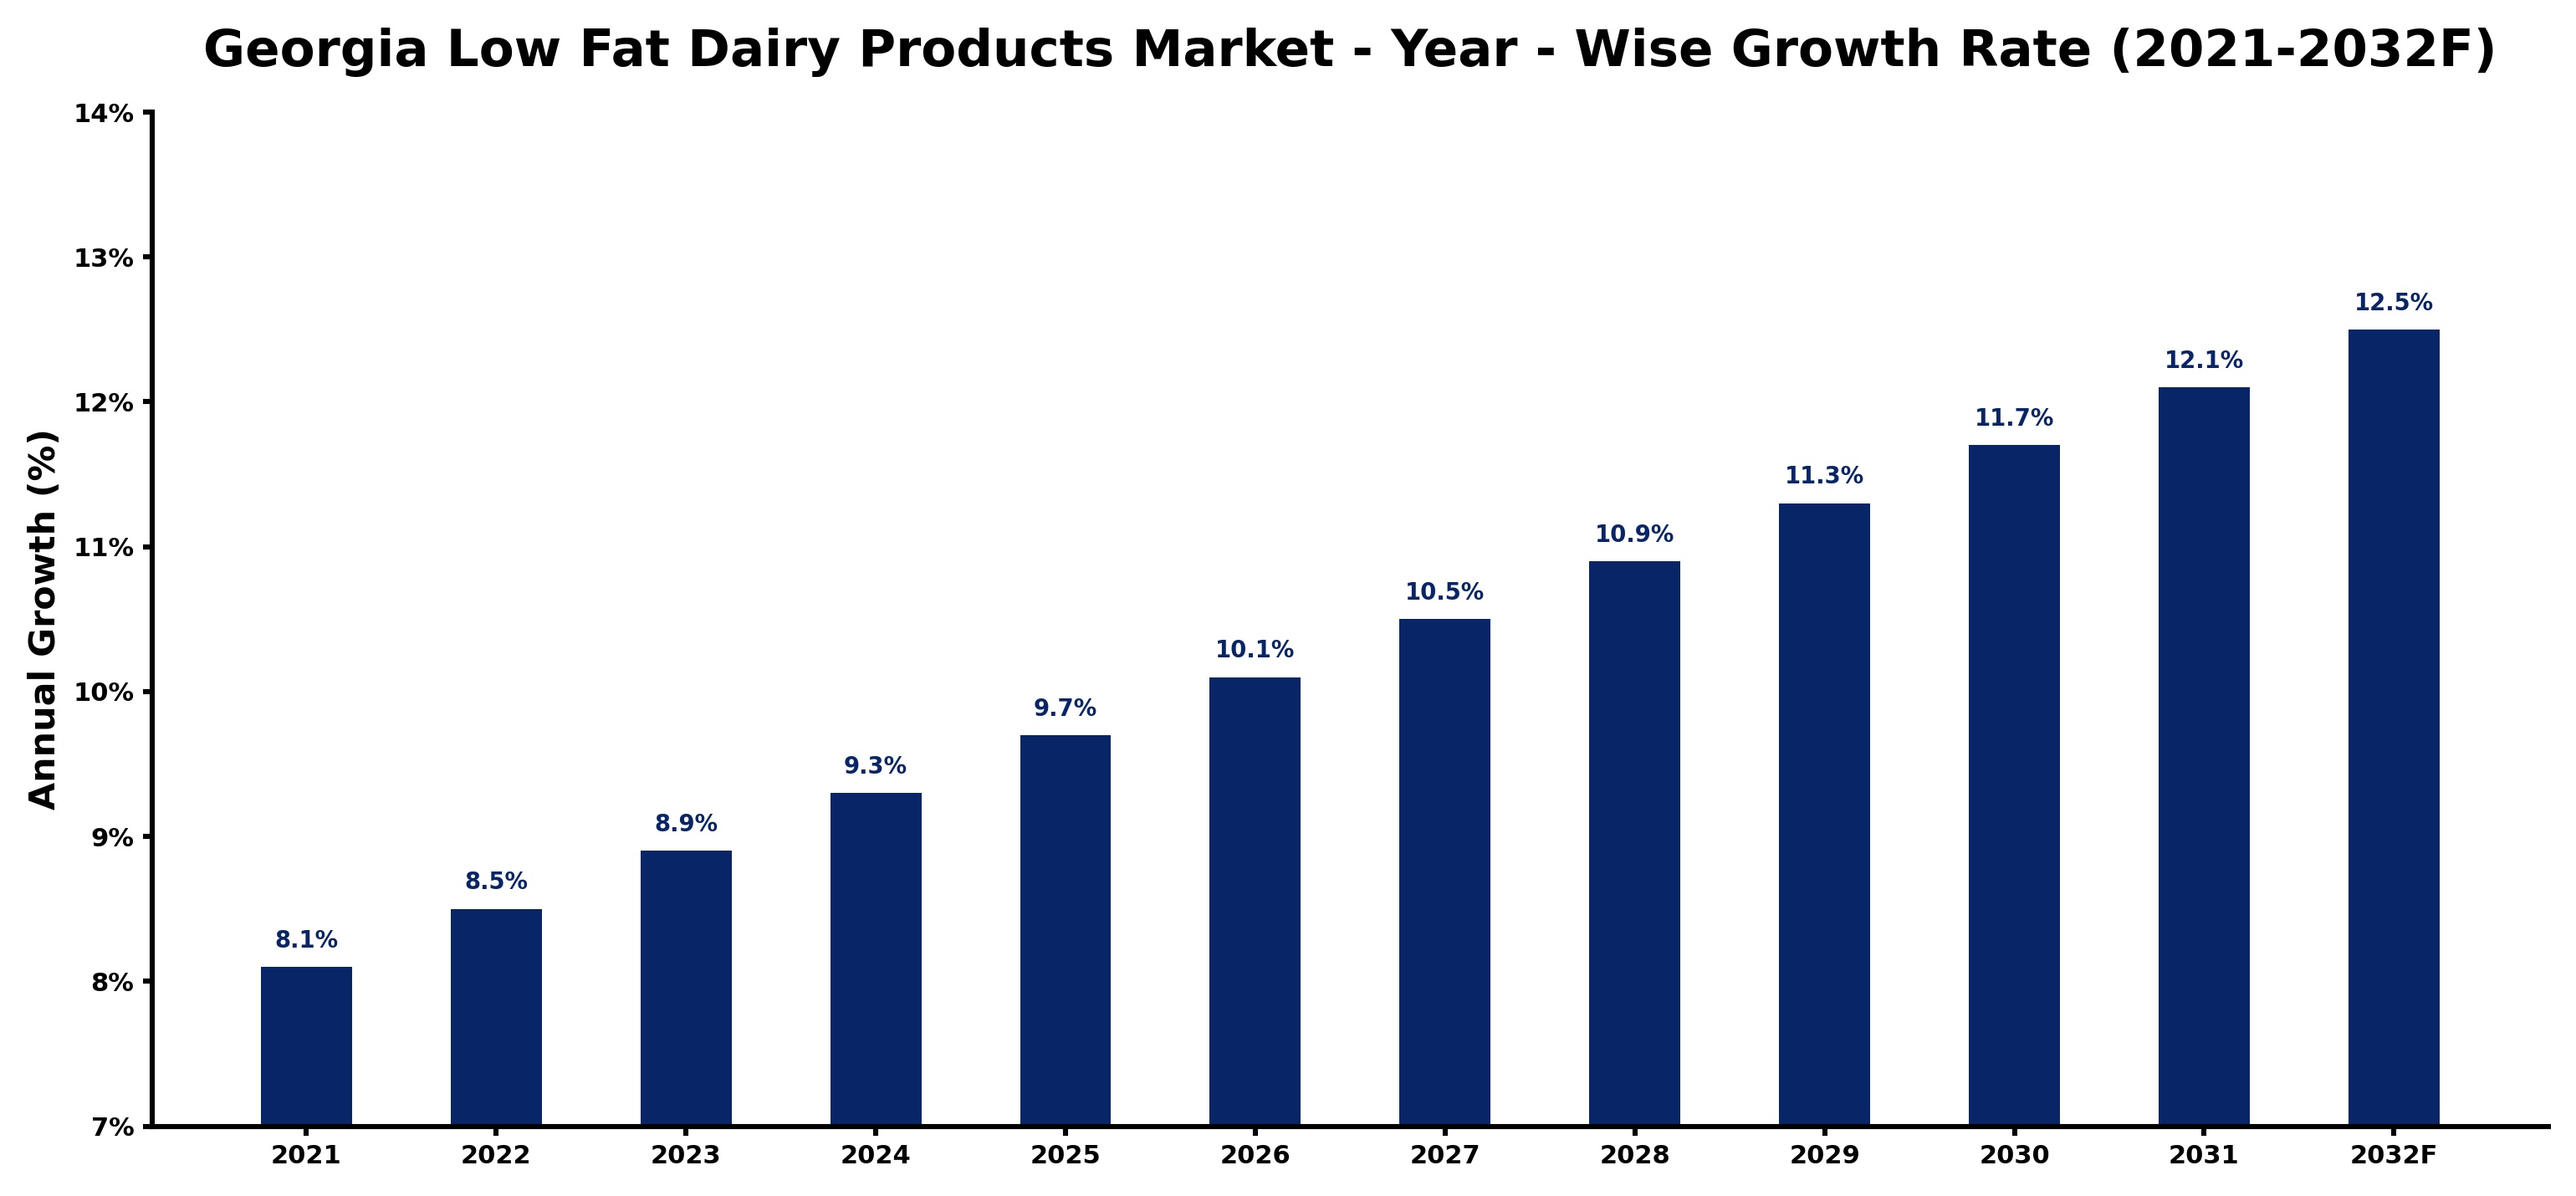
The table below presents the year‑wise growth rates along with the key drivers influencing the market
| Year | Growth Rate | Major Drivers |
| 2021 | 8.1% | Health consciousness drove demand |
| 2022 | 8.5% | Innovative product launches increased |
| 2023 | 8.9% | Sustainability trends influenced purchases |
| 2024 | 9.3% | Consumer education enhanced awareness |
| 2025 | 9.7% | Fitness trends promoted low fat |
| 2026 | 10.1% | Increased availability in stores |
| 2027 | 10.5% | Local sourcing gained popularity |
| 2028 | 10.9% | Dairy alternatives expanded market |
| 2029 | 11.3% | Nutritional benefits highlighted marketing |
| 2030 | 11.7% | Collaborations with fitness influencers |
| 2031 | 12.1% | E-commerce growth improved access |
| 2032 | 12.5% | Dietary trends favored low fat |
Note - Market size estimations and growth projections presented in this report are based on 6Wresearch’s advanced forecasting approach, validated with industry datasets as of June 2026.
Georgia Low Fat Dairy Products Market Synopsis
Consumer health consciousness is the strongest force shaping the Georgia Low Fat Dairy Products Market. With more individuals making informed dietary choices, the demand for low-fat alternatives to traditional dairy has soared, prompting manufacturers to innovate and diversify their product offerings.
Furthermore, the local dairy industry is responding effectively to these changing preferences. By investing in advanced processing technologies and formulation innovations, they are expanding the availability of low-fat dairy options, ensuring that consumer needs are met with quality products.
Georgia Low Fat Dairy Products Market Key Takeaways
- The market is driven by a significant rise in health consciousness among consumers.
- Innovations in product formulation are enhancing the appeal of low-fat dairy options.
- Government initiatives are fostering a healthier eating culture, benefiting low-fat dairy demand.
- Consistent product quality poses technical challenges for manufacturers in this sector.
- Pricing pressures and market saturation require strategic approaches from producers.
Evaluation of Restraints in Georgia Low Fat Dairy Products Market
Despite the positive growth trajectory, the Georgia Low Fat Dairy Products Market faces several significant restraints. Consumer perception plays a pivotal role; some individuals remain skeptical about the taste and quality of low-fat options compared to full-fat counterparts. Moreover, the rise of non-dairy alternatives adds another layer of competition, challenging traditional dairy players. Additionally, manufacturers must navigate the complexities of maintaining consistent product quality while adhering to low-fat specifications, creating hurdles in production efficiency and overall market performance.
Georgia Low Fat Dairy Products Market Trends
Several key trends are emerging in the Georgia Low Fat Dairy Products Market. The increasing interest in plant-based diets has prompted dairy producers to explore hybrid options, combining dairy and non-dairy ingredients to cater to a broader audience. Additionally, consumers are seeking transparency regarding sourcing and production methods, driving demand for organic and locally-sourced low-fat dairy products.
Technological advancements in processing methods are also shaping the market landscape. Innovations aimed at enhancing flavor and texture while maintaining lower fat content are paving the way for more appealing product lines, catering to diverse consumer preferences.
Georgia Low Fat Dairy Products Market Opportunities
Opportunities abound in the Georgia Low Fat Dairy Products Market as consumer demand continues to evolve. There is a substantial potential for growth in value-added products, including low-fat yogurts and cheeses, which can cater to health-focused consumers. Additionally, partnerships with local health initiatives and educational programs can bolster brand visibility and foster community support. The burgeoning interest in personalized nutrition also presents avenues for customized dairy products tailored to specific dietary needs.
Government Initiatives in the Georgia Low Fat Dairy Products Market
The government of Georgia has implemented various regulations and standards that reinforce the safety and quality of low-fat dairy products. These regulations encompass production practices, labeling requirements, and health standards, aiming to promote consumer safety while encouraging the growth of the local dairy industry. Through public health campaigns and initiatives focused on nutrition education, the government is actively fostering a culture that values healthier dietary choices.
Future Insights of the Georgia Low Fat Dairy Products Market
Looking ahead to the period from 2026 to 2032, the Georgia Low Fat Dairy Products Market is poised for dynamic growth. As health trends continue to influence purchasing behavior, manufacturers that adapt swiftly to consumer demands will find themselves at a competitive advantage. The ongoing emphasis on innovation and sustainability will likely play a crucial role in shaping product development, ensuring that the market remains aligned with consumer expectations for quality and health benefits.
Georgia Low Fat Dairy Products Market Latest Developments (May 2025 - June 2026)
In recent months, the Georgia Low Fat Dairy Products Market has witnessed notable developments, including the introduction of several new product lines designed to appeal to health-conscious consumers. Efforts to enhance product labeling and transparency have increased, with manufacturers prioritizing clear communication of nutritional benefits. Additionally, collaborations between local dairy producers and health-focused organizations have emerged, aiming to promote low-fat dairy consumption through community initiatives and educational programs.
Georgia Low Fat Dairy Products Market - Key Attractiveness of the Report
- 10 Years of Market Numbers
- Historical Data Starting from 2022 to 2025
- Base Year: 2025
- Forecast Data until 2032
- Key Performance Indicators Impacting the Market
- Major Upcoming Developments and Projects
Key Highlights of the Report:
- Georgia Low Fat Dairy Products Market Outlook
- Market Size of Georgia Low Fat Dairy Products Market, 2025
- Forecast of Georgia Low Fat Dairy Products Market, 2032
- Historical Data and Forecast of Georgia Low Fat Dairy Products Revenues & Volume for the Period 2022-2032F
- Georgia Low Fat Dairy Products Market Trend Evolution
- Georgia Low Fat Dairy Products Market Drivers and Challenges
- Georgia Low Fat Dairy Products Price Trends
- Georgia Low Fat Dairy Products Porter's Five Forces
- Georgia Low Fat Dairy Products Industry Life Cycle
- Historical Data and Forecast of Georgia Low Fat Dairy Products Market Revenues & Volume By Nature for the Period 2022-2032F
- Historical Data and Forecast of Georgia Low Fat Dairy Products Market Revenues & Volume By Organic for the Period 2022-2032F
- Historical Data and Forecast of Georgia Low Fat Dairy Products Market Revenues & Volume By Conventional for the Period 2022-2032F
- Historical Data and Forecast of Georgia Low Fat Dairy Products Market Revenues & Volume By Type for the Period 2022-2032F
- Historical Data and Forecast of Georgia Low Fat Dairy Products Market Revenues & Volume By Low Fat Butter for the Period 2022-2032F
- Historical Data and Forecast of Georgia Low Fat Dairy Products Market Revenues & Volume By Low Fat Cheese for the Period 2022-2032F
- Historical Data and Forecast of Georgia Low Fat Dairy Products Market Revenues & Volume By Low Fat Yoghurt for the Period 2022-2032F
- Historical Data and Forecast of Georgia Low Fat Dairy Products Market Revenues & Volume By Low Fat Ice Cream for the Period 2022-2032F
- Historical Data and Forecast of Georgia Low Fat Dairy Products Market Revenues & Volume By Reduced Fat Margarine for the Period 2022-2032F
- Historical Data and Forecast of Georgia Low Fat Dairy Products Market Revenues & Volume By Fat Free Condensed Milk for the Period 2022-2032F
- Historical Data and Forecast of Georgia Low Fat Dairy Products Market Revenues & Volume By Skimmed Milk for the Period 2022-2032F
- Historical Data and Forecast of Georgia Low Fat Dairy Products Market Revenues & Volume By Others for the Period 2022-2032F
- Historical Data and Forecast of Georgia Low Fat Dairy Products Market Revenues & Volume By Distribution Channel for the Period 2022-2032F
- Historical Data and Forecast of Georgia Low Fat Dairy Products Market Revenues & Volume By Supermarkets and Hypermarkets for the Period 2022-2032F
- Historical Data and Forecast of Georgia Low Fat Dairy Products Market Revenues & Volume By Convenience Stores for the Period 2022-2032F
- Historical Data and Forecast of Georgia Low Fat Dairy Products Market Revenues & Volume By Dairy Stores for the Period 2022-2032F
- Historical Data and Forecast of Georgia Low Fat Dairy Products Market Revenues & Volume By Online for the Period 2022-2032F
- Historical Data and Forecast of Georgia Low Fat Dairy Products Market Revenues & Volume By Others for the Period 2022-2032F
- Georgia Low Fat Dairy Products Import Export Trade Statistics
- Market Opportunity Assessment By Nature
- Market Opportunity Assessment By Type
- Market Opportunity Assessment By Distribution Channel
- Georgia Low Fat Dairy Products Top Companies Market Share
- Georgia Low Fat Dairy Products Competitive Benchmarking By Technical and Operational Parameters
- Georgia Low Fat Dairy Products Company Profiles
- Georgia Low Fat Dairy Products Key Strategic Recommendations
Georgia Low Fat Dairy Products Market - Frequently Asked Questions
The primary driver is the rising health consciousness among consumers who prefer low-fat options as part of a balanced diet. Government initiatives promoting healthy eating are also contributing significantly to market expansion.
The Georgia Low Fat Dairy Products Market was estimated at USD 1150 Million in 2025 and is projected to reach USD 2070 Million by 2032, indicating a CAGR of 8.8% from 2026 to 2032.
Yes, a notable trend is the increasing preference for organic and locally-sourced low-fat dairy products, along with innovations that enhance flavor without adding fat.
Government regulations play a crucial role by ensuring quality and safety standards are met, which in turn boosts consumer trust and encourages market growth.
Manufacturers encounter challenges including maintaining consistent quality in low-fat products and competition from non-dairy alternatives that appeal to a similar health-focused demographic.
6Wresearch actively monitors the Georgia Low Fat Dairy Products Market and publishes its comprehensive annual report, highlighting emerging trends, growth drivers, revenue analysis, and forecast outlook. Our insights help businesses to make data-backed strategic decisions with ongoing market dynamics. Our analysts track relevent industries related to the Georgia Low Fat Dairy Products Market, allowing our clients with actionable intelligence and reliable forecasts tailored to emerging regional needs.
Yes, we provide customisation as per your requirements. To learn more, feel free to contact us on sales@6wresearch.com
1 Executive Summary |
2 Introduction |
2.1 Key Highlights of the Report |
2.2 Report Description |
2.3 Market Scope & Segmentation |
2.4 Research Methodology |
2.5 Assumptions |
3 Georgia Low Fat Dairy Products Market Overview |
3.1 Georgia Country Macro Economic Indicators |
3.2 Georgia Low Fat Dairy Products Market Revenues & Volume, 2022 & 2032F |
3.3 Georgia Low Fat Dairy Products Market - Industry Life Cycle |
3.4 Georgia Low Fat Dairy Products Market - Porter's Five Forces |
3.5 Georgia Low Fat Dairy Products Market Revenues & Volume Share, By Nature, 2022 & 2032F |
3.6 Georgia Low Fat Dairy Products Market Revenues & Volume Share, By Type, 2022 & 2032F |
3.7 Georgia Low Fat Dairy Products Market Revenues & Volume Share, By Distribution Channel, 2022 & 2032F |
4 Georgia Low Fat Dairy Products Market Dynamics |
4.1 Impact Analysis |
4.2 Market Drivers |
4.2.1 Increasing consumer awareness about the importance of a healthy diet and lifestyle |
4.2.2 Rising demand for low-fat dairy products due to health consciousness |
4.2.3 Growing availability and variety of low-fat dairy products in the market |
4.3 Market Restraints |
4.3.1 Fluctuating prices of raw materials impacting production costs |
4.3.2 Intense competition from other dairy product alternatives |
4.3.3 Regulatory challenges related to labeling and health claims on low-fat dairy products |
5 Georgia Low Fat Dairy Products Market Trends |
6 Georgia Low Fat Dairy Products Market, By Types |
6.1 Georgia Low Fat Dairy Products Market, By Nature |
6.1.1 Overview and Analysis |
6.1.2 Georgia Low Fat Dairy Products Market Revenues & Volume, By Nature, 2022-2032F |
6.1.3 Georgia Low Fat Dairy Products Market Revenues & Volume, By Organic, 2022-2032F |
6.1.4 Georgia Low Fat Dairy Products Market Revenues & Volume, By Conventional, 2022-2032F |
6.2 Georgia Low Fat Dairy Products Market, By Type |
6.2.1 Overview and Analysis |
6.2.2 Georgia Low Fat Dairy Products Market Revenues & Volume, By Low Fat Butter, 2022-2032F |
6.2.3 Georgia Low Fat Dairy Products Market Revenues & Volume, By Low Fat Cheese, 2022-2032F |
6.2.4 Georgia Low Fat Dairy Products Market Revenues & Volume, By Low Fat Yoghurt, 2022-2032F |
6.2.5 Georgia Low Fat Dairy Products Market Revenues & Volume, By Low Fat Ice Cream, 2022-2032F |
6.2.6 Georgia Low Fat Dairy Products Market Revenues & Volume, By Reduced Fat Margarine, 2022-2032F |
6.2.7 Georgia Low Fat Dairy Products Market Revenues & Volume, By Fat Free Condensed Milk, 2022-2032F |
6.2.8 Georgia Low Fat Dairy Products Market Revenues & Volume, By Others, 2022-2032F |
6.2.9 Georgia Low Fat Dairy Products Market Revenues & Volume, By Others, 2022-2032F |
6.3 Georgia Low Fat Dairy Products Market, By Distribution Channel |
6.3.1 Overview and Analysis |
6.3.2 Georgia Low Fat Dairy Products Market Revenues & Volume, By Supermarkets and Hypermarkets, 2022-2032F |
6.3.3 Georgia Low Fat Dairy Products Market Revenues & Volume, By Convenience Stores, 2022-2032F |
6.3.4 Georgia Low Fat Dairy Products Market Revenues & Volume, By Dairy Stores, 2022-2032F |
6.3.5 Georgia Low Fat Dairy Products Market Revenues & Volume, By Online, 2022-2032F |
6.3.6 Georgia Low Fat Dairy Products Market Revenues & Volume, By Others, 2022-2032F |
7 Georgia Low Fat Dairy Products Market Import-Export Trade Statistics |
7.1 Georgia Low Fat Dairy Products Market Export to Major Countries |
7.2 Georgia Low Fat Dairy Products Market Imports from Major Countries |
8 Georgia Low Fat Dairy Products Market Key Performance Indicators |
8.1 Consumer engagement with low-fat dairy product marketing campaigns |
8.2 Percentage of households incorporating low-fat dairy products into their regular diet |
8.3 Number of new product launches in the low-fat dairy segment |
8.4 Growth in online sales of low-fat dairy products |
8.5 Percentage of repeat purchases of low-fat dairy products |
9 Georgia Low Fat Dairy Products Market - Opportunity Assessment |
9.1 Georgia Low Fat Dairy Products Market Opportunity Assessment, By Nature, 2022 & 2032F |
9.2 Georgia Low Fat Dairy Products Market Opportunity Assessment, By Type, 2022 & 2032F |
9.3 Georgia Low Fat Dairy Products Market Opportunity Assessment, By Distribution Channel, 2022 & 2032F |
10 Georgia Low Fat Dairy Products Market - Competitive Landscape |
10.1 Georgia Low Fat Dairy Products Market Revenue Share, By Companies, 2025 |
10.2 Georgia Low Fat Dairy Products Market Competitive Benchmarking, By Operating and Technical Parameters |
11 Company Profiles |
12 Recommendations |
13 Disclaimer |
Global Go To Market Strategy - 2030
Export potential enables firms to identify high-growth global markets with greater confidence by combining advanced trade intelligence with a structured quantitative methodology. The framework analyzes emerging demand trends and country-level import patterns while integrating macroeconomic and trade datasets such as GDP and population forecasts, bilateral import–export flows, tariff structures, elasticity differentials between developed and developing economies, geographic distance, and import demand projections. Using weighted trade values from 2020–2024 as the base period to project country-to-country export potential for 2030, these inputs are operationalized through calculated drivers such as gravity model parameters, tariff impact factors, and projected GDP per-capita growth. Through an analysis of hidden potentials, demand hotspots, and market conditions that are most favorable to success, this method enables firms to focus on target countries, maximize returns, and global expansion with data, backed by accuracy.
By factoring in the projected importer demand gap that is currently unmet and could be potential opportunity, it identifies the potential for the Exporter (Country) among 190 countries, against the general trade analysis, which identifies the biggest importer or exporter.
To discover high-growth global markets and optimize your business strategy:
Click Here
Pricing
- Single User License$ 1,995
- Department License$ 2,400
- Site License$ 3,120
- Global License$ 3,795

Leadership Perspectives from Industry Events
Search
Thought Leadership and Analyst Meet


Our Clients
6WResearch In News
- India Air Conditioner Market Set for Strong Rebound in 2026 After Weather-Led Correction and GST-Driven Recovery: 6Wresearch
- ADAS in India: How Automatic Emergency Braking, Blind Spot Detection & Driver Monitoring are Transforming Road Safety
- Doha a strategic location for EV manufacturing hub: IPA Qatar
- Demand for luxury TVs surging in the GCC, says Samsung
- Empowering Growth: The Thriving Journey of Bangladesh’s Cable Industry
- Demand for luxury TVs surging in the GCC, says Samsung
Latest Reports
- Nicaragua RPG Gaming Market (2026-2032)
- New Zealand RPG Gaming Market (2026-2032)
- Netherlands RPG Gaming Market (2026-2032)
- Nauru RPG Gaming Market (2026-2032)
- Namibia RPG Gaming Market (2026-2032)
- Mozambique RPG Gaming Market (2026-2032)
- Montenegro RPG Gaming Market (2026-2032)
- Mongolia RPG Gaming Market (2026-2032)
- Monaco RPG Gaming Market (2026-2032)
- Micronesia RPG Gaming Market (2026-2032)
Industry Events and Analyst Meet

EV India Expo 2026

HIMTEX 2026

India Refining Summit 2026

India EV Show 2026

EV tech India Expo 2026
Whitepaper
- Middle East & Africa Commercial Security Market Click here to view more.
- Middle East & Africa Fire Safety Systems & Equipment Market Click here to view more.
- GCC Drone Market Click here to view more.
- Middle East Lighting Fixture Market Click here to view more.
- GCC Physical & Perimeter Security Market Click here to view more.