Georgia Personal Care Active Ingredients Market (2026-2032) Outlook | Size, Share, Analysis, Trends, Value, Forecast, Growth, Revenue, Industry & Companies
Market Forecast By Products (Hair Care, Skin Care, Bath and Shower, Oral Care, Men™s Grooming, Other Personal Care Products), By Gender (Women, Men), By Distribution Channel (Direct Selling, Hypermarkets and Retail Chains, E-Commerce, Specialty Stores, Other Distribution Channels) And Competitive Landscape
| Product Code: ETC069679 | Publication Date: Jun 2021 | Updated Date: Jun 2026 | Product Type: Report | |
| Publisher: 6Wresearch | Author: Shubham Deep | No. of Pages: 70 | No. of Figures: 35 | No. of Tables: 5 |
Georgia Personal Care Active Ingredients Market Size, Share & Growth Rate
The Georgia Personal Care Active Ingredients Market was estimated at USD 205 Million in 2025 and is projected to reach USD 273 Million by 2032, growing at a CAGR of 4.2% from 2026 to 2032. This growth trajectory is primarily driven by increasing consumer demand for innovative and high-quality personal care products, along with a notable shift towards natural and sustainable ingredients. As awareness around clean beauty and eco-conscious products grows, the market is expected to respond dynamically with a range of new active ingredients designed to meet these evolving consumer preferences.
Georgia Personal Care Active Ingredients Market Growth Rate Analysis (2021-2032)
The Georgia Personal Care Active Ingredients market has been characterized by steady growth, recording a 5.0% increase in 2021, followed by slight fluctuations that reflect both consumer demand and market dynamics. A notable 4.9% growth in 2022 was attributed to rising awareness of sustainable and natural ingredients. The market rebounded with a 5.2% expansion in 2023, driven by technological advancements in formulations and increased investments in research and development. Despite a dip to 4.7% in 2025, the market stabilized around 5.0% through 2028, as manufacturers adapted to evolving regulatory landscapes and consumer preferences. Looking ahead, a projected 5.2% growth in 2031 highlights ongoing innovations and robust market resilience in response to dynamic consumer trends.
Georgia Personal Care Active Ingredients Market Year-wise Growth Rate and Key Drivers
This graph highlights how the Georgia Personal Care Active Ingredients Market has steadily grown over the past five years, supported by major growth factors.
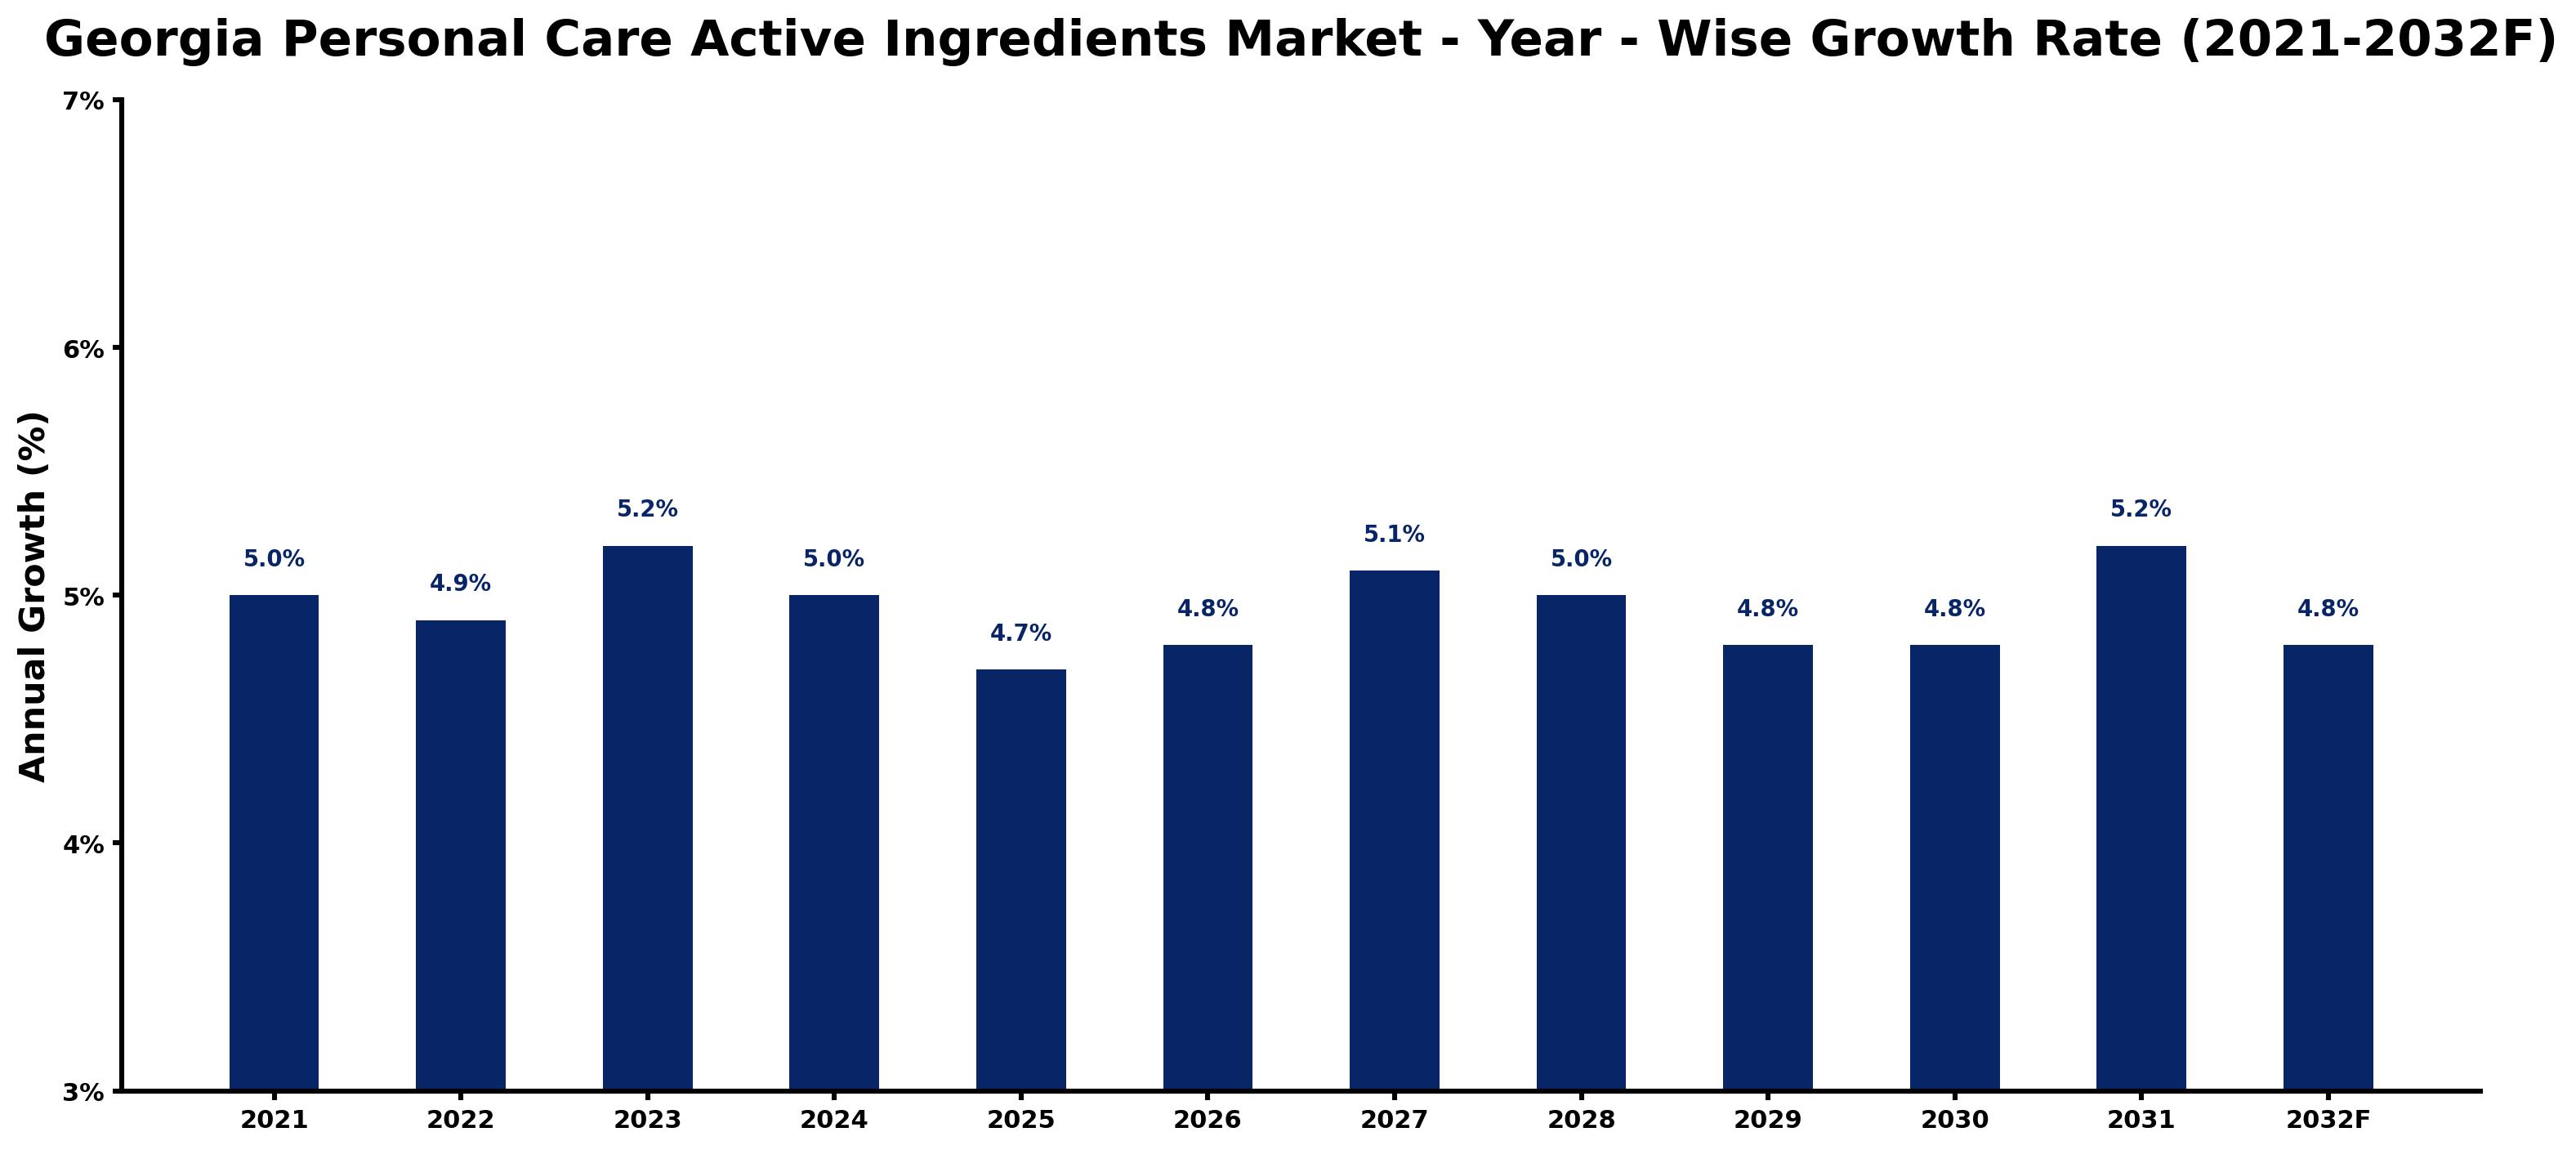
The table below presents the year‑wise growth rates along with the key drivers influencing the market
| Year | Growth Rate | Major Drivers |
| 2021 | 5.0% | Increasing industrial infrastructure investments |
| 2022 | 4.9% | Expansion of transportation and logistics networks |
| 2023 | 5.2% | Increasing industrial automation investments |
| 2024 | 5.0% | Expansion of manufacturing activities |
| 2025 | 4.7% | Expansion of transportation and logistics networks |
| 2026 | 4.8% | Expansion of commercial construction activities |
| 2027 | 5.1% | Rising electricity demand across industries |
| 2028 | 5.0% | Increasing industrial automation investments |
| 2029 | 4.8% | Government infrastructure modernization initiatives |
| 2030 | 4.8% | Rising electricity demand across industries |
| 2031 | 5.2% | Expansion of transportation and logistics networks |
| 2032 | 4.8% | Expansion of commercial construction activities |
Note - Market size estimations and growth projections presented in this report are based on 6Wresearch’s advanced forecasting approach, validated with industry datasets as of June 2026.
Georgia Personal Care Active Ingredients Market Synopsis
The most significant force shaping the Georgia Personal Care Active Ingredients Market is the rising consumer inclination towards clean and sustainable beauty solutions. This shift is prompting manufacturers to develop products featuring natural and organic active ingredients that meet consumer expectations for safety and efficacy.
Moreover, the growing popularity of multifunctional ingredients is reshaping product formulations. Consumers are increasingly seeking active components that provide multiple benefits, such as anti-aging, hydration, and protection against environmental stressors, which are becoming essential attributes in personal care offerings.
Georgia Personal Care Active Ingredients Market Key Takeaways
- The market is increasingly driven by a preference for natural and organic active ingredients.
- Innovations are emerging in ingredients derived from marine plants and biotechnology.
- Personalization in skincare solutions is gaining traction among consumers.
- Investment in research and development is vital for local manufacturers to keep pace with global trends.
- Regulatory compliance remains a critical challenge for companies in the market.
Evaluation of Restraints in Georgia Personal Care Active Ingredients Market
Despite the positive outlook, the Georgia Personal Care Active Ingredients Market faces several constraints. Chief among these is the intensifying competition from international suppliers offering lower-priced alternatives, which can undermine local manufacturers. Additionally, fluctuating raw material costs pose challenges for consistent pricing and profitability. Changing consumer preferences for sustainability can leave companies struggling to adapt quickly enough, potentially resulting in lost market share. The complex regulatory landscape surrounding ingredient safety and efficacy also requires substantial investment in testing and certification, further complicating operational dynamics for many businesses.
Georgia Personal Care Active Ingredients Market Trends
Current trends indicate a significant shift towards natural and organic active ingredients as consumer demand for clean beauty products continues to rise. Companies are increasingly adopting plant-based formulations and focusing on sustainability to address this need. Furthermore, there is a growing interest in multifunctional ingredients that cater to multiple skincare concerns simultaneously, which can enhance product appeal and efficacy. Innovations utilizing biotechnology and natural sources such as marine plants are also making waves, enabling the development of advanced, effective personal care solutions.
Georgia Personal Care Active Ingredients Market Opportunities
The market presents several lucrative investment opportunities, particularly as the demand for sustainable and innovative active ingredients escalates. Stakeholders can capitalize on the consumer trend towards clean beauty by funding research that explores new, high-quality active ingredients sourced from nature. Additionally, partnerships with local suppliers of raw materials may foster more sustainable production processes. With Georgia's diverse botanical resources, the potential for developing cutting-edge active ingredients tailored to the modern consumer is substantial, marking a clear pathway for future growth.
Government Initiatives in the Georgia Personal Care Active Ingredients Market
The Georgia government has enacted policies designed to support the Personal Care Active Ingredients Market, with an emphasis on consumer safety and environmental sustainability. Regulatory frameworks ensure that active ingredients meet stringent quality control standards, promoting transparency in labeling and advertising. Initiatives that encourage the use of sustainable materials and eco-friendly practices further align industry growth with broader public health objectives, creating a balanced approach to economic and environmental considerations.
Future Insights of the Georgia Personal Care Active Ingredients Market
Looking ahead to the period from 2026 to 2032, the Georgia Personal Care Active Ingredients Market is poised for consistent growth, driven by rising consumer awareness and an increasing preference for natural and organic products. Innovations in ingredient development will likely be fueled by advancements in biotechnology and a push for sustainability. The trend of personalization in beauty products will also enhance the demand for targeted active ingredients, presenting opportunities for manufacturers to deliver bespoke solutions that cater to individual skin concerns.
Georgia Personal Care Active Ingredients Market Latest Developments (May 2025 - June 2026)
Recent developments in the Georgia Personal Care Active Ingredients Market show a marked increase in research initiatives aimed at discovering and commercializing innovative natural ingredients. Industry players are focusing on sustainability, with many companies adopting eco-friendly practices in their production processes. Additionally, there is a noticeable rise in collaborative ventures between local suppliers and formulators, aiming to enhance the quality and efficacy of personal care products.
Georgia Personal Care Active Ingredients Market - Key Attractiveness of the Report
- 10 Years of Market Numbers
- Historical Data Starting from 2022 to 2025
- Base Year: 2025
- Forecast Data until 2032
- Key Performance Indicators Impacting the Market
- Major Upcoming Developments and Projects
Key Highlights of the Report:
- Georgia Personal Care Active Ingredients Market Outlook
- Market Size of Georgia Personal Care Active Ingredients Market, 2025
- Forecast of Georgia Personal Care Active Ingredients Market, 2032
- Historical Data and Forecast of Georgia Personal Care Active Ingredients Revenues & Volume for the Period 2022-2032F
- Georgia Personal Care Active Ingredients Market Trend Evolution
- Georgia Personal Care Active Ingredients Market Drivers and Challenges
- Georgia Personal Care Active Ingredients Price Trends
- Georgia Personal Care Active Ingredients Porter's Five Forces
- Georgia Personal Care Active Ingredients Industry Life Cycle
- Historical Data and Forecast of Georgia Personal Care Active Ingredients Market Revenues & Volume By Products for the Period 2022-2032F
- Historical Data and Forecast of Georgia Personal Care Active Ingredients Market Revenues & Volume By Hair Care for the Period 2022-2032F
- Historical Data and Forecast of Georgia Personal Care Active Ingredients Market Revenues & Volume By Skin Care for the Period 2022-2032F
- Historical Data and Forecast of Georgia Personal Care Active Ingredients Market Revenues & Volume By Bath and Shower for the Period 2022-2032F
- Historical Data and Forecast of Georgia Personal Care Active Ingredients Market Revenues & Volume By Oral Care for the Period 2022-2032F
- Historical Data and Forecast of Georgia Personal Care Active Ingredients Market Revenues & Volume By Men??s Grooming for the Period 2022-2032F
- Historical Data and Forecast of Georgia Personal Care Active Ingredients Market Revenues & Volume By Other Personal Care Products for the Period 2022-2032F
- Historical Data and Forecast of Georgia Personal Care Active Ingredients Market Revenues & Volume By Gender for the Period 2022-2032F
- Historical Data and Forecast of Georgia Personal Care Active Ingredients Market Revenues & Volume By Women for the Period 2022-2032F
- Historical Data and Forecast of Georgia Personal Care Active Ingredients Market Revenues & Volume By Men for the Period 2022-2032F
- Historical Data and Forecast of Georgia Personal Care Active Ingredients Market Revenues & Volume By Distribution Channel for the Period 2022-2032F
- Historical Data and Forecast of Georgia Personal Care Active Ingredients Market Revenues & Volume By Direct Selling for the Period 2022-2032F
- Historical Data and Forecast of Georgia Personal Care Active Ingredients Market Revenues & Volume By Hypermarkets and Retail Chains for the Period 2022-2032F
- Historical Data and Forecast of Georgia Personal Care Active Ingredients Market Revenues & Volume By E-Commerce for the Period 2022-2032F
- Historical Data and Forecast of Georgia Personal Care Active Ingredients Market Revenues & Volume By Specialty Stores for the Period 2022-2032F
- Historical Data and Forecast of Georgia Personal Care Active Ingredients Market Revenues & Volume By Other Distribution Channels for the Period 2022-2032F
- Georgia Personal Care Active Ingredients Import Export Trade Statistics
- Market Opportunity Assessment By Products
- Market Opportunity Assessment By Gender
- Market Opportunity Assessment By Distribution Channel
- Georgia Personal Care Active Ingredients Top Companies Market Share
- Georgia Personal Care Active Ingredients Competitive Benchmarking By Technical and Operational Parameters
- Georgia Personal Care Active Ingredients Company Profiles
- Georgia Personal Care Active Ingredients Key Strategic Recommendations
Georgia Personal Care Active Ingredients Market - Frequently Asked Questions
The market is expected to grow from an estimated USD 205 Million in 2025 to USD 273 Million by 2032, achieving a CAGR of 4.2% from 2026 to 2032.
The key drivers include a heightened consumer demand for clean and sustainable products, alongside a growing interest in multifunctional ingredients that address various skin concerns.
Local manufacturers are focusing on innovation, investing in R&D for natural active ingredients, and fostering partnerships with local suppliers to enhance sustainability and product quality.
Companies must navigate complex regulations regarding ingredient safety and efficacy, necessitating significant investment in testing and compliance processes to meet industry standards.
Rising consumer awareness regarding personal care ingredients is pushing companies to prioritize transparency and sustainability in their product formulations, often leading to the incorporation of natural and organic components.
6Wresearch actively monitors the Georgia Personal Care Active Ingredients Market and publishes its comprehensive annual report, highlighting emerging trends, growth drivers, revenue analysis, and forecast outlook. Our insights help businesses to make data-backed strategic decisions with ongoing market dynamics. Our analysts track relevent industries related to the Georgia Personal Care Active Ingredients Market, allowing our clients with actionable intelligence and reliable forecasts tailored to emerging regional needs.
Yes, we provide customisation as per your requirements. To learn more, feel free to contact us on sales@6wresearch.com
1 Executive Summary |
2 Introduction |
2.1 Key Highlights of the Report |
2.2 Report Description |
2.3 Market Scope & Segmentation |
2.4 Research Methodology |
2.5 Assumptions |
3 Georgia Personal Care Active Ingredients Market Overview |
3.1 Georgia Country Macro Economic Indicators |
3.2 Georgia Personal Care Active Ingredients Market Revenues & Volume, 2022 & 2032F |
3.3 Georgia Personal Care Active Ingredients Market - Industry Life Cycle |
3.4 Georgia Personal Care Active Ingredients Market - Porter's Five Forces |
3.5 Georgia Personal Care Active Ingredients Market Revenues & Volume Share, By Products, 2022 & 2032F |
3.6 Georgia Personal Care Active Ingredients Market Revenues & Volume Share, By Gender, 2022 & 2032F |
3.7 Georgia Personal Care Active Ingredients Market Revenues & Volume Share, By Distribution Channel, 2022 & 2032F |
4 Georgia Personal Care Active Ingredients Market Dynamics |
4.1 Impact Analysis |
4.2 Market Drivers |
4.3 Market Restraints |
5 Georgia Personal Care Active Ingredients Market Trends |
6 Georgia Personal Care Active Ingredients Market, By Types |
6.1 Georgia Personal Care Active Ingredients Market, By Products |
6.1.1 Overview and Analysis |
6.1.2 Georgia Personal Care Active Ingredients Market Revenues & Volume, By Products, 2022-2032F |
6.1.3 Georgia Personal Care Active Ingredients Market Revenues & Volume, By Hair Care, 2022-2032F |
6.1.4 Georgia Personal Care Active Ingredients Market Revenues & Volume, By Skin Care, 2022-2032F |
6.1.5 Georgia Personal Care Active Ingredients Market Revenues & Volume, By Bath and Shower, 2022-2032F |
6.1.6 Georgia Personal Care Active Ingredients Market Revenues & Volume, By Oral Care, 2022-2032F |
6.1.7 Georgia Personal Care Active Ingredients Market Revenues & Volume, By Men??s Grooming, 2022-2032F |
6.1.8 Georgia Personal Care Active Ingredients Market Revenues & Volume, By Other Personal Care Products, 2022-2032F |
6.2 Georgia Personal Care Active Ingredients Market, By Gender |
6.2.1 Overview and Analysis |
6.2.2 Georgia Personal Care Active Ingredients Market Revenues & Volume, By Women, 2022-2032F |
6.2.3 Georgia Personal Care Active Ingredients Market Revenues & Volume, By Men, 2022-2032F |
6.3 Georgia Personal Care Active Ingredients Market, By Distribution Channel |
6.3.1 Overview and Analysis |
6.3.2 Georgia Personal Care Active Ingredients Market Revenues & Volume, By Direct Selling, 2022-2032F |
6.3.3 Georgia Personal Care Active Ingredients Market Revenues & Volume, By Hypermarkets and Retail Chains, 2022-2032F |
6.3.4 Georgia Personal Care Active Ingredients Market Revenues & Volume, By E-Commerce, 2022-2032F |
6.3.5 Georgia Personal Care Active Ingredients Market Revenues & Volume, By Specialty Stores, 2022-2032F |
6.3.6 Georgia Personal Care Active Ingredients Market Revenues & Volume, By Other Distribution Channels, 2022-2032F |
7 Georgia Personal Care Active Ingredients Market Import-Export Trade Statistics |
7.1 Georgia Personal Care Active Ingredients Market Export to Major Countries |
7.2 Georgia Personal Care Active Ingredients Market Imports from Major Countries |
8 Georgia Personal Care Active Ingredients Market Key Performance Indicators |
9 Georgia Personal Care Active Ingredients Market - Opportunity Assessment |
9.1 Georgia Personal Care Active Ingredients Market Opportunity Assessment, By Products, 2022 & 2032F |
9.2 Georgia Personal Care Active Ingredients Market Opportunity Assessment, By Gender, 2022 & 2032F |
9.3 Georgia Personal Care Active Ingredients Market Opportunity Assessment, By Distribution Channel, 2022 & 2032F |
10 Georgia Personal Care Active Ingredients Market - Competitive Landscape |
10.1 Georgia Personal Care Active Ingredients Market Revenue Share, By Companies, 2025 |
10.2 Georgia Personal Care Active Ingredients Market Competitive Benchmarking, By Operating and Technical Parameters |
11 Company Profiles |
12 Recommendations |
13 Disclaimer |
Global Go To Market Strategy - 2030
Export potential enables firms to identify high-growth global markets with greater confidence by combining advanced trade intelligence with a structured quantitative methodology. The framework analyzes emerging demand trends and country-level import patterns while integrating macroeconomic and trade datasets such as GDP and population forecasts, bilateral import–export flows, tariff structures, elasticity differentials between developed and developing economies, geographic distance, and import demand projections. Using weighted trade values from 2020–2024 as the base period to project country-to-country export potential for 2030, these inputs are operationalized through calculated drivers such as gravity model parameters, tariff impact factors, and projected GDP per-capita growth. Through an analysis of hidden potentials, demand hotspots, and market conditions that are most favorable to success, this method enables firms to focus on target countries, maximize returns, and global expansion with data, backed by accuracy.
By factoring in the projected importer demand gap that is currently unmet and could be potential opportunity, it identifies the potential for the Exporter (Country) among 190 countries, against the general trade analysis, which identifies the biggest importer or exporter.
To discover high-growth global markets and optimize your business strategy:
Click Here
Pricing
- Single User License$ 1,995
- Department License$ 2,400
- Site License$ 3,120
- Global License$ 3,795

Leadership Perspectives from Industry Events
Search
Thought Leadership and Analyst Meet


Our Clients
6WResearch In News
- India Air Conditioner Market Set for Strong Rebound in 2026 After Weather-Led Correction and GST-Driven Recovery: 6Wresearch
- ADAS in India: How Automatic Emergency Braking, Blind Spot Detection & Driver Monitoring are Transforming Road Safety
- Doha a strategic location for EV manufacturing hub: IPA Qatar
- Demand for luxury TVs surging in the GCC, says Samsung
- Empowering Growth: The Thriving Journey of Bangladesh’s Cable Industry
- Demand for luxury TVs surging in the GCC, says Samsung
Latest Reports
- Nicaragua RPG Gaming Market (2026-2032)
- New Zealand RPG Gaming Market (2026-2032)
- Netherlands RPG Gaming Market (2026-2032)
- Nauru RPG Gaming Market (2026-2032)
- Namibia RPG Gaming Market (2026-2032)
- Mozambique RPG Gaming Market (2026-2032)
- Montenegro RPG Gaming Market (2026-2032)
- Mongolia RPG Gaming Market (2026-2032)
- Monaco RPG Gaming Market (2026-2032)
- Micronesia RPG Gaming Market (2026-2032)
Industry Events and Analyst Meet

HIMTEX 2026

India Refining Summit 2026

India EV Show 2026

EV tech India Expo 2026

Auto Tech Asia 2026
Whitepaper
- Middle East & Africa Commercial Security Market Click here to view more.
- Middle East & Africa Fire Safety Systems & Equipment Market Click here to view more.
- GCC Drone Market Click here to view more.
- Middle East Lighting Fixture Market Click here to view more.
- GCC Physical & Perimeter Security Market Click here to view more.