Georgia Renewable Chemicals Market (2026-2032) Outlook | Forecast, Trends, Companies, Value, Growth, Analysis, Share, Size, Revenue & Industry
Market Forecast By Product Type (Alcohols, Organic Acids, Ketones, Platform Chemicals, Biopolymers, Others), By Applications (Transportation, Textiles, Food safety, Environment, Communication, Housing, Recreation, Other Applications) And Competitive Landscape
| Product Code: ETC344160 | Publication Date: Aug 2022 | Updated Date: Jul 2026 | Product Type: Market Research Report | |
| Publisher: 6Wresearch | Author: Ravi Bhandari | No. of Pages: 75 | No. of Figures: 35 | No. of Tables: 20 |
Georgia Renewable Chemicals Market Size, Share & Growth Rate
The Georgia Renewable Chemicals Market was estimated at USD 182 Million in 2025 and is projected to reach USD 251 Million by 2032, growing at a CAGR of 4.7% from 2026 to 2032. This growth trajectory is primarily driven by an increasing consumer preference for sustainable products, alongside substantial government support for green initiatives. As regulatory frameworks tighten and environmental awareness escalates, the shift towards bio-based raw materials is expected to gain significant momentum in Georgia.
Georgia Renewable Chemicals Market Year-wise Growth Rate and Key Drivers
This graph highlights how the Georgia Renewable Chemicals Market has steadily grown over the years, supported by major growth factors.
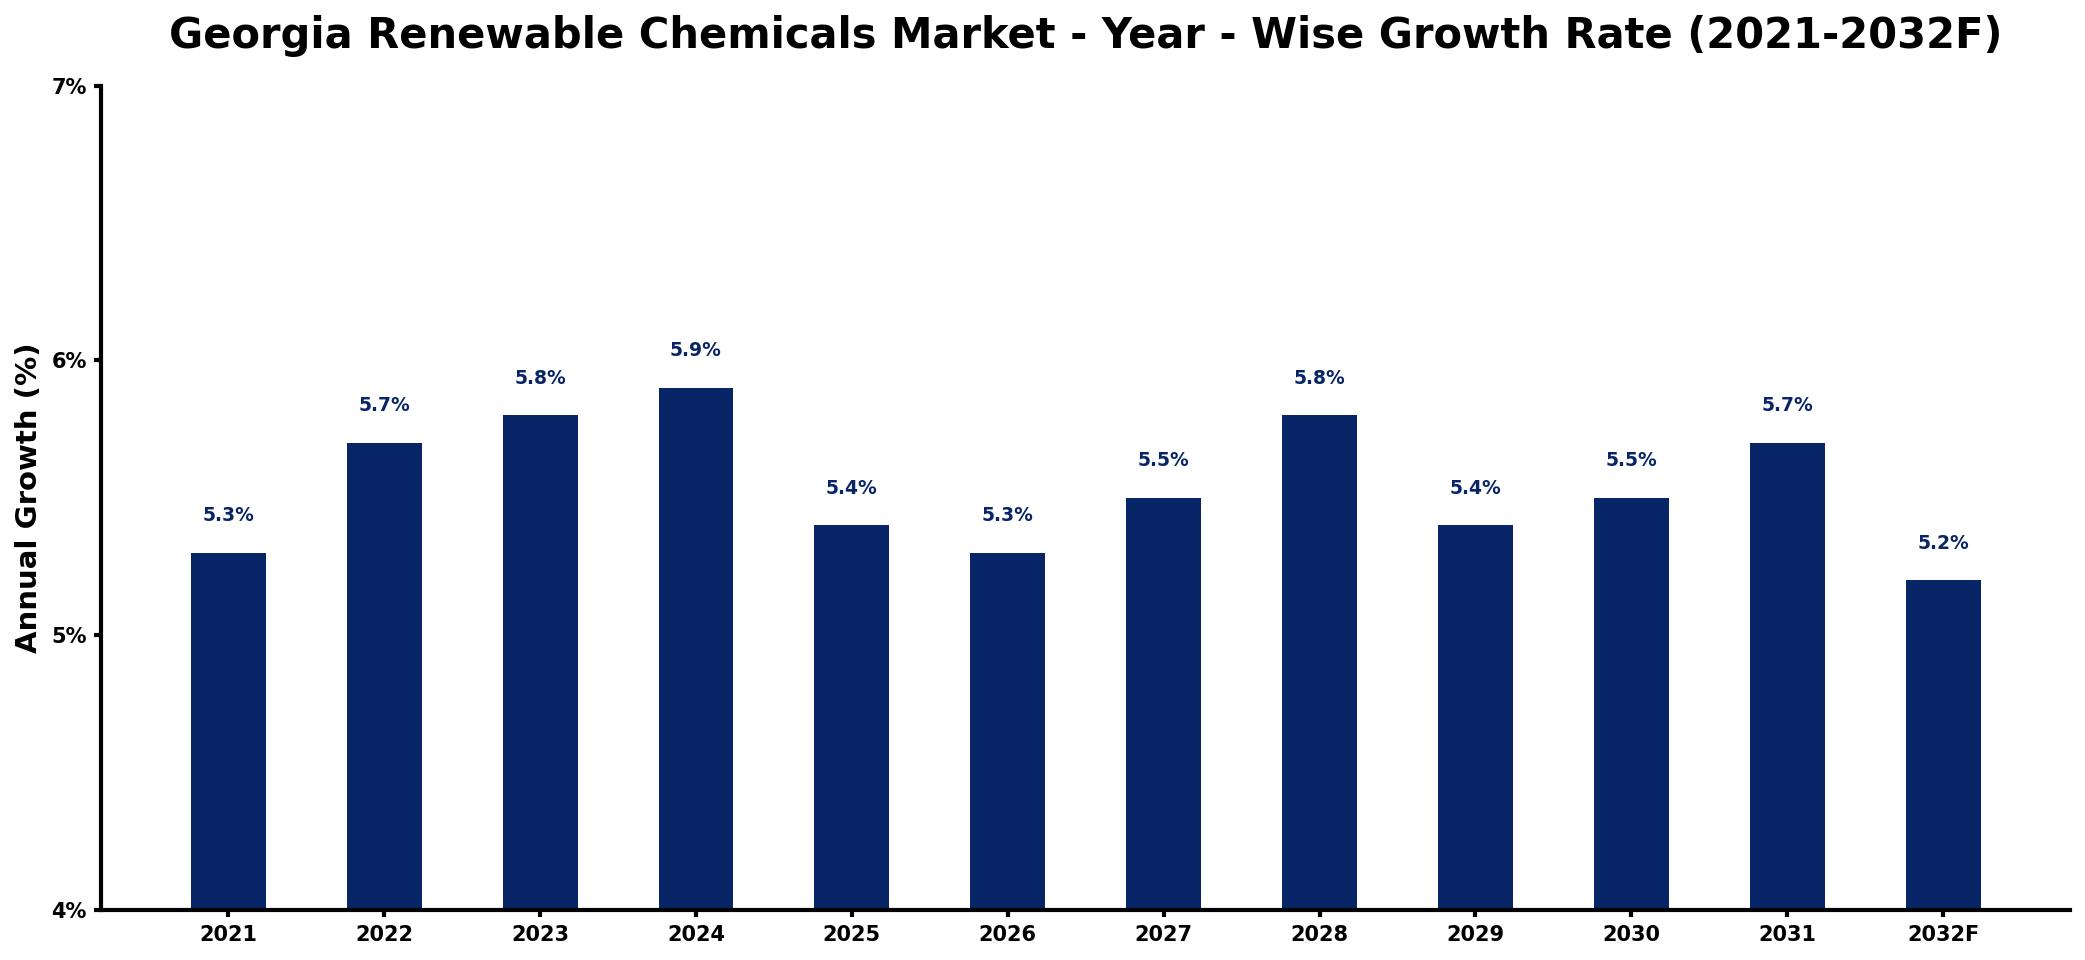
The table below presents the year‑wise growth rates along with the key drivers influencing the market
| Year | Growth Rate | Major Drivers |
| 2021 | 5.3% | Rising consumer demand for sustainability |
| 2022 | 5.7% | Increased investment in green technologies |
| 2023 | 5.8% | Expansion of eco-friendly manufacturing processes |
| 2024 | 5.9% | improved processing technologies adoption |
| 2025 | 5.4% | Higher government incentives for sustainability |
| 2026 | 5.3% | Enhanced research funding for innovations |
| 2027 | 5.5% | Emerging markets adopting sustainable practices |
| 2028 | 5.8% | Strengthened regulations promoting eco-friendly solutions |
| 2029 | 5.4% | growing emerging market penetration |
| 2030 | 5.5% | increased overall sector activity |
| 2031 | 5.7% | growing regional consumption patterns |
| 2032 | 5.2% | Increased collaboration among industry stakeholders |
Note: Market size estimations and growth projections presented in this report are based on 6Wresearch's proprietary forecasting methodology, utilizing the latest available industry data, government publications, and primary research inputs.
Georgia Renewable Chemicals Market Synopsis
In recent years, the Georgia Renewable Chemicals Market has experienced promising growth, fueled by heightened awareness of sustainability and the environmental impacts of traditional chemicals. As we look ahead, the market is poised to evolve further, spurred by continuous advancements in biotechnology and increasing corporate responsibility initiatives.
However, while the market shows strong potential, it also faces notable challenges, particularly in the areas of production scalability and cost efficiency. As businesses seek to integrate renewable chemicals into their supply chains, balancing environmental benefits with economic viability will be crucial for sustained growth in Georgia.
Georgia Renewable Chemicals Market Key Takeaways
- The shift towards renewable chemicals is being driven by stringent environmental regulations and consumer demand for sustainable products.
- Government incentives and policies supporting the bioeconomy are pivotal in shaping market dynamics.
- Despite growth prospects, challenges such as high production costs and feedstock availability persist.
- The market is benefiting from innovations in biotechnology, enhancing the feasibility of renewable chemical production.
- Georgia's commitment to sustainability is likely to bolster the renewable chemicals sector significantly.
Evaluation of Restraints in Georgia Renewable Chemicals Market
Despite its promising outlook, the Georgia Renewable Chemicals Market is currently constrained by several factors that limit its growth potential. Chief among these is the high cost of production associated with bio-based chemicals, which can deter businesses from transitioning away from more established petroleum-based options. Additionally, the limited availability of sustainable feedstocks remains a hurdle, as sourcing sufficient biomass and waste materials can be challenging. Regulatory compliance adds another layer of complexity, as manufacturers must navigate evolving standards while ensuring product performance and consistency meets market expectations. These elements collectively impede the overall competitiveness of renewable chemicals within Georgia's broader chemical landscape.
Georgia Renewable Chemicals Market Trends
Several key trends are influencing the Georgia Renewable Chemicals Market. Firstly, there is a notable rise in consumer awareness regarding environmental issues, leading to increased demand for greener alternatives across various sectors, including cosmetics and pharmaceuticals. Furthermore, advancements in biotechnology are driving innovation in the production processes, making it easier and more cost-effective to create bio-based chemicals. The integration of circular economy principles is also gaining traction, encouraging businesses to utilize waste materials as feedstocks, thereby fostering a more sustainable manufacturing ecosystem.
Georgia Renewable Chemicals Market Opportunities
The Georgia Renewable Chemicals Market presents numerous growth and investment opportunities. With the increasing push towards sustainable practices, companies have the chance to pioneer innovative bio-based products, catering to a growing segment of environmentally conscious consumers. Investments in biorefinery infrastructure could enhance production capabilities and help lower costs, making renewable chemicals more competitive against traditional options. Moreover, collaboration among stakeholders, including government agencies, research institutions, and businesses, can drive advancements in technology and market reach, ultimately accelerating the adoption of renewable chemicals.
Government Initiatives in the Georgia Renewable Chemicals Market
Government policies in Georgia are increasingly oriented towards promoting environmental sustainability and the growth of the bioeconomy. Initiatives focusing on renewable energy incentives and bio-based product support serve as crucial catalysts for the renewable chemicals sector. Regulatory agencies are developing standards and guidelines that encourage the utilization of biomass feedstocks, which include agricultural residues and organic waste. These supportive frameworks not only aim to enhance the production of renewable chemicals but also seek to stimulate research and development in green chemistry innovations.
Future Insights of the Georgia Renewable Chemicals Market
Looking towards 2026-2032, the Georgia Renewable Chemicals Market is expected to continue its upward trajectory, driven by both consumer and regulatory pressures for sustainable alternatives. The landscape will likely evolve with significant advancements in production technologies, potentially lowering costs and improving scalability. Additionally, the integration of circular economy principles will reinforce the role of waste materials as valuable resources. As more industries commit to corporate responsibility, the demand for renewable chemicals will strengthen, making Georgia a key player in the sustainable chemical market.
Georgia Renewable Chemicals Market Latest Developments (2025 - 2026)
During the recent period, the Georgia Renewable Chemicals Market has seen a notable shift towards innovative solutions for sustainable chemical production. Various initiatives are being launched to enhance biorefinery technologies and improve feedstock management practices. Additionally, partnerships among industry stakeholders are fostering research into bio-based applications, thereby expanding the market's potential. This momentum reflects the ongoing commitment of businesses and government agencies to drive growth in the renewable chemicals sector.
Georgia Renewable Chemicals Market - Key Attractiveness of the Report
- 10 Years of Market Numbers
- Historical Data Starting from 2022 to 2025
- Base Year: 2025
- Forecast Data until 2032
- Key Performance Indicators Impacting the Market
- Major Upcoming Developments and Projects
Key Highlights of the Report:
- Georgia Renewable Chemicals Market Outlook
- Market Size of Georgia Renewable Chemicals Market, 2025
- Forecast of Georgia Renewable Chemicals Market, 2032F
- Historical Data and Forecast of Georgia Renewable Chemicals Revenues & Volume for the Period 2022-2032F
- Georgia Renewable Chemicals Market Trend Evolution
- Georgia Renewable Chemicals Market Drivers and Challenges
- Georgia Renewable Chemicals Price Trends
- Georgia Renewable Chemicals Porter's Five Forces
- Georgia Renewable Chemicals Industry Life Cycle
- Historical Data and Forecast of Georgia Renewable Chemicals Market Revenues & Volume By Product Type for the Period 2022-2032F
- Historical Data and Forecast of Georgia Renewable Chemicals Market Revenues & Volume By Alcohols for the Period 2022-2032F
- Historical Data and Forecast of Georgia Renewable Chemicals Market Revenues & Volume By Organic Acids for the Period 2022-2032F
- Historical Data and Forecast of Georgia Renewable Chemicals Market Revenues & Volume By Ketones for the Period 2022-2032F
- Historical Data and Forecast of Georgia Renewable Chemicals Market Revenues & Volume By Platform Chemicals for the Period 2022-2032F
- Historical Data and Forecast of Georgia Renewable Chemicals Market Revenues & Volume By Biopolymers for the Period 2022-2032F
- Historical Data and Forecast of Georgia Renewable Chemicals Market Revenues & Volume By Others for the Period 2022-2032F
- Historical Data and Forecast of Georgia Renewable Chemicals Market Revenues & Volume By Applications for the Period 2022-2032F
- Historical Data and Forecast of Georgia Renewable Chemicals Market Revenues & Volume By Transportation for the Period 2022-2032F
- Historical Data and Forecast of Georgia Renewable Chemicals Market Revenues & Volume By Textiles for the Period 2022-2032F
- Historical Data and Forecast of Georgia Renewable Chemicals Market Revenues & Volume By Food safety for the Period 2022-2032F
- Historical Data and Forecast of Georgia Renewable Chemicals Market Revenues & Volume By Environment for the Period 2022-2032F
- Historical Data and Forecast of Georgia Renewable Chemicals Market Revenues & Volume By Communication for the Period 2022-2032F
- Historical Data and Forecast of Georgia Renewable Chemicals Market Revenues & Volume By Housing for the Period 2022-2032F
- Historical Data and Forecast of Georgia Renewable Chemicals Market Revenues & Volume By Recreation for the Period 2022-2032F
- Historical Data and Forecast of Georgia Renewable Chemicals Market Revenues & Volume By Other Applications for the Period 2022-2032F
- Georgia Renewable Chemicals Import Export Trade Statistics
- Market Opportunity Assessment By Product Type
- Market Opportunity Assessment By Applications
- Georgia Renewable Chemicals Top Companies Market Share
- Georgia Renewable Chemicals Competitive Benchmarking By Technical and Operational Parameters
- Georgia Renewable Chemicals Company Profiles
- Georgia Renewable Chemicals Key Strategic Recommendations
Frequently Asked Questions About the Market Study (FAQs):
Key drivers include increasing consumer demand for sustainable products, stringent environmental regulations, and supportive government policies that incentivize the bioeconomy.
The market was estimated at USD 182 Million in 2025 and is projected to reach USD 251 Million by 2032, with a CAGR of 4.7% from 2026 to 2032.
Companies must navigate high production costs, limited availability of feedstocks, and the need for regulatory compliance while ensuring product performance meets market expectations.
Biotechnology is pivotal in driving innovations that enhance production efficiency and lower costs for bio-based chemicals, making them more competitive with petroleum-based alternatives.
Government policies aimed at promoting sustainability and supporting the bioeconomy foster a conducive environment for the growth of renewable chemicals by providing incentives and establishing standards for production.
6Wresearch actively monitors the Georgia Renewable Chemicals Market and publishes its comprehensive annual report, highlighting emerging trends, growth drivers, revenue analysis, and forecast outlook. Our insights help businesses to make data-backed strategic decisions with ongoing market dynamics. Our analysts track relevent industries related to the Georgia Renewable Chemicals Market, allowing our clients with actionable intelligence and reliable forecasts tailored to emerging regional needs.
Yes, we provide customisation as per your requirements. To learn more, feel free to contact us on sales@6wresearch.com
1 Executive Summary |
2 Introduction |
2.1 Key Highlights of the Report |
2.2 Report Description |
2.3 Market Scope & Segmentation |
2.4 Research Methodology |
2.5 Assumptions |
3 Georgia Renewable Chemicals Market Overview |
3.1 Georgia Country Macro Economic Indicators |
3.2 Georgia Renewable Chemicals Market Revenues & Volume, 2022 & 2032F |
3.3 Georgia Renewable Chemicals Market - Industry Life Cycle |
3.4 Georgia Renewable Chemicals Market - Porter's Five Forces |
3.5 Georgia Renewable Chemicals Market Revenues & Volume Share, By Product Type, 2022 & 2032F |
3.6 Georgia Renewable Chemicals Market Revenues & Volume Share, By Applications, 2022 & 2032F |
4 Georgia Renewable Chemicals Market Dynamics |
4.1 Impact Analysis |
4.2 Market Drivers |
4.3 Market Restraints |
5 Georgia Renewable Chemicals Market Trends |
6 Georgia Renewable Chemicals Market, By Types |
6.1 Georgia Renewable Chemicals Market, By Product Type |
6.1.1 Overview and Analysis |
6.1.2 Georgia Renewable Chemicals Market Revenues & Volume, By Product Type, 2022-2032F |
6.1.3 Georgia Renewable Chemicals Market Revenues & Volume, By Alcohols, 2022-2032F |
6.1.4 Georgia Renewable Chemicals Market Revenues & Volume, By Organic Acids, 2022-2032F |
6.1.5 Georgia Renewable Chemicals Market Revenues & Volume, By Ketones, 2022-2032F |
6.1.6 Georgia Renewable Chemicals Market Revenues & Volume, By Platform Chemicals, 2022-2032F |
6.1.7 Georgia Renewable Chemicals Market Revenues & Volume, By Biopolymers, 2022-2032F |
6.1.8 Georgia Renewable Chemicals Market Revenues & Volume, By Others, 2022-2032F |
6.2 Georgia Renewable Chemicals Market, By Applications |
6.2.1 Overview and Analysis |
6.2.2 Georgia Renewable Chemicals Market Revenues & Volume, By Transportation, 2022-2032F |
6.2.3 Georgia Renewable Chemicals Market Revenues & Volume, By Textiles, 2022-2032F |
6.2.4 Georgia Renewable Chemicals Market Revenues & Volume, By Food safety, 2022-2032F |
6.2.5 Georgia Renewable Chemicals Market Revenues & Volume, By Environment, 2022-2032F |
6.2.6 Georgia Renewable Chemicals Market Revenues & Volume, By Communication, 2022-2032F |
6.2.7 Georgia Renewable Chemicals Market Revenues & Volume, By Housing, 2022-2032F |
6.2.8 Georgia Renewable Chemicals Market Revenues & Volume, By Other Applications, 2022-2032F |
6.2.9 Georgia Renewable Chemicals Market Revenues & Volume, By Other Applications, 2022-2032F |
7 Georgia Renewable Chemicals Market Import-Export Trade Statistics |
7.1 Georgia Renewable Chemicals Market Export to Major Countries |
7.2 Georgia Renewable Chemicals Market Imports from Major Countries |
8 Georgia Renewable Chemicals Market Key Performance Indicators |
9 Georgia Renewable Chemicals Market - Opportunity Assessment |
9.1 Georgia Renewable Chemicals Market Opportunity Assessment, By Product Type, 2022 & 2032F |
9.2 Georgia Renewable Chemicals Market Opportunity Assessment, By Applications, 2022 & 2032F |
10 Georgia Renewable Chemicals Market - Competitive Landscape |
10.1 Georgia Renewable Chemicals Market Revenue Share, By Companies, 2025 |
10.2 Georgia Renewable Chemicals Market Competitive Benchmarking, By Operating and Technical Parameters |
11 Company Profiles |
12 Recommendations |
13 Disclaimer |
Global Go To Market Strategy - 2030
Export potential enables firms to identify high-growth global markets with greater confidence by combining advanced trade intelligence with a structured quantitative methodology. The framework analyzes emerging demand trends and country-level import patterns while integrating macroeconomic and trade datasets such as GDP and population forecasts, bilateral import–export flows, tariff structures, elasticity differentials between developed and developing economies, geographic distance, and import demand projections. Using weighted trade values from 2020–2024 as the base period to project country-to-country export potential for 2030, these inputs are operationalized through calculated drivers such as gravity model parameters, tariff impact factors, and projected GDP per-capita growth. Through an analysis of hidden potentials, demand hotspots, and market conditions that are most favorable to success, this method enables firms to focus on target countries, maximize returns, and global expansion with data, backed by accuracy.
By factoring in the projected importer demand gap that is currently unmet and could be potential opportunity, it identifies the potential for the Exporter (Country) among 190 countries, against the general trade analysis, which identifies the biggest importer or exporter.
To discover high-growth global markets and optimize your business strategy:
Click Here
Pricing
- Single User License$ 1,995
- Department License$ 2,400
- Site License$ 3,120
- Global License$ 3,795

Leadership Perspectives from Industry Events
Search
Thought Leadership and Analyst Meet


Our Clients
6WResearch In News
- India Air Conditioner Market Set for Strong Rebound in 2026 After Weather-Led Correction and GST-Driven Recovery: 6Wresearch
- ADAS in India: How Automatic Emergency Braking, Blind Spot Detection & Driver Monitoring are Transforming Road Safety
- Doha a strategic location for EV manufacturing hub: IPA Qatar
- Demand for luxury TVs surging in the GCC, says Samsung
- Empowering Growth: The Thriving Journey of Bangladesh’s Cable Industry
- Demand for luxury TVs surging in the GCC, says Samsung
Latest Reports
- Nicaragua RPG Gaming Market (2026-2032)
- New Zealand RPG Gaming Market (2026-2032)
- Netherlands RPG Gaming Market (2026-2032)
- Nauru RPG Gaming Market (2026-2032)
- Namibia RPG Gaming Market (2026-2032)
- Mozambique RPG Gaming Market (2026-2032)
- Montenegro RPG Gaming Market (2026-2032)
- Mongolia RPG Gaming Market (2026-2032)
- Monaco RPG Gaming Market (2026-2032)
- Micronesia RPG Gaming Market (2026-2032)
Industry Events and Analyst Meet

EV India Expo 2026

HIMTEX 2026

India Refining Summit 2026

India EV Show 2026

EV tech India Expo 2026
Whitepaper
- Middle East & Africa Commercial Security Market Click here to view more.
- Middle East & Africa Fire Safety Systems & Equipment Market Click here to view more.
- GCC Drone Market Click here to view more.
- Middle East Lighting Fixture Market Click here to view more.
- GCC Physical & Perimeter Security Market Click here to view more.