Georgia Sand & Gravel Market (2026-2032) Outlook | Industry, Size, Analysis, Value, Forecast, Revenue, Trends, Share, Companies, Growth
Market Forecast By Product Type (Coarse Crushed Limestone Gravel, Pit Or Coarse Sand, Crushed Clean Stone, Fine Limestone Gravel, River Sand), By End Users (Glass, Road Construction, Mining, Foundry, Others) And Competitive Landscape
| Product Code: ETC304560 | Publication Date: Aug 2022 | Updated Date: Jul 2026 | Product Type: Market Research Report | |
| Publisher: 6Wresearch | Author: Shubham Padhi | No. of Pages: 75 | No. of Figures: 35 | No. of Tables: 20 |
Georgia Sand & Gravel Market Size, Share & Growth Rate
The Georgia Sand & Gravel Market was estimated at USD 455 Million in 2025 and is projected to reach USD 633 Million by 2032, growing at a CAGR of 4.8% from 2026 to 2032. This robust growth trajectory is fueled by a combination of booming urban development, extensive infrastructure projects, and an increasing demand for residential housing as the state's population continues to rise. Moreover, innovations in extraction and processing methods are enhancing the efficiency and sustainability of sand and gravel operations.
Georgia Sand & Gravel Market Year-wise Growth Rate and Key Drivers
This graph highlights how the Georgia Sand & Gravel Market has steadily grown over the years, supported by major growth factors.
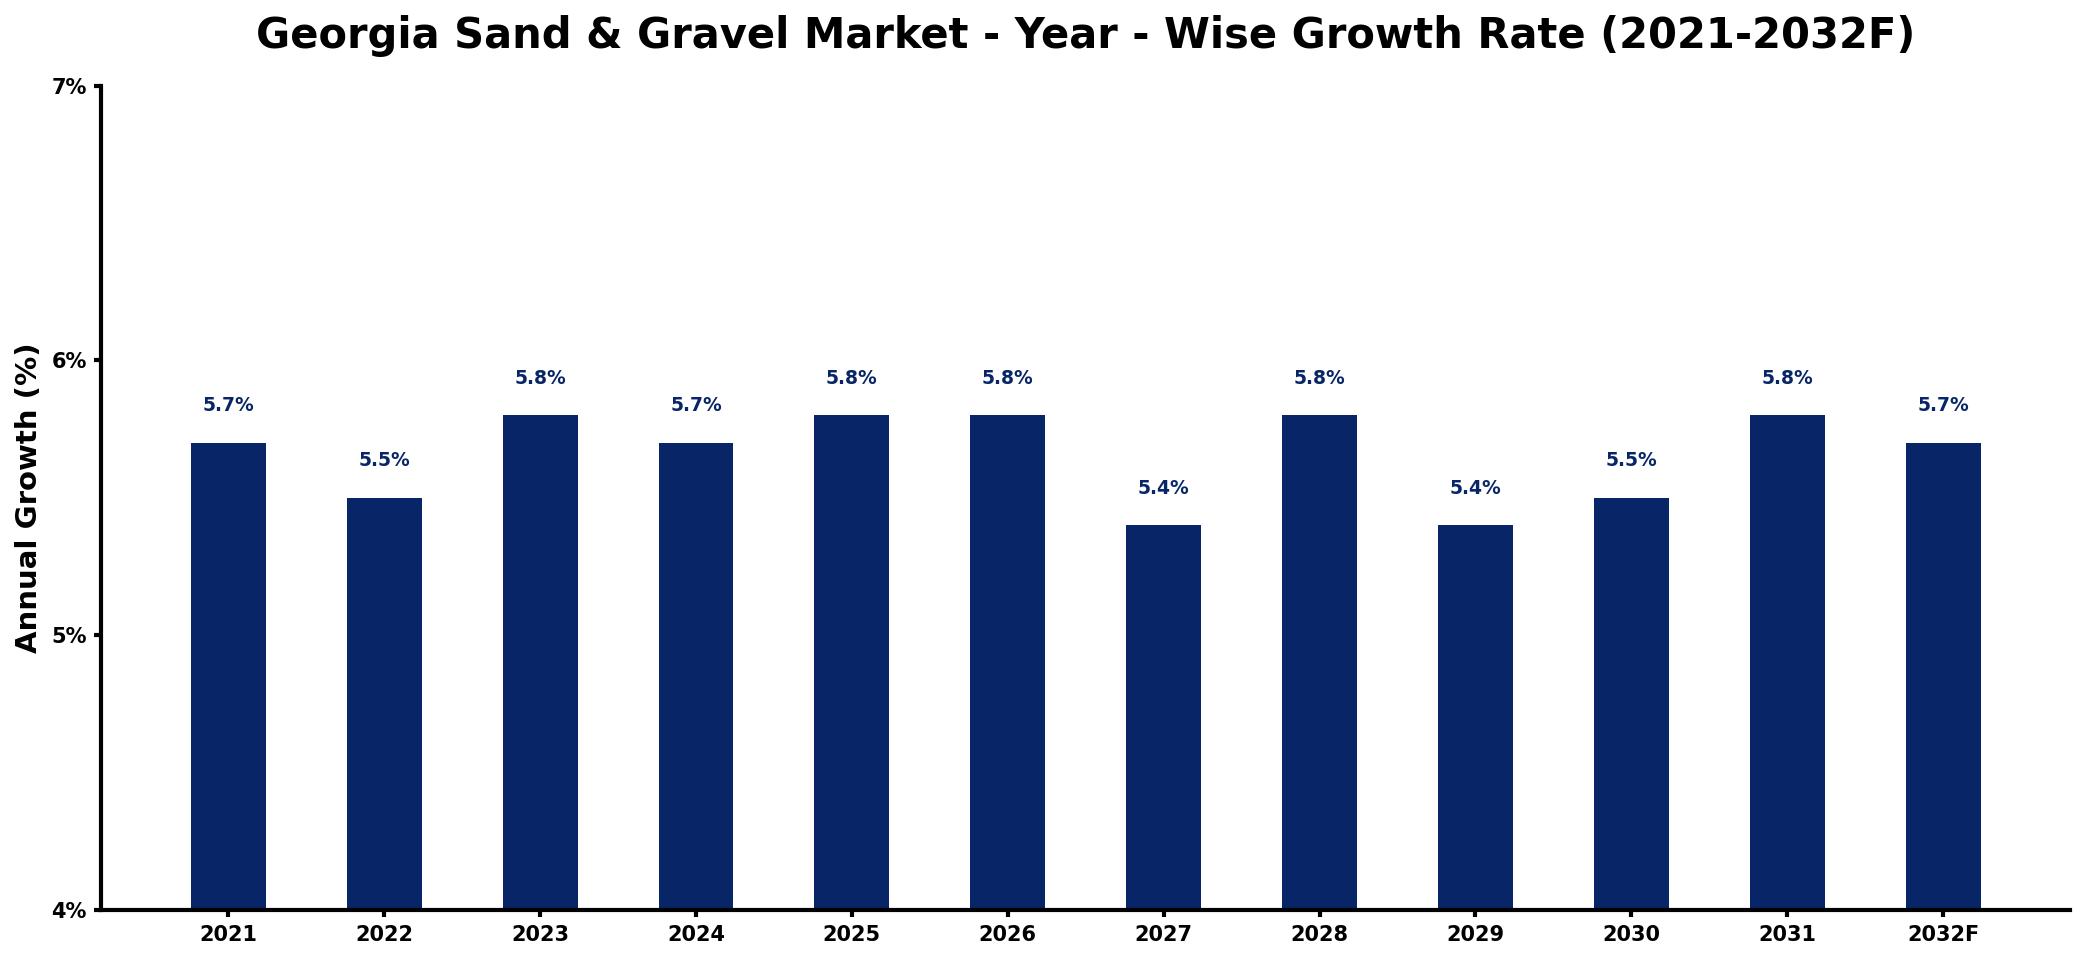
The table below presents the year‑wise growth rates along with the key drivers influencing the market
| Year | Growth Rate | Major Drivers |
| 2021 | 5.7% | Infrastructure projects increase demand significantly |
| 2022 | 5.5% | Residential construction shows strong growth |
| 2023 | 5.8% | Commercial development projects expand rapidly |
| 2024 | 5.7% | Public works initiatives enhance investment |
| 2025 | 5.8% | Transportation sector requires more materials |
| 2026 | 5.8% | Urbanization drives construction activity upward |
| 2027 | 5.4% | growing emerging market penetration |
| 2028 | 5.8% | Industrial expansion fuels material needs |
| 2029 | 5.4% | rising procurement volume requirements |
| 2030 | 5.5% | Heavy machinery investments rise consistently |
| 2031 | 5.8% | Government funding for infrastructure increases |
| 2032 | 5.7% | Sustainable building practices gain traction |
Note: Market size estimations and growth projections presented in this report are based on 6Wresearch's proprietary forecasting methodology, utilizing the latest available industry data, government publications, and primary research inputs.
Georgia Sand & Gravel Market Synopsis
Currently, the Georgia Sand & Gravel Market plays a pivotal role in supporting the state's thriving construction sector. With major cities like Atlanta and Savannah experiencing rapid growth, the demand for quality aggregates is at an all-time high, driven by both commercial and residential construction needs.
Key suppliers in this market are adapting to changing consumer preferences, particularly a rising focus on sustainability. Local sourcing and environmentally-friendly production practices are becoming increasingly vital as stakeholders prioritize green initiatives. As the market evolves, it presents ample opportunities for innovation and investment.
- The market is set for steady growth due to rising construction activities and infrastructure development.
- Sustainability trends are influencing the market towards locally sourced and eco-friendly materials.
- Technological advancements in extraction methods are enhancing operational efficiency.
- Proximity to major transportation routes offers logistical advantages for market players.
- Government regulations are shaping market dynamics, emphasizing environmental compliance and resource management.
Despite its promising growth, the Georgia Sand & Gravel Market is not without its challenges. Increasing competition from alternative materials, such as recycled aggregates, poses a significant threat to traditional sand and gravel suppliers. Additionally, the regulatory landscape can be complex, with stringent permitting processes for extraction operations that can delay project timelines. Fluctuating transportation costs further complicate the market, as logistics play a crucial role in maintaining profitability. Environmental concerns also require companies to invest in sustainable practices, influencing operational strategies and cost structures.
Current trends indicate a marked shift towards sustainable construction practices in Georgia. Builders are increasingly favoring locally sourced materials to reduce their carbon footprint, creating a demand for eco-friendly production methods. Simultaneously, technological innovations are enabling more efficient extraction and processing techniques, thus lowering overall operational costs. The market is also witnessing a heightened emphasis on compliance with environmental regulations, pushing suppliers to adapt their practices accordingly.
There are significant investment opportunities within the Georgia Sand & Gravel Market, especially as the state's ongoing infrastructure projects continue to expand. Investing in mining operations or distribution networks can yield substantial returns, given the consistent demand for aggregates in construction projects. Furthermore, with the increasing emphasis on sustainability, there is a growing opportunity for suppliers to innovate and develop eco-friendly solutions that meet regulatory standards while attracting environmentally conscious customers.
Government policies in Georgia are increasingly focused on balancing economic benefits with environmental protection in the sand and gravel market. Regulations are established to ensure that mining operations are conducted responsibly, with stringent guidelines to prevent soil erosion, water pollution, and habitat destruction. The state actively promotes the use of recycled aggregates and implements zoning laws to designate appropriate mining areas. These policies not only protect the environment but also foster a sustainable resource management framework that supports the industry.
Looking ahead, the Georgia Sand & Gravel Market is poised for steady growth from 2026 to 2032. Continuous investments in infrastructure, utilities, and residential development will likely drive demand for aggregates, maintaining momentum in the sector. Moreover, the ongoing trend towards sustainability and the use of locally sourced materials will further enhance market prospects. However, stakeholders must remain vigilant about regulatory changes and market dynamics to effectively navigate potential challenges and capitalize on emerging opportunities.
In recent months, the Georgia Sand & Gravel Market has seen a focus on enhancing sustainability practices within extraction and production processes. Many operators are adopting innovative technologies aimed at reducing environmental impacts, which aligns with the state's regulatory framework. Additionally, local partnerships are being formed to improve the logistics of supply chains, making it easier for construction firms to source materials efficiently. The industry is closely monitoring public policies that may influence market conditions and operations.
- 10 Years of Market Numbers
- Historical Data Starting from 2022 to 2025
- Base Year: 2025
- Forecast Data until 2032
- Key Performance Indicators Impacting the Market
- Major Upcoming Developments and Projects
Key Highlights of the Report:
- Georgia Sand & Gravel Market Outlook
- Market Size of Georgia Sand & Gravel Market, 2025
- Forecast of Georgia Sand & Gravel Market, 2032
- Historical Data and Forecast of Georgia Sand & Gravel Revenues & Volume for the Period 2022-2032F
- Georgia Sand & Gravel Market Trend Evolution
- Georgia Sand & Gravel Market Drivers and Challenges
- Georgia Sand & Gravel Price Trends
- Georgia Sand & Gravel Porter's Five Forces
- Georgia Sand & Gravel Industry Life Cycle
- Historical Data and Forecast of Georgia Sand & Gravel Market Revenues & Volume By Product Type for the Period 2022-2032F
- Historical Data and Forecast of Georgia Sand & Gravel Market Revenues & Volume By Coarse Crushed Limestone Gravel for the Period 2022-2032F
- Historical Data and Forecast of Georgia Sand & Gravel Market Revenues & Volume By Pit Or Coarse Sand for the Period 2022-2032F
- Historical Data and Forecast of Georgia Sand & Gravel Market Revenues & Volume By Crushed Clean Stone for the Period 2022-2032F
- Historical Data and Forecast of Georgia Sand & Gravel Market Revenues & Volume By Fine Limestone Gravel for the Period 2022-2032F
- Historical Data and Forecast of Georgia Sand & Gravel Market Revenues & Volume By River Sand for the Period 2022-2032F
- Historical Data and Forecast of Georgia Sand & Gravel Market Revenues & Volume By End Users for the Period 2022-2032F
- Historical Data and Forecast of Georgia Sand & Gravel Market Revenues & Volume By Glass for the Period 2022-2032F
- Historical Data and Forecast of Georgia Sand & Gravel Market Revenues & Volume By Road Construction for the Period 2022-2032F
- Historical Data and Forecast of Georgia Sand & Gravel Market Revenues & Volume By Mining for the Period 2022-2032F
- Historical Data and Forecast of Georgia Sand & Gravel Market Revenues & Volume By Foundry for the Period 2022-2032F
- Historical Data and Forecast of Georgia Sand & Gravel Market Revenues & Volume By Others for the Period 2022-2032F
- Georgia Sand & Gravel Import Export Trade Statistics
- Market Opportunity Assessment By Product Type
- Market Opportunity Assessment By End Users
- Georgia Sand & Gravel Top Companies Market Share
- Georgia Sand & Gravel Competitive Benchmarking By Technical and Operational Parameters
- Georgia Sand & Gravel Company Profiles
- Georgia Sand & Gravel Key Strategic Recommendations
Frequently Asked Questions About the Market Study (FAQs):
The growth is primarily driven by increased infrastructure investments and a booming residential construction sector in urban areas like Atlanta and Savannah.
The Georgia Sand & Gravel Market was estimated at USD 455 Million in 2025 and is projected to reach USD 633 Million by 2032, growing at a CAGR of 4.8% from 2026 to 2032.
Yes, sustainability and environmentally-friendly practices are gaining traction, pushing suppliers to innovate and adapt their offerings.
Operators must navigate complex regulatory landscapes, competition from alternative materials, and rising transportation costs, which can impact profitability.
There are lucrative opportunities in mining and distribution as the demand for aggregates in construction remains steady, with particular focus on sustainable practices.
Government initiatives are increasingly emphasizing environmental compliance and sustainable resource management, affecting operational practices and market dynamics.
6Wresearch actively monitors the Georgia Sand & Gravel Market and publishes its comprehensive annual report, highlighting emerging trends, growth drivers, revenue analysis, and forecast outlook. Our insights help businesses to make data-backed strategic decisions with ongoing market dynamics. Our analysts track relevent industries related to the Georgia Sand & Gravel Market, allowing our clients with actionable intelligence and reliable forecasts tailored to emerging regional needs.
Yes, we provide customisation as per your requirements. To learn more, feel free to contact us on sales@6wresearch.com
1 Executive Summary |
2 Introduction |
2.1 Key Highlights of the Report |
2.2 Report Description |
2.3 Market Scope & Segmentation |
2.4 Research Methodology |
2.5 Assumptions |
3 Georgia Sand & Gravel Market Overview |
3.1 Georgia Country Macro Economic Indicators |
3.2 Georgia Sand & Gravel Market Revenues & Volume, 2022 & 2032F |
3.3 Georgia Sand & Gravel Market - Industry Life Cycle |
3.4 Georgia Sand & Gravel Market - Porter's Five Forces |
3.5 Georgia Sand & Gravel Market Revenues & Volume Share, By Product Type, 2022 & 2032F |
3.6 Georgia Sand & Gravel Market Revenues & Volume Share, By End Users, 2022 & 2032F |
4 Georgia Sand & Gravel Market Dynamics |
4.1 Impact Analysis |
4.2 Market Drivers |
4.2.1 Increased construction activities in Georgia |
4.2.2 Growing demand for sand and gravel in infrastructure projects |
4.2.3 Favorable government regulations supporting the mining industry |
4.3 Market Restraints |
4.3.1 Environmental concerns related to sand and gravel extraction |
4.3.2 Fluctuating raw material prices impacting production costs |
5 Georgia Sand & Gravel Market Trends |
6 Georgia Sand & Gravel Market, By Types |
6.1 Georgia Sand & Gravel Market, By Product Type |
6.1.1 Overview and Analysis |
6.1.2 Georgia Sand & Gravel Market Revenues & Volume, By Product Type, 2022-2032F |
6.1.3 Georgia Sand & Gravel Market Revenues & Volume, By Coarse Crushed Limestone Gravel, 2022-2032F |
6.1.4 Georgia Sand & Gravel Market Revenues & Volume, By Pit Or Coarse Sand, 2022-2032F |
6.1.5 Georgia Sand & Gravel Market Revenues & Volume, By Crushed Clean Stone, 2022-2032F |
6.1.6 Georgia Sand & Gravel Market Revenues & Volume, By Fine Limestone Gravel, 2022-2032F |
6.1.7 Georgia Sand & Gravel Market Revenues & Volume, By River Sand, 2022-2032F |
6.2 Georgia Sand & Gravel Market, By End Users |
6.2.1 Overview and Analysis |
6.2.2 Georgia Sand & Gravel Market Revenues & Volume, By Glass, 2022-2032F |
6.2.3 Georgia Sand & Gravel Market Revenues & Volume, By Road Construction, 2022-2032F |
6.2.4 Georgia Sand & Gravel Market Revenues & Volume, By Mining, 2022-2032F |
6.2.5 Georgia Sand & Gravel Market Revenues & Volume, By Foundry, 2022-2032F |
6.2.6 Georgia Sand & Gravel Market Revenues & Volume, By Others, 2022-2032F |
7 Georgia Sand & Gravel Market Import-Export Trade Statistics |
7.1 Georgia Sand & Gravel Market Export to Major Countries |
7.2 Georgia Sand & Gravel Market Imports from Major Countries |
8 Georgia Sand & Gravel Market Key Performance Indicators |
8.1 Average selling price of sand and gravel |
8.2 Volume of sand and gravel used in construction projects |
8.3 Number of new infrastructure projects in Georgia that require sand and gravel |
9 Georgia Sand & Gravel Market - Opportunity Assessment |
9.1 Georgia Sand & Gravel Market Opportunity Assessment, By Product Type, 2022 & 2032F |
9.2 Georgia Sand & Gravel Market Opportunity Assessment, By End Users, 2022 & 2032F |
10 Georgia Sand & Gravel Market - Competitive Landscape |
10.1 Georgia Sand & Gravel Market Revenue Share, By Companies, 2025 |
10.2 Georgia Sand & Gravel Market Competitive Benchmarking, By Operating and Technical Parameters |
11 Company Profiles |
12 Recommendations |
13 Disclaimer |
Global Go To Market Strategy - 2030
Export potential enables firms to identify high-growth global markets with greater confidence by combining advanced trade intelligence with a structured quantitative methodology. The framework analyzes emerging demand trends and country-level import patterns while integrating macroeconomic and trade datasets such as GDP and population forecasts, bilateral import–export flows, tariff structures, elasticity differentials between developed and developing economies, geographic distance, and import demand projections. Using weighted trade values from 2020–2024 as the base period to project country-to-country export potential for 2030, these inputs are operationalized through calculated drivers such as gravity model parameters, tariff impact factors, and projected GDP per-capita growth. Through an analysis of hidden potentials, demand hotspots, and market conditions that are most favorable to success, this method enables firms to focus on target countries, maximize returns, and global expansion with data, backed by accuracy.
By factoring in the projected importer demand gap that is currently unmet and could be potential opportunity, it identifies the potential for the Exporter (Country) among 190 countries, against the general trade analysis, which identifies the biggest importer or exporter.
To discover high-growth global markets and optimize your business strategy:
Click Here
Pricing
- Single User License$ 1,995
- Department License$ 2,400
- Site License$ 3,120
- Global License$ 3,795

Leadership Perspectives from Industry Events
Search
Thought Leadership and Analyst Meet


Our Clients
6WResearch In News
- India Air Conditioner Market Set for Strong Rebound in 2026 After Weather-Led Correction and GST-Driven Recovery: 6Wresearch
- ADAS in India: How Automatic Emergency Braking, Blind Spot Detection & Driver Monitoring are Transforming Road Safety
- Doha a strategic location for EV manufacturing hub: IPA Qatar
- Demand for luxury TVs surging in the GCC, says Samsung
- Empowering Growth: The Thriving Journey of Bangladesh’s Cable Industry
- Demand for luxury TVs surging in the GCC, says Samsung
Latest Reports
- Nicaragua RPG Gaming Market (2026-2032)
- New Zealand RPG Gaming Market (2026-2032)
- Netherlands RPG Gaming Market (2026-2032)
- Nauru RPG Gaming Market (2026-2032)
- Namibia RPG Gaming Market (2026-2032)
- Mozambique RPG Gaming Market (2026-2032)
- Montenegro RPG Gaming Market (2026-2032)
- Mongolia RPG Gaming Market (2026-2032)
- Monaco RPG Gaming Market (2026-2032)
- Micronesia RPG Gaming Market (2026-2032)
Industry Events and Analyst Meet

EV India Expo 2026

HIMTEX 2026

India Refining Summit 2026

India EV Show 2026

EV tech India Expo 2026
Whitepaper
- Middle East & Africa Commercial Security Market Click here to view more.
- Middle East & Africa Fire Safety Systems & Equipment Market Click here to view more.
- GCC Drone Market Click here to view more.
- Middle East Lighting Fixture Market Click here to view more.
- GCC Physical & Perimeter Security Market Click here to view more.