Georgia Sports Composites Market (2026-2032) Outlook | Industry, Size, Share, Revenue, Trends, Value, Forecast, Companies, Growth & Analysis
Market Forecast By Resin (Epoxy Resin-based Sports Composites, Polyamide Resin-based Sports Composites, Polyurethane Resin-based Sports Composites, Polypropylene Resin-based Sports Composites), By Fiber (Carbon Fiber Sports Composites, Glass Fiber Sports Composites), By Application (Sports Composites for Golf Sticks, Sports Composites for Rackets, Sports Composites for Bicycle Frames, Sports Composites for Hockey Sticks, Sports Composites for Skis, Snowboards, and Kayaks) And Competitive Landscape
| Product Code: ETC232740 | Publication Date: Aug 2022 | Updated Date: Jul 2026 | Product Type: Market Research Report | |
| Publisher: 6Wresearch | Author: Ravi Bhandari | No. of Pages: 75 | No. of Figures: 35 | No. of Tables: 20 |
Georgia Sports Composites Market Size, Share & Growth Rate
The Georgia Sports Composites Market was estimated at USD 154 Million in 2025 and is projected to reach USD 213 Million by 2032, growing at a CAGR of 4.7% from 2026 to 2032. This growth trajectory is fueled by the increasing demand for lightweight and high-performance sporting equipment, which directly impacts athletic performance. As more athletes and enthusiasts seek advanced materials like carbon fiber and fiberglass for their sports gear, the market is experiencing robust expansion. Additionally, innovations in composite technologies and heightened participation in various sports activities further bolster this upward trend.
Georgia Sports Composites Market Year-wise Growth Rate and Key Drivers
This graph highlights how the Georgia Sports Composites Market has steadily grown over the years, supported by major growth factors.
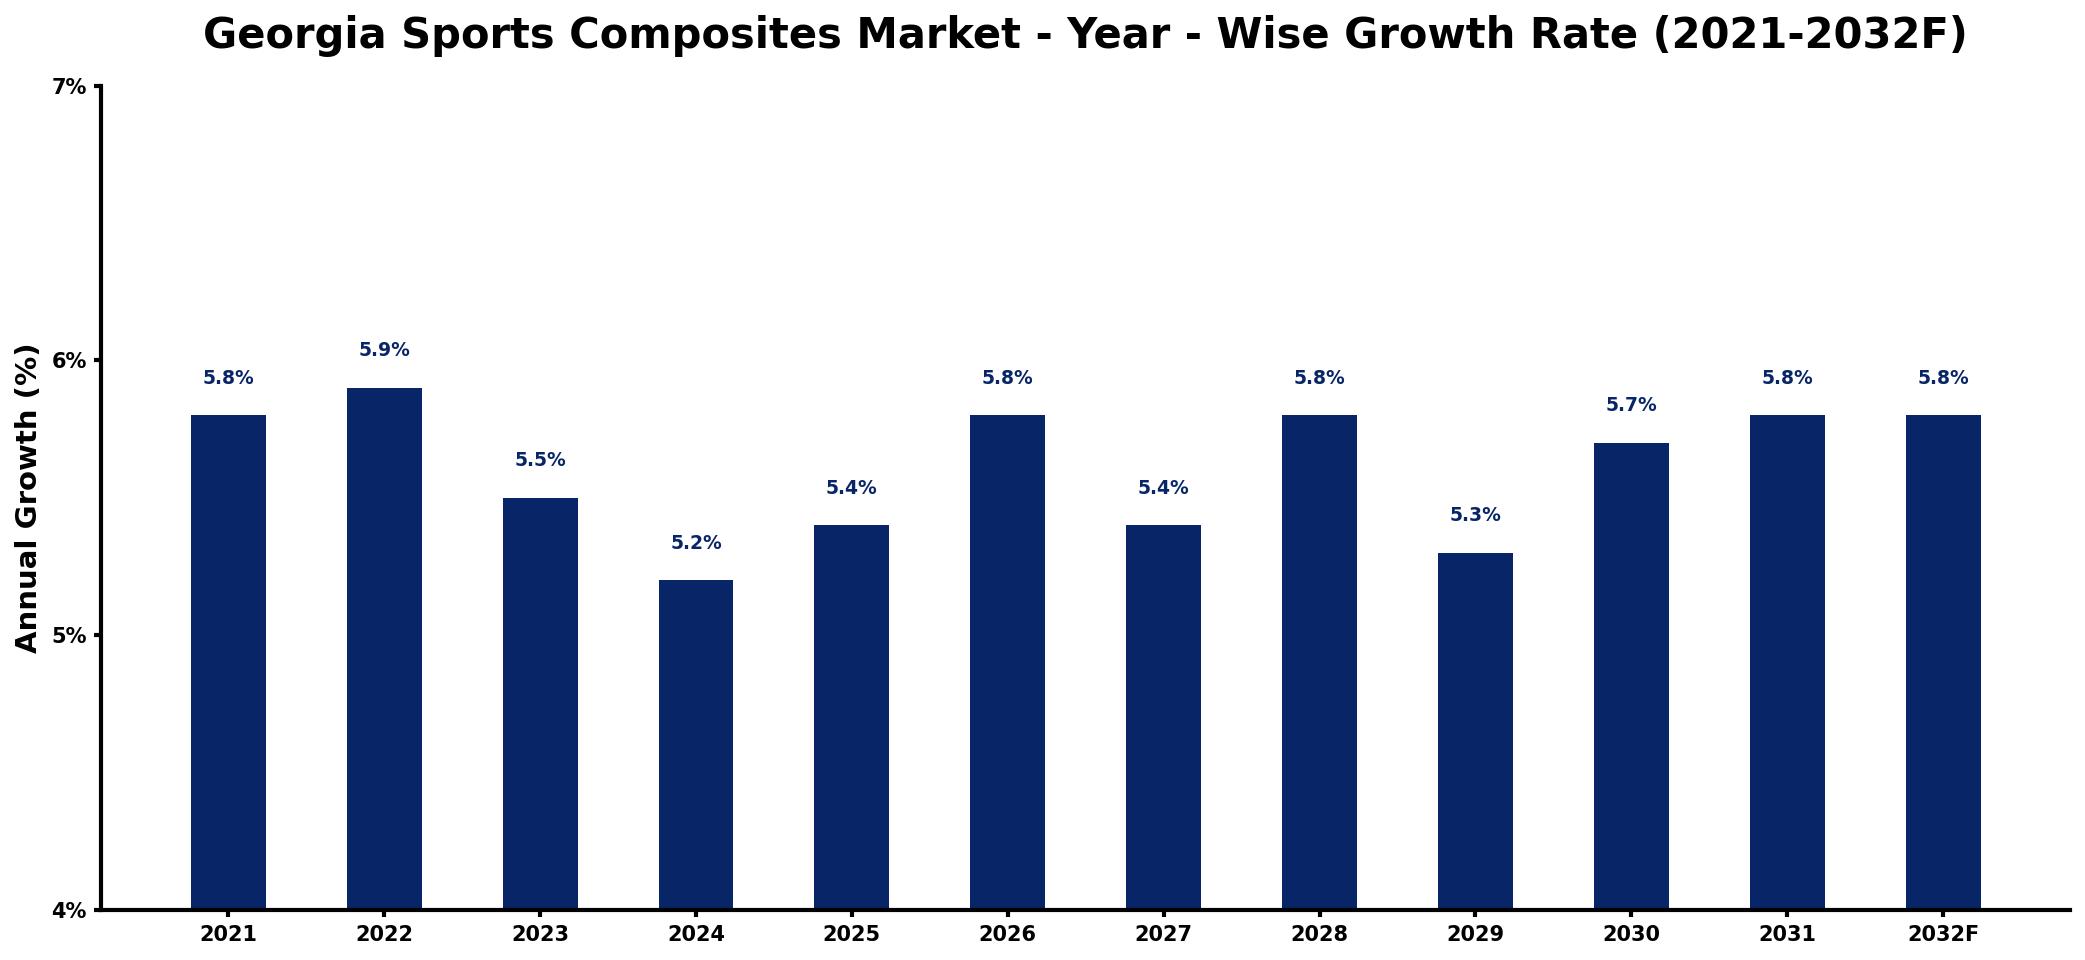
The table below presents the year‑wise growth rates along with the key drivers influencing the market
| Year | Growth Rate | Major Drivers |
| 2021 | 5.8% | Rising interest in eco-friendly materials |
| 2022 | 5.9% | Increased investment in manufacturing technologies |
| 2023 | 5.5% | Growing demand for lightweight solutions |
| 2024 | 5.2% | Expansion of recreational activities market |
| 2025 | 5.4% | Advancements in material science innovations |
| 2026 | 5.8% | Emergence of new athletic applications |
| 2027 | 5.4% | Strengthening partnerships with manufacturers |
| 2028 | 5.8% | Surge in outdoor recreational activities |
| 2029 | 5.3% | Development of new market segments |
| 2030 | 5.7% | Increased focus on sustainability initiatives |
| 2031 | 5.8% | Growing consumer awareness of performance |
| 2032 | 5.8% | growing regional consumption patterns |
Note: Market size estimations and growth projections presented in this report are based on 6Wresearch's proprietary forecasting methodology, utilizing the latest available industry data, government publications, and primary research inputs.
Georgia Sports Composites Market Synopsis
Currently, the strongest force shaping the Georgia Sports Composites Market is the growing trend towards high-performance sporting goods. Athletes and manufacturers are increasingly prioritizing lightweight materials that do not compromise on durability or strength, leading to a surge in the adoption of composite materials across various sports sectors.
Moreover, advancements in technology are enabling manufacturers to innovate and customize products. This drive for customization is fostering a competitive landscape that not only enhances athlete performance but also enriches consumer experiences, establishing a dynamic environment for growth.
Georgia Sports Composites Market Key Takeaways
- The market is witnessing a shift towards carbon fiber composites, which are favored for their superior strength-to-weight ratio.
- Customization of sporting goods is becoming a key differentiator among manufacturers, attracting more consumers.
- Technological advancements are facilitating innovative designs that enhance the performance of sporting equipment.
- Government initiatives aimed at promoting sports infrastructure are positively influencing market dynamics.
- Participation in sports activities continues to rise, driving the demand for high-performance sports composites.
Evaluation of Restraints in Georgia Sports Composites Market
Despite its growth potential, the Georgia Sports Composites Market faces several restraints that could impede its expansion. High material costs pose a significant barrier, as the production of advanced composites like carbon fiber can be resource-intensive. Furthermore, the need for continuous performance optimization presents challenges for manufacturers who strive to meet evolving consumer expectations. Regulatory compliance surrounding safety standards and material certifications adds additional complexity, requiring businesses to invest in rigorous testing and quality assurance processes.
Georgia Sports Composites Market Trends
Among the current trends, the rise in eco-conscious consumer behavior is noteworthy. Manufacturers are exploring sustainable composite materials that appeal to environmentally aware athletes. Additionally, the integration of smart technology into sporting equipment is emerging, offering advanced features that enhance user experience. As the market evolves, these trends are expected to reshape how sports composites are developed and marketed.
Georgia Sports Composites Market Opportunities
Significant growth opportunities lie in the increasing demand for customized sporting equipment tailored to individual athlete needs. This trend opens avenues for manufacturers to engage in collaborative design processes with athletes and coaches, fostering innovation. Furthermore, as the state continues to promote sports tourism, investment in high-quality sporting goods will likely rise, expanding the market landscape.
Government Initiatives in the Georgia Sports Composites Market
Government policies aimed at supporting the sports industry play a vital role in the development of the Georgia Sports Composites Market. Initiatives that facilitate research and innovation in composite materials, alongside funding for sports infrastructure, are pivotal. Additionally, state-backed programs promoting athletic training and sports events are likely to spur demand for advanced sporting equipment, driving market growth.
Future Insights of the Georgia Sports Composites Market
Looking ahead to 2026-2032, the Georgia Sports Composites Market is expected to continue its upward trajectory, supported by ongoing innovations in materials technology and increasing athlete engagement. The push for sustainability will likely accelerate the development of eco-friendly composites, catering to a market that values both performance and environmental responsibility. As competition intensifies, manufacturers that prioritize adaptability and customer-centric design will be best positioned to succeed.
Georgia Sports Composites Market Latest Developments (2025 - 2026)
Recent developments within the Georgia Sports Composites Market indicate a growing emphasis on collaboration between material suppliers and manufacturers. This trend is reflected in the establishment of partnerships aimed at accelerating product innovation and enhancing performance capabilities. Additionally, several local firms have begun to integrate smart technology into their composite designs, indicating a shift towards advanced functionalities in sporting equipment.
Georgia Sports Composites Market - Key Attractiveness of the Report
- 10 Years of Market Numbers
- Historical Data Starting from 2022 to 2025
- Base Year: 2025
- Forecast Data until 2032
- Key Performance Indicators Impacting the Market
- Major Upcoming Developments and Projects
Key Highlights of the Report:
- Georgia Sports Composites Market Outlook
- Market Size of Georgia Sports Composites Market, 2025
- Forecast of Georgia Sports Composites Market, 2032F
- Historical Data and Forecast of Georgia Sports Composites Revenues & Volume for the Period 2022-2032F
- Georgia Sports Composites Market Trend Evolution
- Georgia Sports Composites Market Drivers and Challenges
- Georgia Sports Composites Price Trends
- Georgia Sports Composites Porter's Five Forces
- Georgia Sports Composites Industry Life Cycle
- Historical Data and Forecast of Georgia Sports Composites Market Revenues & Volume By Resin for the Period 2022-2032F
- Historical Data and Forecast of Georgia Sports Composites Market Revenues & Volume By Epoxy Resin-based Sports Composites for the Period 2022-2032F
- Historical Data and Forecast of Georgia Sports Composites Market Revenues & Volume By Polyamide Resin-based Sports Composites for the Period 2022-2032F
- Historical Data and Forecast of Georgia Sports Composites Market Revenues & Volume By Polyurethane Resin-based Sports Composites for the Period 2022-2032F
- Historical Data and Forecast of Georgia Sports Composites Market Revenues & Volume By Polypropylene Resin-based Sports Composites for the Period 2022-2032F
- Historical Data and Forecast of Georgia Sports Composites Market Revenues & Volume By Fiber for the Period 2022-2032F
- Historical Data and Forecast of Georgia Sports Composites Market Revenues & Volume By Carbon Fiber Sports Composites for the Period 2022-2032F
- Historical Data and Forecast of Georgia Sports Composites Market Revenues & Volume By Glass Fiber Sports Composites for the Period 2022-2032F
- Historical Data and Forecast of Georgia Sports Composites Market Revenues & Volume By Application for the Period 2022-2032F
- Historical Data and Forecast of Georgia Sports Composites Market Revenues & Volume By Sports Composites for Golf Sticks for the Period 2022-2032F
- Historical Data and Forecast of Georgia Sports Composites Market Revenues & Volume By Sports Composites for Rackets for the Period 2022-2032F
- Historical Data and Forecast of Georgia Sports Composites Market Revenues & Volume By Sports Composites for Bicycle Frames for the Period 2022-2032F
- Historical Data and Forecast of Georgia Sports Composites Market Revenues & Volume By Sports Composites for Hockey Sticks for the Period 2022-2032F
- Historical Data and Forecast of Georgia Sports Composites Market Revenues & Volume By Sports Composites for Skis, Snowboards, and Kayaks for the Period 2022-2032F
- Georgia Sports Composites Import Export Trade Statistics
- Market Opportunity Assessment By Resin
- Market Opportunity Assessment By Fiber
- Market Opportunity Assessment By Application
- Georgia Sports Composites Top Companies Market Share
- Georgia Sports Composites Competitive Benchmarking By Technical and Operational Parameters
- Georgia Sports Composites Company Profiles
- Georgia Sports Composites Key Strategic Recommendations
Frequently Asked Questions About the Market Study (FAQs):
The Georgia Sports Composites Market was estimated at USD 154 Million in 2025 and is projected to reach USD 213 Million by 2032, growing at a CAGR of 4.7% from 2026 to 2032.
The main drivers include a surge in demand for high-performance sporting goods and advancements in composite materials technology. Moreover, the increasing participation in various sports activities has created a substantial market for composite materials.
Composite materials are predominantly used in bicycles, golf clubs, and tennis rackets, among other sporting goods, because they provide a unique combination of lightweight properties, strength, and agility.
Yes, government regulations concerning material standards and athlete safety are influencing the market. Compliance with these regulations is crucial for manufacturers in ensuring their products meet safety and performance expectations.
Customization is rapidly becoming a key differentiator in the market, with consumers seeking products tailored to their specific athletic needs. This trend encourages innovation and fosters stronger connections between manufacturers and athletes.
6Wresearch actively monitors the Georgia Sports Composites Market and publishes its comprehensive annual report, highlighting emerging trends, growth drivers, revenue analysis, and forecast outlook. Our insights help businesses to make data-backed strategic decisions with ongoing market dynamics. Our analysts track relevent industries related to the Georgia Sports Composites Market, allowing our clients with actionable intelligence and reliable forecasts tailored to emerging regional needs.
Yes, we provide customisation as per your requirements. To learn more, feel free to contact us on sales@6wresearch.com
1 Executive Summary |
2 Introduction |
2.1 Key Highlights of the Report |
2.2 Report Description |
2.3 Market Scope & Segmentation |
2.4 Research Methodology |
2.5 Assumptions |
3 Georgia Sports Composites Market Overview |
3.1 Georgia Country Macro Economic Indicators |
3.2 Georgia Sports Composites Market Revenues & Volume, 2022 & 2032F |
3.3 Georgia Sports Composites Market - Industry Life Cycle |
3.4 Georgia Sports Composites Market - Porter's Five Forces |
3.5 Georgia Sports Composites Market Revenues & Volume Share, By Resin, 2022 & 2032F |
3.6 Georgia Sports Composites Market Revenues & Volume Share, By Fiber, 2022 & 2032F |
3.7 Georgia Sports Composites Market Revenues & Volume Share, By Application, 2022 & 2032F |
4 Georgia Sports Composites Market Dynamics |
4.1 Impact Analysis |
4.2 Market Drivers |
4.3 Market Restraints |
5 Georgia Sports Composites Market Trends |
6 Georgia Sports Composites Market, By Types |
6.1 Georgia Sports Composites Market, By Resin |
6.1.1 Overview and Analysis |
6.1.2 Georgia Sports Composites Market Revenues & Volume, By Resin, 2022-2032F |
6.1.3 Georgia Sports Composites Market Revenues & Volume, By Epoxy Resin-based Sports Composites, 2022-2032F |
6.1.4 Georgia Sports Composites Market Revenues & Volume, By Polyamide Resin-based Sports Composites, 2022-2032F |
6.1.5 Georgia Sports Composites Market Revenues & Volume, By Polyurethane Resin-based Sports Composites, 2022-2032F |
6.1.6 Georgia Sports Composites Market Revenues & Volume, By Polypropylene Resin-based Sports Composites, 2022-2032F |
6.2 Georgia Sports Composites Market, By Fiber |
6.2.1 Overview and Analysis |
6.2.2 Georgia Sports Composites Market Revenues & Volume, By Carbon Fiber Sports Composites, 2022-2032F |
6.2.3 Georgia Sports Composites Market Revenues & Volume, By Glass Fiber Sports Composites, 2022-2032F |
6.3 Georgia Sports Composites Market, By Application |
6.3.1 Overview and Analysis |
6.3.2 Georgia Sports Composites Market Revenues & Volume, By Sports Composites for Golf Sticks, 2022-2032F |
6.3.3 Georgia Sports Composites Market Revenues & Volume, By Sports Composites for Rackets, 2022-2032F |
6.3.4 Georgia Sports Composites Market Revenues & Volume, By Sports Composites for Bicycle Frames, 2022-2032F |
6.3.5 Georgia Sports Composites Market Revenues & Volume, By Sports Composites for Hockey Sticks, 2022-2032F |
6.3.6 Georgia Sports Composites Market Revenues & Volume, By Sports Composites for Skis, Snowboards, and Kayaks, 2022-2032F |
7 Georgia Sports Composites Market Import-Export Trade Statistics |
7.1 Georgia Sports Composites Market Export to Major Countries |
7.2 Georgia Sports Composites Market Imports from Major Countries |
8 Georgia Sports Composites Market Key Performance Indicators |
9 Georgia Sports Composites Market - Opportunity Assessment |
9.1 Georgia Sports Composites Market Opportunity Assessment, By Resin, 2022 & 2032F |
9.2 Georgia Sports Composites Market Opportunity Assessment, By Fiber, 2022 & 2032F |
9.3 Georgia Sports Composites Market Opportunity Assessment, By Application, 2022 & 2032F |
10 Georgia Sports Composites Market - Competitive Landscape |
10.1 Georgia Sports Composites Market Revenue Share, By Companies, 2025 |
10.2 Georgia Sports Composites Market Competitive Benchmarking, By Operating and Technical Parameters |
11 Company Profiles |
12 Recommendations |
13 Disclaimer |
Global Go To Market Strategy - 2030
Export potential enables firms to identify high-growth global markets with greater confidence by combining advanced trade intelligence with a structured quantitative methodology. The framework analyzes emerging demand trends and country-level import patterns while integrating macroeconomic and trade datasets such as GDP and population forecasts, bilateral import–export flows, tariff structures, elasticity differentials between developed and developing economies, geographic distance, and import demand projections. Using weighted trade values from 2020–2024 as the base period to project country-to-country export potential for 2030, these inputs are operationalized through calculated drivers such as gravity model parameters, tariff impact factors, and projected GDP per-capita growth. Through an analysis of hidden potentials, demand hotspots, and market conditions that are most favorable to success, this method enables firms to focus on target countries, maximize returns, and global expansion with data, backed by accuracy.
By factoring in the projected importer demand gap that is currently unmet and could be potential opportunity, it identifies the potential for the Exporter (Country) among 190 countries, against the general trade analysis, which identifies the biggest importer or exporter.
To discover high-growth global markets and optimize your business strategy:
Click Here
Pricing
- Single User License$ 1,995
- Department License$ 2,400
- Site License$ 3,120
- Global License$ 3,795

Leadership Perspectives from Industry Events
Search
Thought Leadership and Analyst Meet


Our Clients
6WResearch In News
- India Air Conditioner Market Set for Strong Rebound in 2026 After Weather-Led Correction and GST-Driven Recovery: 6Wresearch
- ADAS in India: How Automatic Emergency Braking, Blind Spot Detection & Driver Monitoring are Transforming Road Safety
- Doha a strategic location for EV manufacturing hub: IPA Qatar
- Demand for luxury TVs surging in the GCC, says Samsung
- Empowering Growth: The Thriving Journey of Bangladesh’s Cable Industry
- Demand for luxury TVs surging in the GCC, says Samsung
Latest Reports
- Nicaragua RPG Gaming Market (2026-2032)
- New Zealand RPG Gaming Market (2026-2032)
- Netherlands RPG Gaming Market (2026-2032)
- Nauru RPG Gaming Market (2026-2032)
- Namibia RPG Gaming Market (2026-2032)
- Mozambique RPG Gaming Market (2026-2032)
- Montenegro RPG Gaming Market (2026-2032)
- Mongolia RPG Gaming Market (2026-2032)
- Monaco RPG Gaming Market (2026-2032)
- Micronesia RPG Gaming Market (2026-2032)
Industry Events and Analyst Meet

EV India Expo 2026

HIMTEX 2026

India Refining Summit 2026

India EV Show 2026

EV tech India Expo 2026
Whitepaper
- Middle East & Africa Commercial Security Market Click here to view more.
- Middle East & Africa Fire Safety Systems & Equipment Market Click here to view more.
- GCC Drone Market Click here to view more.
- Middle East Lighting Fixture Market Click here to view more.
- GCC Physical & Perimeter Security Market Click here to view more.