Georgia Urea Market (2026-2032) Outlook | Growth, Companies, Share, Value, Industry, Size, Forecast, Analysis, Revenue & Trends
Market Forecast By Grade (Fertilizer, Feed, Technical), By End-user Industry (Agriculture, Chemical, Automotive, Medical, Others) And Competitive Landscape
| Product Code: ETC211032 | Publication Date: May 2022 | Updated Date: Jul 2026 | Product Type: Market Research Report | |
| Publisher: 6Wresearch | Author: Ravi Bhandari | No. of Pages: 60 | No. of Figures: 40 | No. of Tables: 7 |
Georgia Urea Market Size, Share & Growth Rate
The Georgia Urea Market was estimated at USD 699 Million in 2025 and is projected to reach USD 992 Million by 2032, growing at a CAGR of 5.1% from 2026 to 2032. This robust growth trajectory is primarily driven by the increasing demand for agricultural productivity, spurred by population growth and the subsequent need for food security. Moreover, the rising adoption of advanced agricultural techniques and the constant evolution of fertilizer technologies further bolster the market's expansion in Georgia.
Georgia Urea Market Year-wise Growth Rate and Key Drivers
This graph highlights how the Georgia Urea Market has steadily grown over the years, supported by major growth factors.
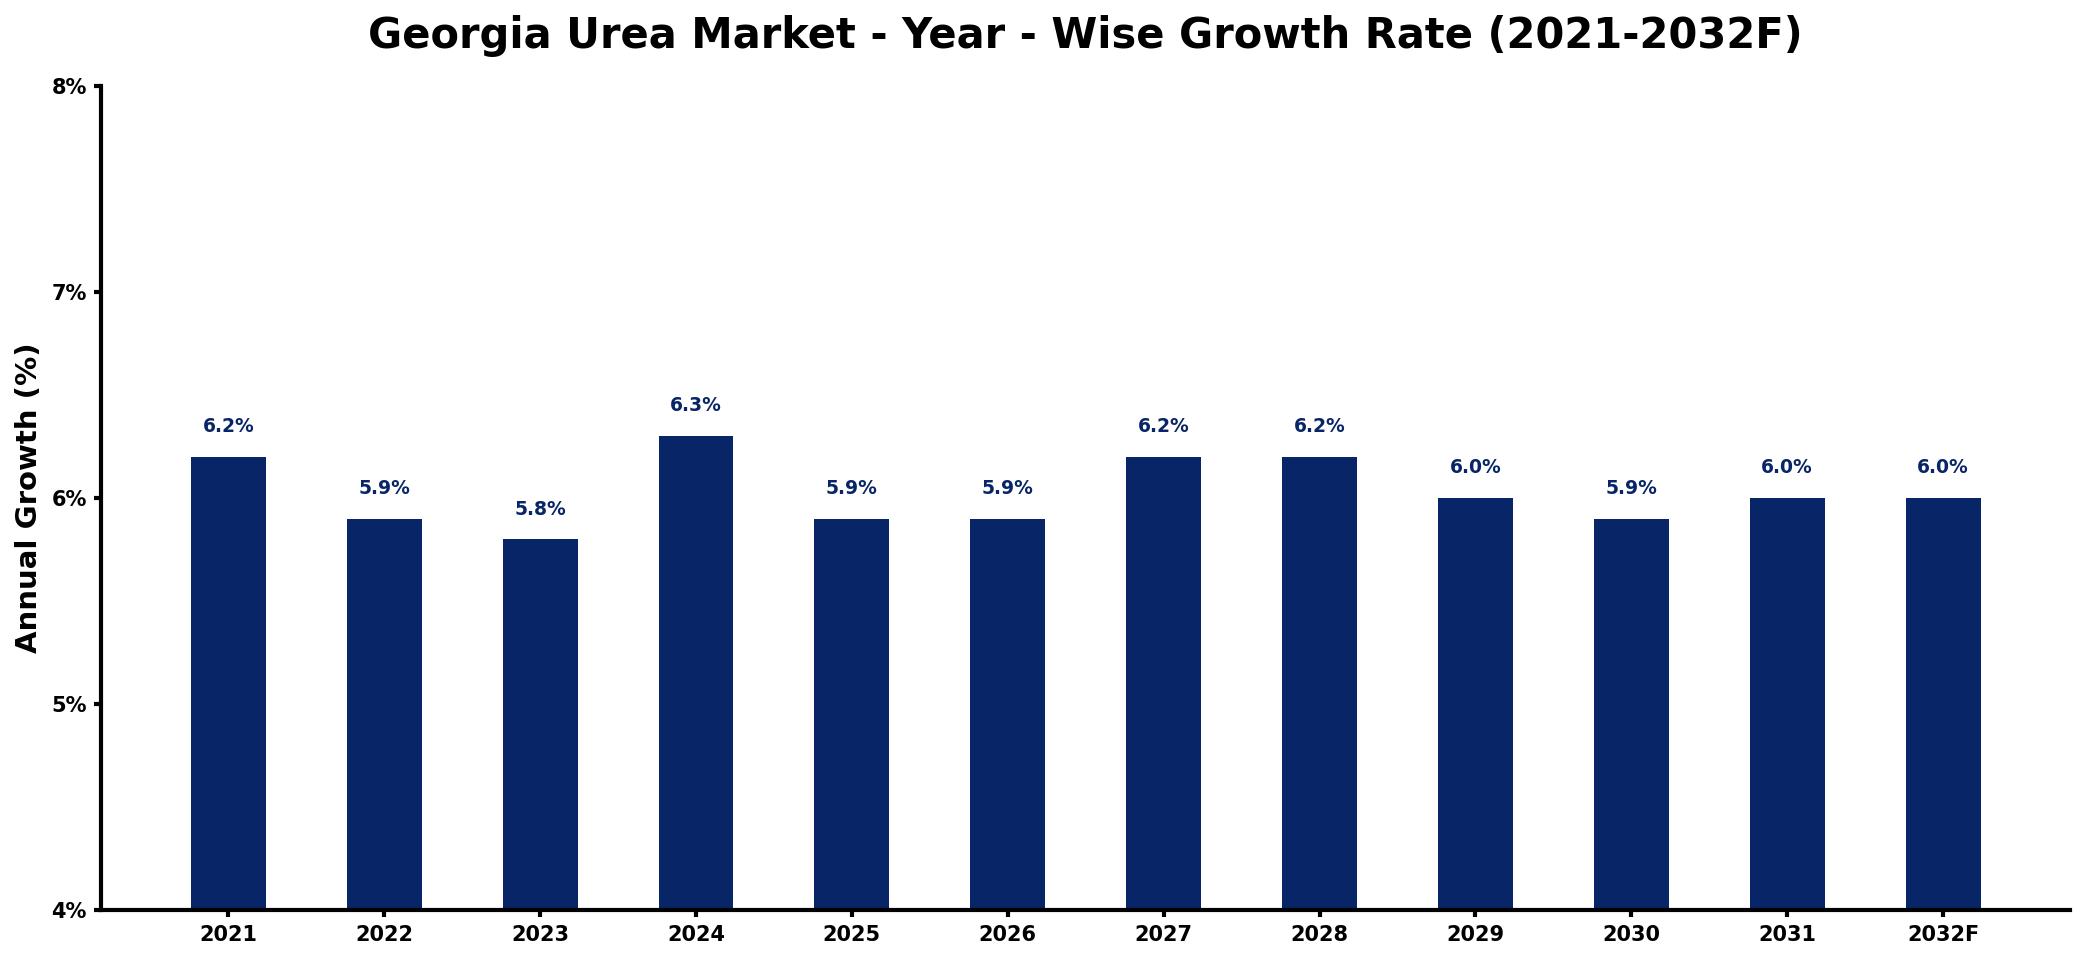
The table below presents the year‑wise growth rates along with the key drivers influencing the market
| Year | Growth Rate | Major Drivers |
| 2021 | 6.2% | Rising agricultural sector investments |
| 2022 | 5.9% | Increased fertilizer demand globally |
| 2023 | 5.8% | Expansion of farming technologies |
| 2024 | 6.3% | Growing population and food demand |
| 2025 | 5.9% | Enhanced crop yield requirements |
| 2026 | 5.9% | Shift towards sustainable practices |
| 2027 | 6.2% | Emergence of new agricultural markets |
| 2028 | 6.2% | Technological advancements in agriculture |
| 2029 | 6.0% | Increased export opportunities worldwide |
| 2030 | 5.9% | Government support for agriculture |
| 2031 | 6.0% | Rising interest in organic farming |
| 2032 | 6.0% | Development of precision agriculture techniques |
Note: Market size estimations and growth projections presented in this report are based on 6Wresearch's proprietary forecasting methodology, utilizing the latest available industry data, government publications, and primary research inputs.
Georgia Urea Market Synopsis
In Georgia, the urea market is intricately linked to the agricultural sector, where urea is indispensable for enhancing crop yields. The state's diverse agricultural landscape, which includes cotton, peanuts, and corn, underscores the need for high-quality nitrogen fertilizers, primarily urea, to ensure optimal growth and productivity.
The market is also supported by favorable weather conditions that promote farming activities, alongside governmental efforts aimed at improving agricultural practices. Enhanced distribution channels and advancements in fertilizer formulations are paving the way for increased accessibility and adoption of urea among farmers across the state.
Georgia Urea Market Key Takeaways
- The urea market in Georgia is driven by the essential role of nitrogen fertilizers in modern agriculture.
- Population growth and food security concerns are primary demand drivers for urea in the state.
- Government initiatives are crucial in maintaining market integrity and supporting local production.
- Technological advancements are influencing production and distribution efficiencies.
- Market growth faces challenges from raw material costs and environmental regulations.
Evaluation of Restraints in Georgia Urea Market
Despite the promising outlook for the Georgia urea market, several restraints impede its full potential. Fluctuations in fertilizer prices, influenced by global supply-demand dynamics, can adversely affect market stability and accessibility for farmers. Additionally, rising raw material and energy costs present ongoing challenges for producers. Environmental regulations aimed at mitigating nutrient runoff and promoting soil health add layers of complexity to urea production and distribution, necessitating adaptive strategies from stakeholders in the industry.
Georgia Urea Market Trends
Current trends indicate a growing preference for eco-friendly and efficient fertilizer formulations among farmers in Georgia. The adoption of precision agriculture techniques is gaining traction, as farmers seek to optimize their input usage and enhance crop outcomes. Innovations in urea production technologies, including slow-release formulations and enhanced efficiency fertilizers, are also shaping market dynamics and driving sustainability efforts.
Georgia Urea Market Opportunities
The Georgia urea market presents several lucrative opportunities for growth and investment. As agricultural practices continue to modernize, there is significant potential for companies to introduce advanced fertilizers that cater to evolving farmer needs. Moreover, initiatives aimed at boosting domestic production capacity can create a more resilient supply chain. Collaborations between private and public sectors focused on agricultural innovation and sustainability will likely unlock new avenues for market expansion.
Government Initiatives in the Georgia Urea Market
The Georgian government plays a proactive role in the urea market, implementing policies to ensure fair competition and safeguard consumer interests. Efforts to enhance market transparency and provide oversight contribute to a stable business environment. Additionally, government programs aimed at promoting domestic fertilizer production and encouraging the adoption of sustainable agricultural practices are vital for addressing emerging challenges and ensuring food security.
Future Insights of the Georgia Urea Market
Looking ahead to 2026-2032, the Georgia urea market is poised for continued growth, propelled by the pressing demand for agricultural efficiency and enhanced crop yields. The interplay of rising population pressures, technological advancements, and an increasingly proactive government stance will be critical in shaping the market landscape. As stakeholders adapt to environmental considerations and strive for sustainable practices, the urea market will likely witness transformative changes that align with both economic and ecological goals.
Georgia Urea Market Latest Developments (2025 - 2026)
In recent months, the Georgia urea market has witnessed notable shifts, with an increase in collaboration between agricultural technology firms and fertilizer producers aimed at enhancing product efficacy. Additionally, there is a rising focus on sustainability initiatives, leading to research investments in innovative fertilizer solutions. These developments reflect a broader industry trend towards integrating technology with traditional agricultural practices to address both productivity and environmental challenges.
Georgia Urea Market - Key Attractiveness of the Report
- 10 Years of Market Numbers
- Historical Data Starting from 2022 to 2025
- Base Year: 2025
- Forecast Data until 2032
- Key Performance Indicators Impacting the Market
- Major Upcoming Developments and Projects
Key Highlights of the Report:
- Georgia Urea Market Outlook
- Market Size of Georgia Urea Market, 2025
- Forecast of Georgia Urea Market, 2032F
- Historical Data and Forecast of Georgia Urea Revenues & Volume for the Period 2022-2032F
- Georgia Urea Market Trend Evolution
- Georgia Urea Market Drivers and Challenges
- Georgia Urea Price Trends
- Georgia Urea Porter's Five Forces
- Georgia Urea Industry Life Cycle
- Historical Data and Forecast of Georgia Urea Market Revenues & Volume By Grade for the Period 2022-2032F
- Historical Data and Forecast of Georgia Urea Market Revenues & Volume By Fertilizer for the Period 2022-2032F
- Historical Data and Forecast of Georgia Urea Market Revenues & Volume By Feed for the Period 2022-2032F
- Historical Data and Forecast of Georgia Urea Market Revenues & Volume By Technical for the Period 2022-2032F
- Historical Data and Forecast of Georgia Urea Market Revenues & Volume By End-user Industry for the Period 2022-2032F
- Historical Data and Forecast of Georgia Urea Market Revenues & Volume By Agriculture for the Period 2022-2032F
- Historical Data and Forecast of Georgia Urea Market Revenues & Volume By Chemical for the Period 2022-2032F
- Historical Data and Forecast of Georgia Urea Market Revenues & Volume By Automotive for the Period 2022-2032F
- Historical Data and Forecast of Georgia Urea Market Revenues & Volume By Medical for the Period 2022-2032F
- Historical Data and Forecast of Georgia Urea Market Revenues & Volume By Others for the Period 2022-2032F
- Georgia Urea Import Export Trade Statistics
- Market Opportunity Assessment By Grade
- Market Opportunity Assessment By End-user Industry
- Georgia Urea Top Companies Market Share
- Georgia Urea Competitive Benchmarking By Technical and Operational Parameters
- Georgia Urea Company Profiles
- Georgia Urea Key Strategic Recommendations
Frequently Asked Questions About the Market Study (FAQs):
The Georgia Urea Market is projected to grow from USD 699 Million in 2025 to USD 992 Million by 2032, at a CAGR of 5.1% from 2026 to 2032, demonstrating its considerable growth potential driven by agricultural demand.
Urea is predominantly utilized in key agricultural sectors such as cotton, peanuts, and corn farming in Georgia, reflecting the state's diverse crop cultivation.
Price volatility in the urea market is often influenced by global supply-demand dynamics, raw material costs, and fluctuations in energy prices, complicating cost predictability for producers and consumers alike.
Government initiatives focus on ensuring fair competition and promoting transparency in the market, which helps stabilize prices and support domestic production initiatives.
Increasing adoption of precision agriculture and advancements in sustainable fertilizer formulations are key trends expected to impact the Georgia urea market positively, aligning productivity with environmental stewardship.
Yes, there are substantial investment opportunities in enhancing domestic production capacity, innovating sustainable fertilizer technologies, and partnering with agricultural technology firms to meet the evolving needs of farmers.
6Wresearch actively monitors the Georgia Urea Market and publishes its comprehensive annual report, highlighting emerging trends, growth drivers, revenue analysis, and forecast outlook. Our insights help businesses to make data-backed strategic decisions with ongoing market dynamics. Our analysts track relevent industries related to the Georgia Urea Market, allowing our clients with actionable intelligence and reliable forecasts tailored to emerging regional needs.
Yes, we provide customisation as per your requirements. To learn more, feel free to contact us on sales@6wresearch.com
1 Executive Summary |
2 Introduction |
2.1 Key Highlights of the Report |
2.2 Report Description |
2.3 Market Scope & Segmentation |
2.4 Research Methodology |
2.5 Assumptions |
3 Georgia Urea Market Overview |
3.1 Georgia Country Macro Economic Indicators |
3.2 Georgia Urea Market Revenues & Volume, 2022 & 2032F |
3.3 Georgia Urea Market - Industry Life Cycle |
3.4 Georgia Urea Market - Porter's Five Forces |
3.5 Georgia Urea Market Revenues & Volume Share, By Grade, 2022 & 2032F |
3.6 Georgia Urea Market Revenues & Volume Share, By End-user Industry, 2022 & 2032F |
4 Georgia Urea Market Dynamics |
4.1 Impact Analysis |
4.2 Market Drivers |
4.2.1 Growing demand for agricultural products in Georgia, leading to increased use of urea as a fertilizer. |
4.2.2 Government initiatives to promote agriculture and increase crop yield. |
4.2.3 Technological advancements in urea production leading to cost efficiency and improved quality. |
4.3 Market Restraints |
4.3.1 Fluctuating raw material prices impacting urea production costs. |
4.3.2 Environmental concerns related to urea usage, leading to regulatory challenges. |
4.3.3 Competition from alternative fertilizers affecting market growth. |
5 Georgia Urea Market Trends |
6 Georgia Urea Market, By Types |
6.1 Georgia Urea Market, By Grade |
6.1.1 Overview and Analysis |
6.1.2 Georgia Urea Market Revenues & Volume, By Grade, 2022-2032F |
6.1.3 Georgia Urea Market Revenues & Volume, By Fertilizer, 2022-2032F |
6.1.4 Georgia Urea Market Revenues & Volume, By Feed, 2022-2032F |
6.1.5 Georgia Urea Market Revenues & Volume, By Technical, 2022-2032F |
6.2 Georgia Urea Market, By End-user Industry |
6.2.1 Overview and Analysis |
6.2.2 Georgia Urea Market Revenues & Volume, By Agriculture, 2022-2032F |
6.2.3 Georgia Urea Market Revenues & Volume, By Chemical, 2022-2032F |
6.2.4 Georgia Urea Market Revenues & Volume, By Automotive, 2022-2032F |
6.2.5 Georgia Urea Market Revenues & Volume, By Medical, 2022-2032F |
6.2.6 Georgia Urea Market Revenues & Volume, By Others, 2022-2032F |
7 Georgia Urea Market Import-Export Trade Statistics |
7.1 Georgia Urea Market Export to Major Countries |
7.2 Georgia Urea Market Imports from Major Countries |
8 Georgia Urea Market Key Performance Indicators |
8.1 Average selling price of urea in Georgia. |
8.2 Adoption rate of advanced urea application technologies. |
8.3 Rate of investment in research and development for urea production efficiency. |
8.4 Environmental impact assessment and compliance rate for urea producers. |
8.5 Percentage of agricultural land in Georgia utilizing urea fertilizers. |
9 Georgia Urea Market - Opportunity Assessment |
9.1 Georgia Urea Market Opportunity Assessment, By Grade, 2022 & 2032F |
9.2 Georgia Urea Market Opportunity Assessment, By End-user Industry, 2022 & 2032F |
10 Georgia Urea Market - Competitive Landscape |
10.1 Georgia Urea Market Revenue Share, By Companies, 2025 |
10.2 Georgia Urea Market Competitive Benchmarking, By Operating and Technical Parameters |
11 Company Profiles |
12 Recommendations |
13 Disclaimer |
Global Go To Market Strategy - 2030
Export potential enables firms to identify high-growth global markets with greater confidence by combining advanced trade intelligence with a structured quantitative methodology. The framework analyzes emerging demand trends and country-level import patterns while integrating macroeconomic and trade datasets such as GDP and population forecasts, bilateral import–export flows, tariff structures, elasticity differentials between developed and developing economies, geographic distance, and import demand projections. Using weighted trade values from 2020–2024 as the base period to project country-to-country export potential for 2030, these inputs are operationalized through calculated drivers such as gravity model parameters, tariff impact factors, and projected GDP per-capita growth. Through an analysis of hidden potentials, demand hotspots, and market conditions that are most favorable to success, this method enables firms to focus on target countries, maximize returns, and global expansion with data, backed by accuracy.
By factoring in the projected importer demand gap that is currently unmet and could be potential opportunity, it identifies the potential for the Exporter (Country) among 190 countries, against the general trade analysis, which identifies the biggest importer or exporter.
To discover high-growth global markets and optimize your business strategy:
Click Here
Pricing
- Single User License$ 1,995
- Department License$ 2,400
- Site License$ 3,120
- Global License$ 3,795

Leadership Perspectives from Industry Events
Search
Thought Leadership and Analyst Meet


Our Clients
6WResearch In News
- India Export Attractiveness Tracker 2026
- India Air Conditioner Market Set for Strong Rebound in 2026 After Weather-Led Correction and GST-Driven Recovery: 6Wresearch
- ADAS in India: How Automatic Emergency Braking, Blind Spot Detection & Driver Monitoring are Transforming Road Safety
- Doha a strategic location for EV manufacturing hub: IPA Qatar
- Demand for luxury TVs surging in the GCC, says Samsung
- Empowering Growth: The Thriving Journey of Bangladesh’s Cable Industry
Latest Reports
- Nicaragua RPG Gaming Market (2026-2032)
- New Zealand RPG Gaming Market (2026-2032)
- Netherlands RPG Gaming Market (2026-2032)
- Nauru RPG Gaming Market (2026-2032)
- Namibia RPG Gaming Market (2026-2032)
- Mozambique RPG Gaming Market (2026-2032)
- Montenegro RPG Gaming Market (2026-2032)
- Mongolia RPG Gaming Market (2026-2032)
- Monaco RPG Gaming Market (2026-2032)
- Micronesia RPG Gaming Market (2026-2032)
Industry Events and Analyst Meet

EV India Expo 2026

HIMTEX 2026

India Refining Summit 2026

India EV Show 2026

EV tech India Expo 2026
Whitepaper
- Middle East & Africa Commercial Security Market Click here to view more.
- Middle East & Africa Fire Safety Systems & Equipment Market Click here to view more.
- GCC Drone Market Click here to view more.
- Middle East Lighting Fixture Market Click here to view more.
- GCC Physical & Perimeter Security Market Click here to view more.