Luxembourg Urea Market (2026-2032) | Analysis, Growth, Value, Industry, Revenue, Size, Segmentation, Companies, Trends, Outlook, Forecast & Share
Market Forecast By Grade (Fertilizer, Feed, Technical), By End-user Industry (Agriculture, Chemical, Automotive, Medical, Others) And Competitive Landscape
| Product Code: ETC4901110 | Publication Date: Nov 2023 | Updated Date: Apr 2026 | Product Type: Market Research Report | |
| Publisher: 6Wresearch | Author: Shubham Padhi | No. of Pages: 60 | No. of Figures: 30 | No. of Tables: 5 |
Luxembourg Urea Market Size (2020-2030)
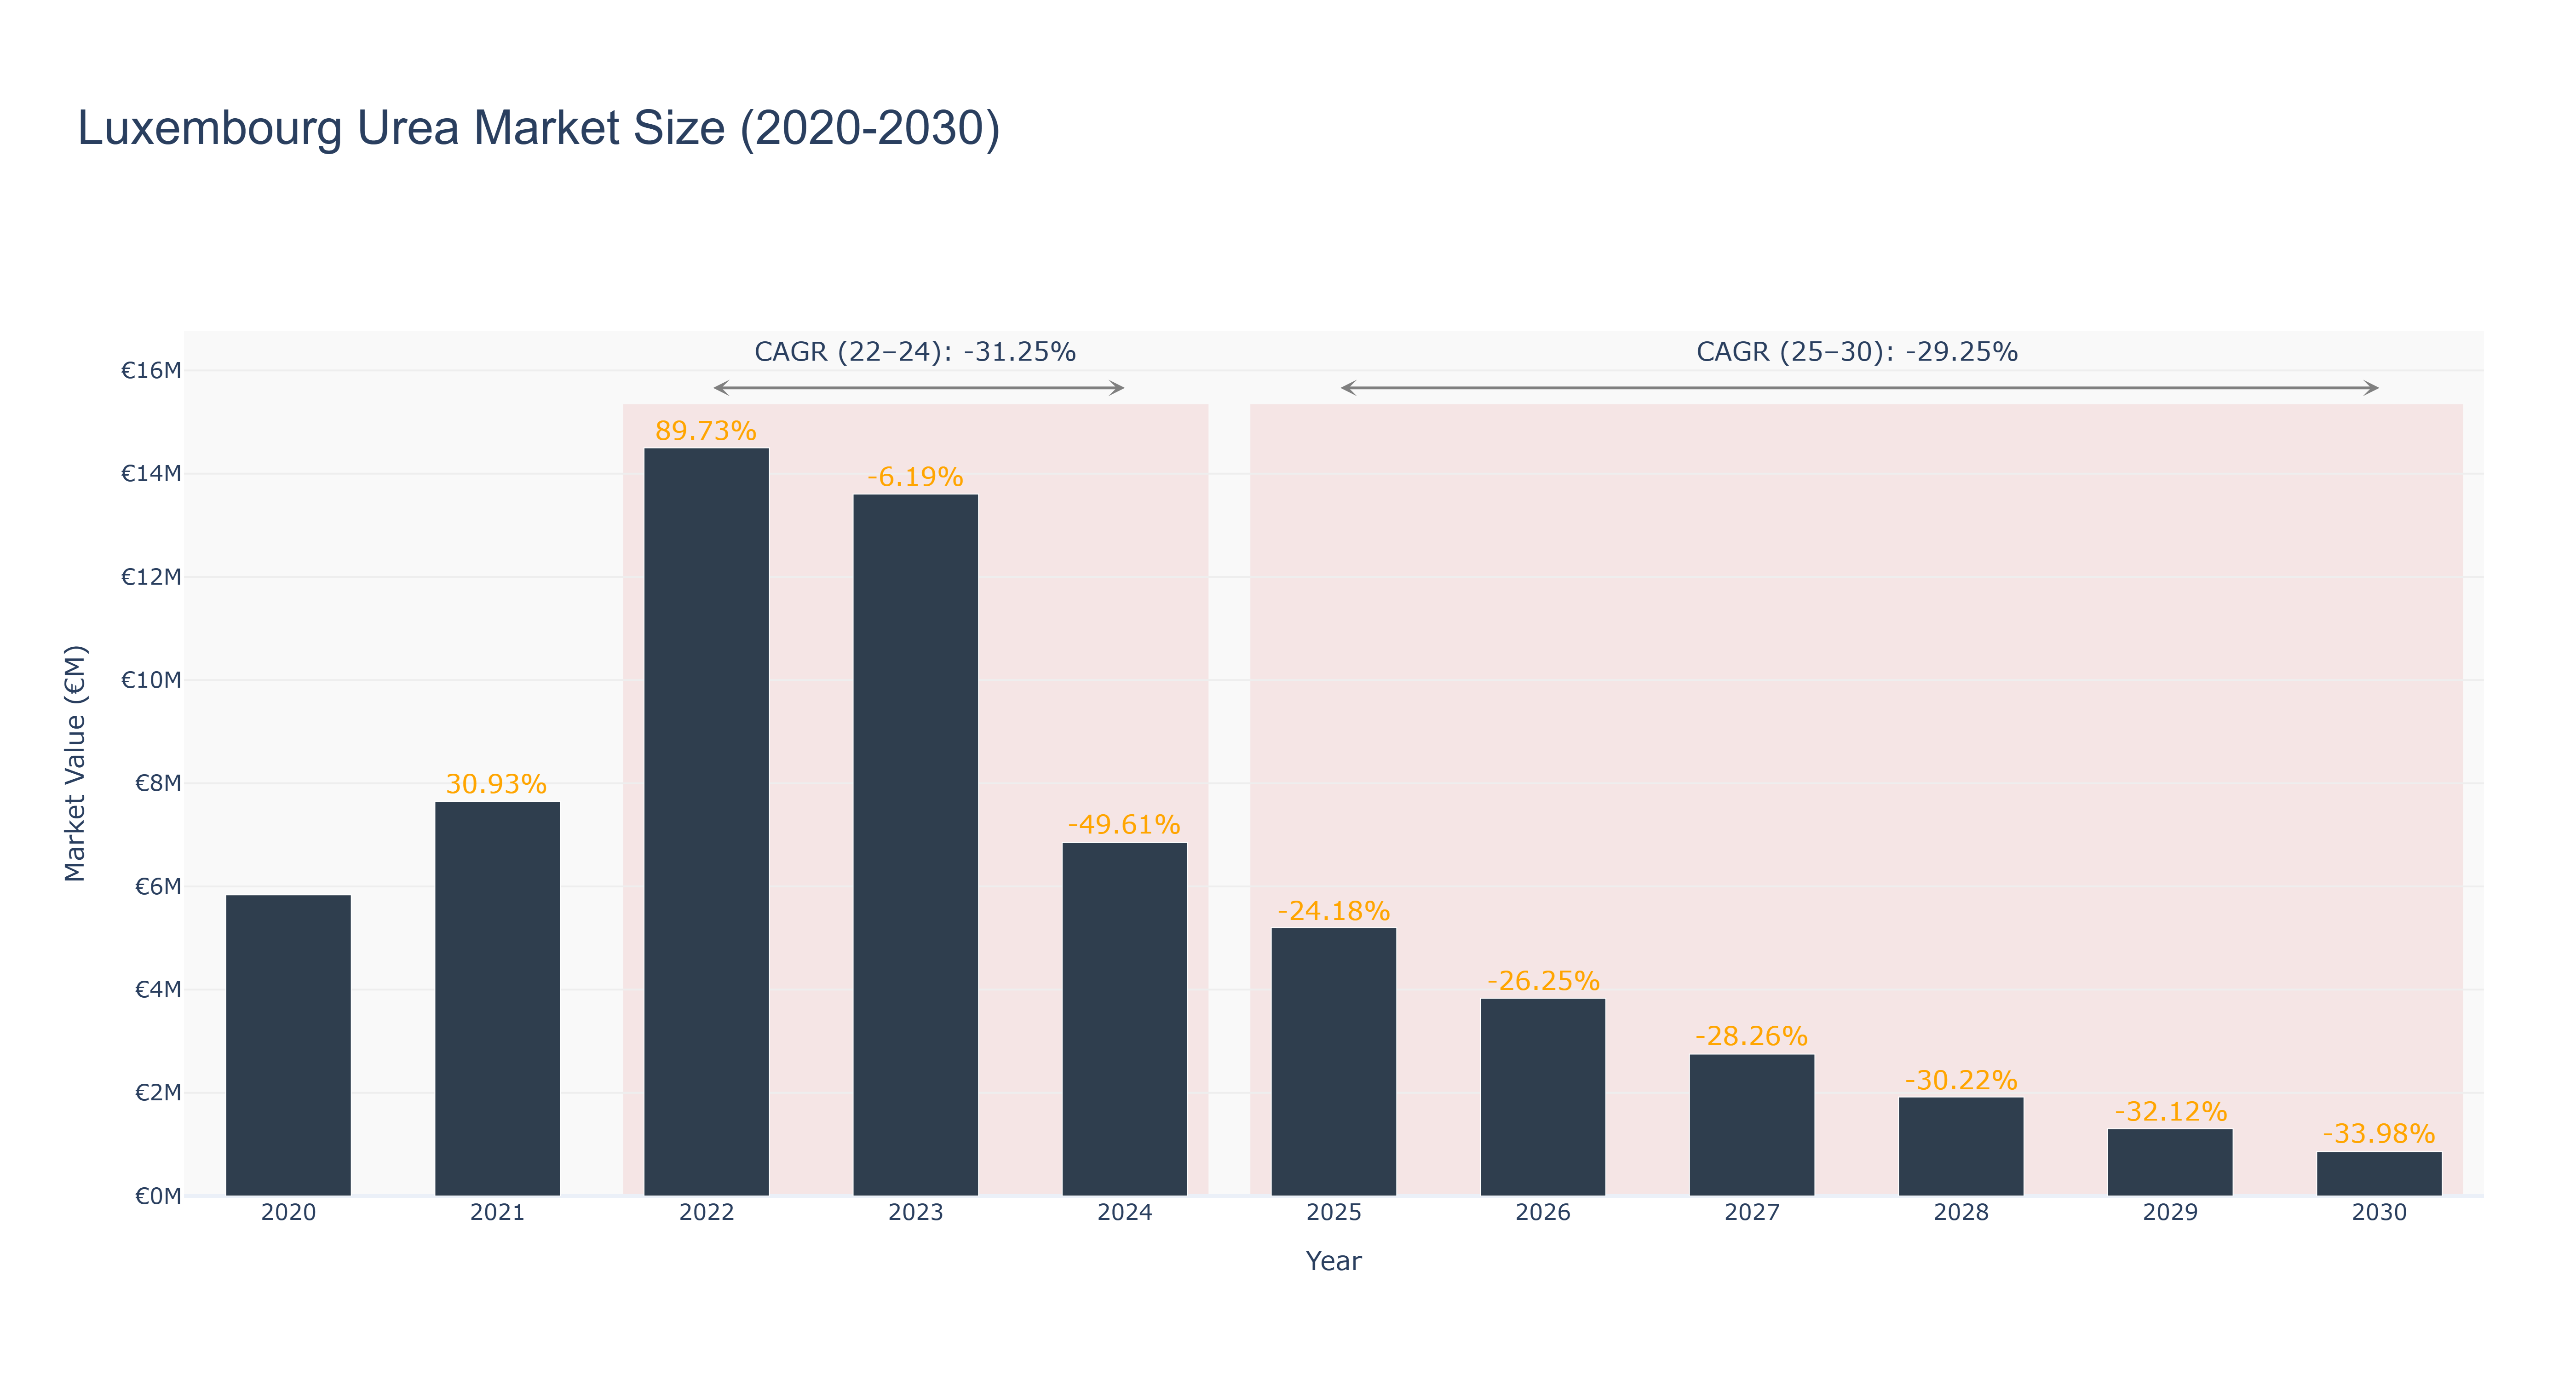
The Luxembourg Urea Market reached its peak in 2022, with a market size of €14.50 million, reflecting a remarkable growth rate of 89.73% from the previous year. However, this upward trajectory was short-lived, as the market experienced a decline in 2023, dropping to €13.60 million (-6.19%), and further plummeting to €6.85 million in 2024, marking a staggering contraction of -49.61%. The forecast for 2025-2030 indicates a continued downward trend, with projected market sizes diminishing to €860.05 thousand by 2030, reflecting a compound annual growth rate (CAGR) of -29.25%. This decline can be attributed to market saturation, increased competition, and shifting agricultural practices. While no specific upcoming projects have been highlighted, macroeconomic factors such as changes in regulatory frameworks and environmental considerations may influence future market dynamics. Overall, the Luxembourg Urea Market faces significant challenges in the coming years.
Luxembourg Urea Market: Production & Trade Performance (2019-2025)
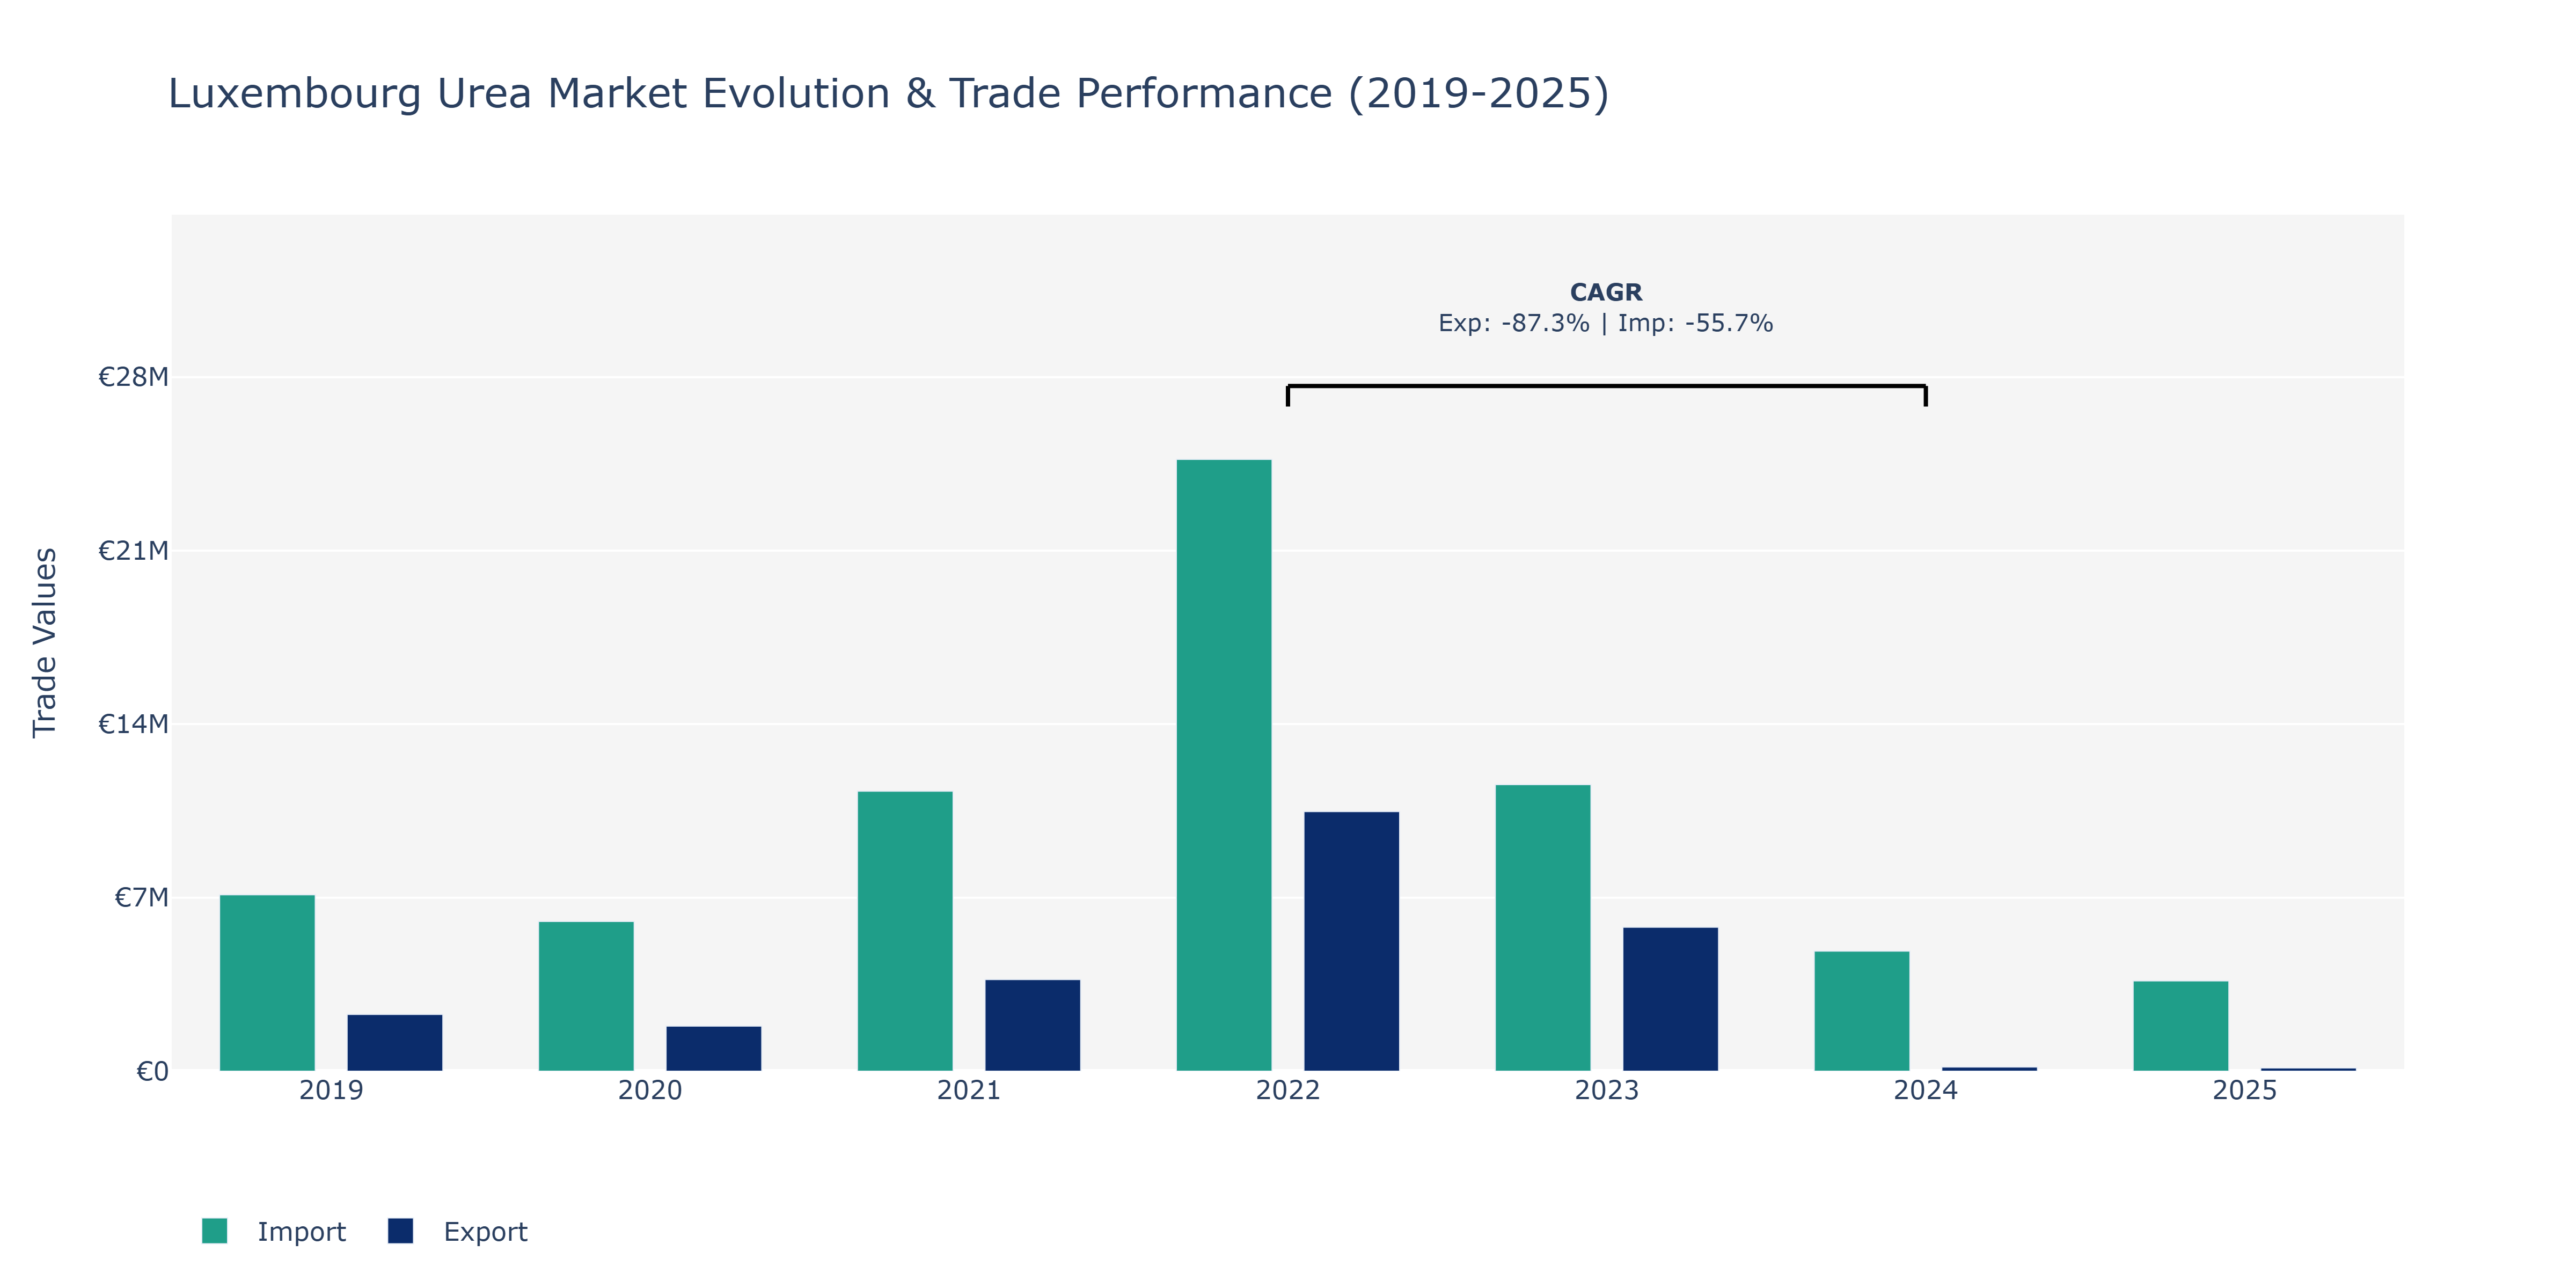
Between 2019 and 2025, the Luxembourg Urea Market showcased varying trends in both exports and imports. The market experienced a notable decline in exports from €2.29 million in 2019 to €127.68 thousand in 2025, with a substantial drop observed in 2024. In contrast, imports followed a fluctuating trajectory, reaching €24.68 million in 2022, the peak point during the period. The considerable decrease in imports to €3.64 million in 2025 signifies a contrasting pattern to the export trend. These fluctuations could be attributed to global economic conditions, trade agreements, and shifts in demand for urea-based products. Factors such as changes in agricultural practices, environmental regulations impacting fertilizer usage, and competitive pricing strategies in the urea market may have influenced the import and export dynamics. Luxembourg's positioning as a hub for international trade and its strategic partnerships within the urea industry likely played a role in shaping these market movements.
Key Highlights of the Report:
- Luxembourg Urea Market Outlook
- Market Size of Luxembourg Urea Market, 2025
- Forecast of Luxembourg Urea Market, 2032
- Historical Data and Forecast of Luxembourg Urea Revenues & Volume for the Period 2022-2032F
- Luxembourg Urea Market Trend Evolution
- Luxembourg Urea Market Drivers and Challenges
- Luxembourg Urea Price Trends
- Luxembourg Urea Porter`s Five Forces
- Luxembourg Urea Industry Life Cycle
- Historical Data and Forecast of Luxembourg Urea Market Revenues & Volume By Grade for the Period 2022-2032F
- Historical Data and Forecast of Luxembourg Urea Market Revenues & Volume By Fertilizer for the Period 2022-2032F
- Historical Data and Forecast of Luxembourg Urea Market Revenues & Volume By Feed for the Period 2022-2032F
- Historical Data and Forecast of Luxembourg Urea Market Revenues & Volume By Technical for the Period 2022-2032F
- Historical Data and Forecast of Luxembourg Urea Market Revenues & Volume By End-user Industry for the Period 2022-2032F
- Historical Data and Forecast of Luxembourg Urea Market Revenues & Volume By Agriculture for the Period 2022-2032F
- Historical Data and Forecast of Luxembourg Urea Market Revenues & Volume By Chemical for the Period 2022-2032F
- Historical Data and Forecast of Luxembourg Urea Market Revenues & Volume By Automotive for the Period 2022-2032F
- Historical Data and Forecast of Luxembourg Urea Market Revenues & Volume By Medical for the Period 2022-2032F
- Historical Data and Forecast of Luxembourg Urea Market Revenues & Volume By Others for the Period 2022-2032F
- Luxembourg Urea Import Export Trade Statistics
- Market Opportunity Assessment By Grade
- Market Opportunity Assessment By End-user Industry
- Luxembourg Urea Top Companies Market Share
- Luxembourg Urea Competitive Benchmarking By Technical and Operational Parameters
- Luxembourg Urea Company Profiles
- Luxembourg Urea Key Strategic Recommendations
Frequently Asked Questions About the Market Study (FAQs):
6Wresearch actively monitors the Luxembourg Urea Market and publishes its comprehensive annual report, highlighting emerging trends, growth drivers, revenue analysis, and forecast outlook. Our insights help businesses to make data-backed strategic decisions with ongoing market dynamics. Our analysts track relevent industries related to the Luxembourg Urea Market, allowing our clients with actionable intelligence and reliable forecasts tailored to emerging regional needs.
Yes, we provide customisation as per your requirements. To learn more, feel free to contact us on sales@6wresearch.com
1 Executive Summary |
2 Introduction |
2.1 Key Highlights of the Report |
2.2 Report Description |
2.3 Market Scope & Segmentation |
2.4 Research Methodology |
2.5 Assumptions |
3 Luxembourg Urea Market Overview |
3.1 Luxembourg Country Macro Economic Indicators |
3.2 Luxembourg Urea Market Revenues & Volume, 2022 & 2032F |
3.3 Luxembourg Urea Market - Industry Life Cycle |
3.4 Luxembourg Urea Market - Porter's Five Forces |
3.5 Luxembourg Urea Market Revenues & Volume Share, By Grade, 2022 & 2032F |
3.6 Luxembourg Urea Market Revenues & Volume Share, By End-user Industry, 2022 & 2032F |
4 Luxembourg Urea Market Dynamics |
4.1 Impact Analysis |
4.2 Market Drivers |
4.2.1 Growing demand for urea as a fertilizer due to increasing agricultural activities in Luxembourg |
4.2.2 Technological advancements in urea production leading to cost efficiencies |
4.2.3 Favorable government regulations supporting agricultural sector growth in Luxembourg |
4.3 Market Restraints |
4.3.1 Fluctuating raw material prices impacting urea production costs |
4.3.2 Environmental concerns related to urea usage affecting market growth |
4.3.3 Competition from alternative fertilizers impacting market share |
5 Luxembourg Urea Market Trends |
6 Luxembourg Urea Market Segmentations |
6.1 Luxembourg Urea Market, By Grade |
6.1.1 Overview and Analysis |
6.1.2 Luxembourg Urea Market Revenues & Volume, By Fertilizer, 2022-2032F |
6.1.3 Luxembourg Urea Market Revenues & Volume, By Feed, 2022-2032F |
6.1.4 Luxembourg Urea Market Revenues & Volume, By Technical, 2022-2032F |
6.2 Luxembourg Urea Market, By End-user Industry |
6.2.1 Overview and Analysis |
6.2.2 Luxembourg Urea Market Revenues & Volume, By Agriculture, 2022-2032F |
6.2.3 Luxembourg Urea Market Revenues & Volume, By Chemical, 2022-2032F |
6.2.4 Luxembourg Urea Market Revenues & Volume, By Automotive, 2022-2032F |
6.2.5 Luxembourg Urea Market Revenues & Volume, By Medical, 2022-2032F |
6.2.6 Luxembourg Urea Market Revenues & Volume, By Others, 2022-2032F |
7 Luxembourg Urea Market Import-Export Trade Statistics |
7.1 Luxembourg Urea Market Export to Major Countries |
7.2 Luxembourg Urea Market Imports from Major Countries |
8 Luxembourg Urea Market Key Performance Indicators |
8.1 Average selling price of urea in Luxembourg |
8.2 Adoption rate of advanced urea production technologies in the market |
8.3 Percentage of agricultural land using urea as a primary fertilizer |
8.4 Environmental impact assessment of urea production and usage in the market |
8.5 Investment trends in the Luxembourg urea market for capacity expansion or new product development |
9 Luxembourg Urea Market - Opportunity Assessment |
9.1 Luxembourg Urea Market Opportunity Assessment, By Grade, 2022 & 2032F |
9.2 Luxembourg Urea Market Opportunity Assessment, By End-user Industry, 2022 & 2032F |
10 Luxembourg Urea Market - Competitive Landscape |
10.1 Luxembourg Urea Market Revenue Share, By Companies, 2025 |
10.2 Luxembourg Urea Market Competitive Benchmarking, By Operating and Technical Parameters |
11 Company Profiles |
12 Recommendations | 13 Disclaimer |
Global Go To Market Strategy - 2030
Export potential enables firms to identify high-growth global markets with greater confidence by combining advanced trade intelligence with a structured quantitative methodology. The framework analyzes emerging demand trends and country-level import patterns while integrating macroeconomic and trade datasets such as GDP and population forecasts, bilateral import–export flows, tariff structures, elasticity differentials between developed and developing economies, geographic distance, and import demand projections. Using weighted trade values from 2020–2024 as the base period to project country-to-country export potential for 2030, these inputs are operationalized through calculated drivers such as gravity model parameters, tariff impact factors, and projected GDP per-capita growth. Through an analysis of hidden potentials, demand hotspots, and market conditions that are most favorable to success, this method enables firms to focus on target countries, maximize returns, and global expansion with data, backed by accuracy.
By factoring in the projected importer demand gap that is currently unmet and could be potential opportunity, it identifies the potential for the Exporter (Country) among 190 countries, against the general trade analysis, which identifies the biggest importer or exporter.
To discover high-growth global markets and optimize your business strategy:
Click Here
Pricing
- Single User License$ 1,995
- Department License$ 2,400
- Site License$ 3,120
- Global License$ 3,795

Leadership Perspectives from Industry Events
Search
Thought Leadership and Analyst Meet


Our Clients
6WResearch In News
- Doha a strategic location for EV manufacturing hub: IPA Qatar
- Demand for luxury TVs surging in the GCC, says Samsung
- Empowering Growth: The Thriving Journey of Bangladesh’s Cable Industry
- Demand for luxury TVs surging in the GCC, says Samsung
- Video call with a traditional healer? Once unthinkable, it’s now common in South Africa
- Intelligent Buildings To Smooth GCC’s Path To Net Zero
Latest Reports
- Poland Fire Protection Systems Market (2026-2032)
- Cape Verde Portable Hand-Thrown Extinguisher Market (2026-2032)
- Canada Portable Hand-Thrown Extinguisher Market (2026-2032)
- Cameroon Portable Hand-Thrown Extinguisher Market (2026-2032)
- Burundi Portable Hand-Thrown Extinguisher Market (2026-2032)
- Burkina Faso Portable Hand-Thrown Extinguisher Market (2026-2032)
- Bulgaria Portable Hand-Thrown Extinguisher Market (2026-2032)
- Brunei Portable Hand-Thrown Extinguisher Market (2026-2032)
- Botswana Portable Hand-Thrown Extinguisher Market (2026-2032)
- Bosnia and Herzegovina Portable Hand-Thrown Extinguisher Market (2026-2032)
Industry Events and Analyst Meet

HIMTEX 2026

India Refining Summit 2026

India EV Show 2026

EV tech India Expo 2026

Auto Tech Asia 2026
Whitepaper
- Middle East & Africa Commercial Security Market Click here to view more.
- Middle East & Africa Fire Safety Systems & Equipment Market Click here to view more.
- GCC Drone Market Click here to view more.
- Middle East Lighting Fixture Market Click here to view more.
- GCC Physical & Perimeter Security Market Click here to view more.