Ghana Inorganic salts Market (2026-2032) Outlook | Analysis, Size, Forecast, Companies, Industry, Trends, Revenue, Growth, Value & Share
Market Forecast By Application (Chemicals, Food Industry, Pharmaceuticals and Personal Care, Agriculture, Others) And Competitive Landscape
| Product Code: ETC415072 | Publication Date: Oct 2022 | Updated Date: Jul 2026 | Product Type: Market Research Report | |
| Publisher: 6Wresearch | Author: Sumit Sagar | No. of Pages: 75 | No. of Figures: 35 | No. of Tables: 20 |
Ghana Inorganic salts Market Size, Share & Growth Rate
The Ghana Inorganic salts Market was estimated at USD 257 Million in 2025 and is projected to reach USD 348 Million by 2032, growing at a CAGR of 4.4% from 2026 to 2032. This growth is being propelled by the increasing application of inorganic salts across key sectors, particularly agriculture, pharmaceuticals, and food processing. As Ghana focuses on enhancing agricultural output and improving food security, the demand for high-quality inorganic salts as fertilizers and preservatives is set to rise.
Ghana Inorganic salts Market Year-wise Growth Rate and Key Drivers
This graph highlights how the Ghana Inorganic salts Market has steadily grown over the years, supported by major growth factors.
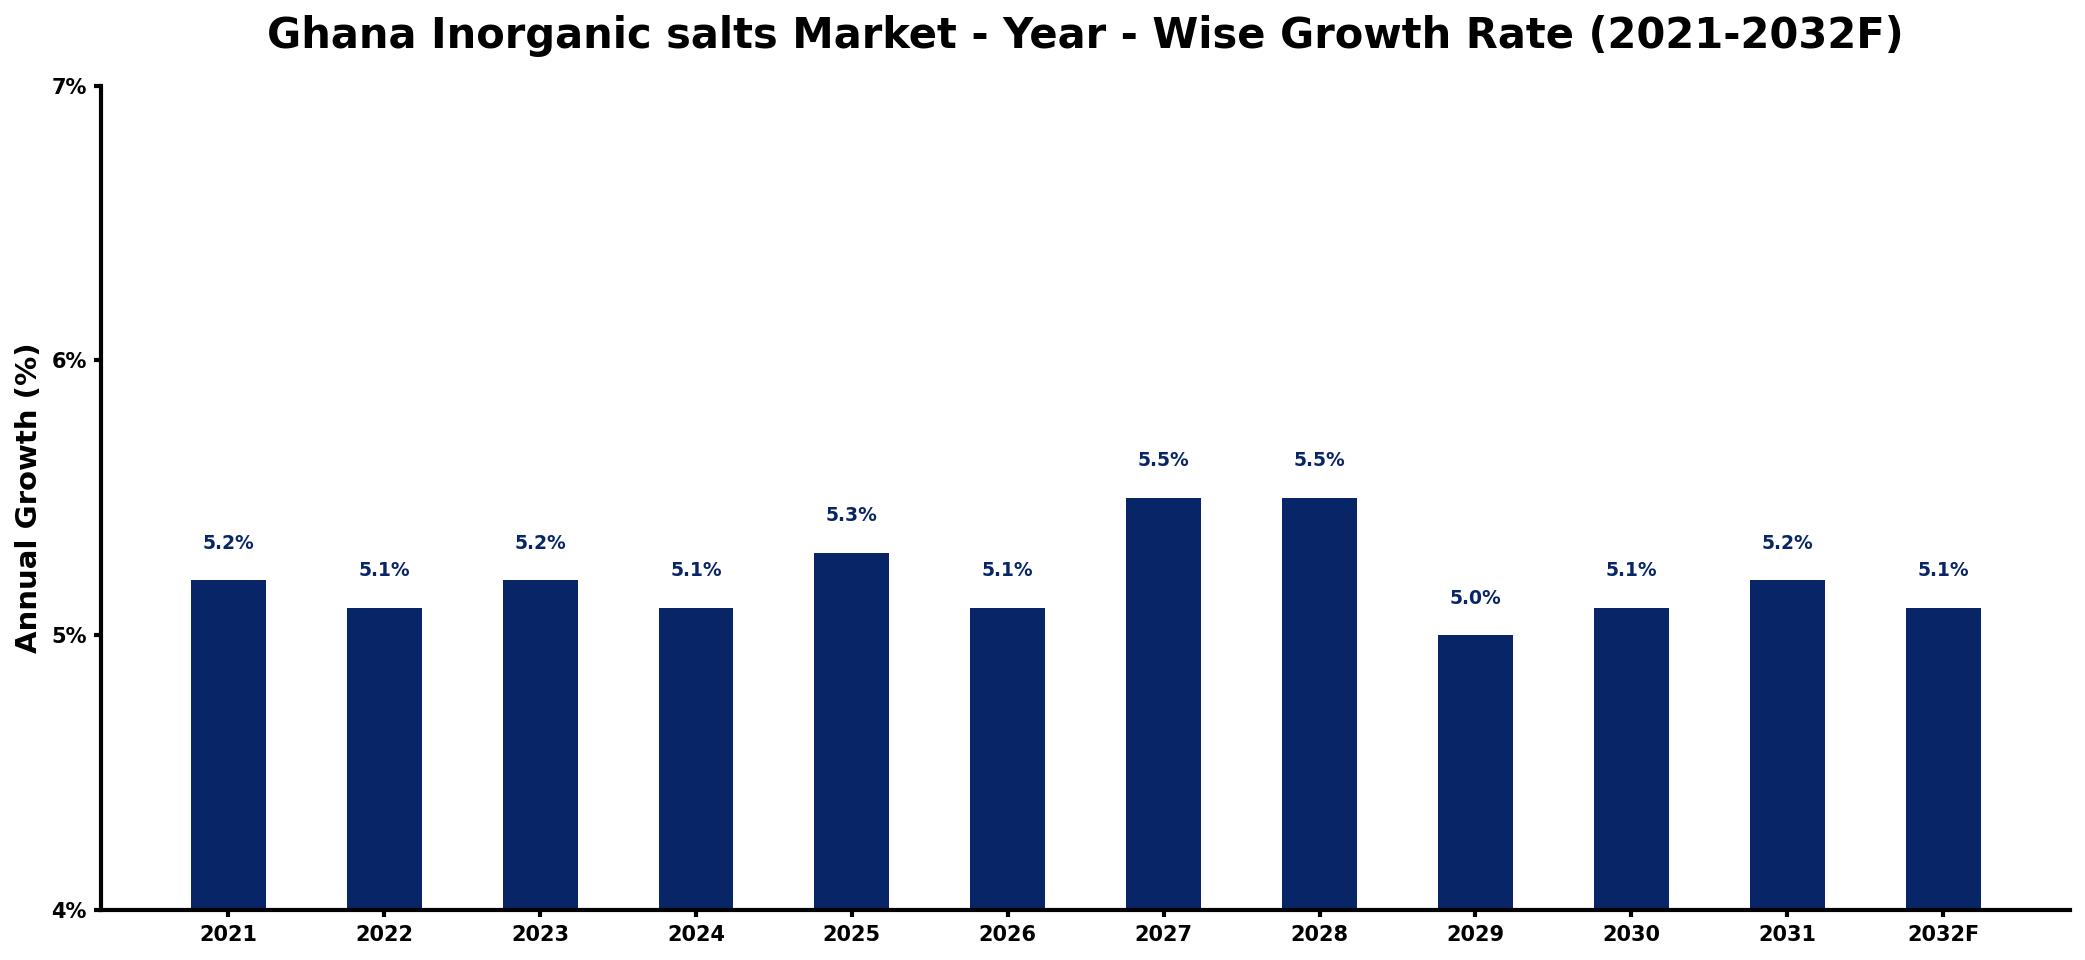
The table below presents the year‑wise growth rates along with the key drivers influencing the market
| Year | Growth Rate | Major Drivers |
| 2021 | 5.2% | Rising agricultural input requirements |
| 2022 | 5.1% | Increased industrial manufacturing activities |
| 2023 | 5.2% | Growing demand for water treatment |
| 2024 | 5.1% | Expansion of construction sector projects |
| 2025 | 5.3% | Boost in food processing industries |
| 2026 | 5.1% | Higher investments in mining sector |
| 2027 | 5.5% | Surge in pharmaceutical production needs |
| 2028 | 5.5% | Enhanced research and development initiatives |
| 2029 | 5.0% | Growing consumer goods production |
| 2030 | 5.1% | Increased focus on environmental sustainability |
| 2031 | 5.2% | Rising demand for specialty chemicals |
| 2032 | 5.1% | improved raw material availability |
Note: Market size estimations and growth projections presented in this report are based on 6Wresearch's proprietary forecasting methodology, utilizing the latest available industry data, government publications, and primary research inputs.
Ghana Inorganic salts Market Synopsis
The Ghana inorganic salts market has exhibited robust momentum in recent years, driven by the evolving needs of various industries. However, the market is on the brink of a new phase of expansion as awareness regarding the benefits of these salts spreads among both manufacturers and consumers. As local industries seek more sustainable practices, the emphasis on quality and innovation will play a significant role in shaping future dynamics.
A considerable proportion of inorganic salts used in Ghana is dedicated to agriculture, where they play a vital role in soil nutrient management. Meanwhile, the pharmaceutical sectors reliance on these salts for drug formulations complements the demands from the food processing industry, where they are essential for preservation and flavor enhancement. This multi-faceted demand showcases the market's potential for sustained growth.
Ghana Inorganic salts Market Key Takeaways
- The Ghana inorganic salts market is projected to grow steadily, driven by agriculture, pharmaceuticals, and food processing.
- Increasing adoption of these salts in agricultural practices is enhancing soil fertility and crop yield.
- There is a rising trend of utilizing inorganic salts for water treatment processes to improve water quality.
- Manufacturers are focusing on product innovation and sustainability to align with consumer preferences.
- Government policies are shaping a competitive landscape by promoting local production and enforcing quality standards.
Evaluation of Restraints in Ghana Inorganic salts Market
Despite the promising outlook, the Ghana inorganic salts market faces several restraints that could hinder its growth. Intense competition from both domestic and international players can compress margins and limit market share for local manufacturers. Additionally, fluctuations in raw material prices often lead to unpredictable cost structures. Infrastructure inadequacies, particularly in transportation and storage, impede efficient distribution and may affect product availability in various regions. Furthermore, regulatory hurdles surrounding quality standards and environmental compliance present ongoing challenges that require strategic navigation to ensure market competitiveness.
Ghana Inorganic salts Market Trends
Current trends indicate a growing emphasis on the sustainability of inorganic salts within agricultural applications. Farmers are increasingly recognizing the role of these salts in improving soil fertility and enhancing crop yields. Additionally, there is a marked rise in the use of inorganic salts for water treatment processes, as industries strive to meet regulatory water quality standards. The pharmaceutical sector is also witnessing innovation, with new formulations harnessing the unique properties of inorganic salts to develop more effective medicines.
Ghana Inorganic salts Market Opportunities
The opportunities in the Ghana inorganic salts market are significant, particularly as the population grows and disposable incomes rise. The increasing demand for sodium chloride, potassium nitrate, and calcium chloride in various sectors positions investors favorably for long-term gains. As Ghana continues to stabilize politically and invest in infrastructure, there is a conducive environment for expanding production, distribution, and marketing capacities. Moreover, advancements in research are likely to unveil innovative applications, further enhancing market potential for investors seeking profitable ventures.
Government Initiatives in the Ghana Inorganic salts Market
The Ghanaian government has actively implemented policies to regulate the inorganic salts market, aiming to promote local production and ensure product quality. Initiatives include quality control measures that align with international safety standards, tariffs on imported inorganic salts to protect local manufacturers, and regulations regarding the handling and disposal of these substances to safeguard environmental integrity. These measures are designed to foster a competitive and sustainable market landscape while ensuring public health is prioritized.
Future Insights of the Ghana Inorganic salts Market
Looking ahead to the period of 2026-2032, the Ghana inorganic salts market is poised for substantial growth. With increasing industrial activities and a burgeoning agricultural sector, the demand for various inorganic salts is expected to surge. The focus on infrastructure development and government-backed initiatives will further stimulate this market. Nevertheless, companies must remain vigilant regarding fluctuations in raw material prices and environmental considerations. Overall, the synergy between industrial advancements and consumer awareness will likely catalyze continued growth in this vibrant market.
Ghana Inorganic salts Market Latest Developments (2025 - 2026)
Recent developments in the Ghana inorganic salts market highlight a trend towards increased investment in local production facilities, as manufacturers look to reduce dependency on imports. Innovations in sustainable production methods are being explored, particularly within the agricultural sector, where the emphasis on eco-friendly practices continues to rise. Furthermore, collaborations between private and public sectors are gaining traction, aimed at enhancing distribution networks and improving product access across the nation.
Ghana Inorganic salts Market - Key Attractiveness of the Report
- 10 Years of Market Numbers
- Historical Data Starting from 2022 to 2025
- Base Year: 2025
- Forecast Data until 2032
- Key Performance Indicators Impacting the Market
- Major Upcoming Developments and Projects
Key Highlights of the Report:
- Ghana Inorganic salts Market Outlook
- Market Size of Ghana Inorganic salts Market, 2025
- Forecast of Ghana Inorganic salts Market, 2032
- Historical Data and Forecast of Ghana Inorganic salts Revenues & Volume for the Period 2022-2032F
- Ghana Inorganic salts Market Trend Evolution
- Ghana Inorganic salts Market Drivers and Challenges
- Ghana Inorganic salts Price Trends
- Ghana Inorganic salts Porter's Five Forces
- Ghana Inorganic salts Industry Life Cycle
- Historical Data and Forecast of Ghana Inorganic salts Market Revenues & Volume By Application for the Period 2022-2032F
- Historical Data and Forecast of Ghana Inorganic salts Market Revenues & Volume By Chemicals for the Period 2022-2032F
- Historical Data and Forecast of Ghana Inorganic salts Market Revenues & Volume By Food Industry for the Period 2022-2032F
- Historical Data and Forecast of Ghana Inorganic salts Market Revenues & Volume By Pharmaceuticals and Personal Care for the Period 2022-2032F
- Historical Data and Forecast of Ghana Inorganic salts Market Revenues & Volume By Agriculture for the Period 2022-2032F
- Historical Data and Forecast of Ghana Inorganic salts Market Revenues & Volume By Others for the Period 2022-2032F
- Ghana Inorganic salts Import Export Trade Statistics
- Market Opportunity Assessment By Application
- Ghana Inorganic salts Top Companies Market Share
- Ghana Inorganic salts Competitive Benchmarking By Technical and Operational Parameters
- Ghana Inorganic salts Company Profiles
- Ghana Inorganic salts Key Strategic Recommendations
Frequently Asked Questions About the Market Study (FAQs):
The growth is primarily driven by increasing demand across the agriculture, pharmaceutical, and food processing sectors, which rely on inorganic salts for various applications.
The Ghana Inorganic salts Market was estimated at USD 257 Million in 2025 and is projected to reach USD 348 Million by 2032, growing at a CAGR of 4.4% from 2026 to 2032.
Inorganic salts are extensively used in agriculture for fertilizers, in pharmaceuticals for drug manufacturing, and in the food processing industry for preservation and flavor enhancement.
Yes, trends include a heightened focus on sustainable agricultural practices, the adoption of inorganic salts in water treatment solutions, and innovations in pharmaceutical formulations.
Local manufacturers contend with intense competition, fluctuating raw material prices, and infrastructural challenges that can hinder effective distribution and market penetration.
6Wresearch actively monitors the Ghana Inorganic salts Market and publishes its comprehensive annual report, highlighting emerging trends, growth drivers, revenue analysis, and forecast outlook. Our insights help businesses to make data-backed strategic decisions with ongoing market dynamics. Our analysts track relevent industries related to the Ghana Inorganic salts Market, allowing our clients with actionable intelligence and reliable forecasts tailored to emerging regional needs.
Yes, we provide customisation as per your requirements. To learn more, feel free to contact us on sales@6wresearch.com
1 Executive Summary |
2 Introduction |
2.1 Key Highlights of the Report |
2.2 Report Description |
2.3 Market Scope & Segmentation |
2.4 Research Methodology |
2.5 Assumptions |
3 Ghana Inorganic salts Market Overview |
3.1 Ghana Country Macro Economic Indicators |
3.2 Ghana Inorganic salts Market Revenues & Volume, 2022 & 2032F |
3.3 Ghana Inorganic salts Market - Industry Life Cycle |
3.4 Ghana Inorganic salts Market - Porter's Five Forces |
3.5 Ghana Inorganic salts Market Revenues & Volume Share, By Application, 2022 & 2032F |
4 Ghana Inorganic salts Market Dynamics |
4.1 Impact Analysis |
4.2 Market Drivers |
4.2.1 Increasing demand for inorganic salts in various industries such as agriculture, pharmaceuticals, and water treatment. |
4.2.2 Growing population and urbanization leading to higher consumption of inorganic salts. |
4.2.3 Government initiatives and investments in infrastructure projects driving the demand for inorganic salts. |
4.3 Market Restraints |
4.3.1 Fluctuating prices of raw materials impacting the production cost of inorganic salts. |
4.3.2 Stringent regulations and environmental concerns regarding the use of certain inorganic salts. |
4.3.3 Competition from alternative products or substitutes affecting the market growth. |
5 Ghana Inorganic salts Market Trends |
6 Ghana Inorganic salts Market, By Types |
6.1 Ghana Inorganic salts Market, By Application |
6.1.1 Overview and Analysis |
6.1.2 Ghana Inorganic salts Market Revenues & Volume, By Application, 2022-2032F |
6.1.3 Ghana Inorganic salts Market Revenues & Volume, By Chemicals, 2022-2032F |
6.1.4 Ghana Inorganic salts Market Revenues & Volume, By Food Industry, 2022-2032F |
6.1.5 Ghana Inorganic salts Market Revenues & Volume, By Pharmaceuticals and Personal Care, 2022-2032F |
6.1.6 Ghana Inorganic salts Market Revenues & Volume, By Agriculture, 2022-2032F |
6.1.7 Ghana Inorganic salts Market Revenues & Volume, By Others, 2022-2032F |
7 Ghana Inorganic salts Market Import-Export Trade Statistics |
7.1 Ghana Inorganic salts Market Export to Major Countries |
7.2 Ghana Inorganic salts Market Imports from Major Countries |
8 Ghana Inorganic salts Market Key Performance Indicators |
8.1 Manufacturing capacity utilization rate: Indicates the efficiency of production and potential for market expansion. |
8.2 Export/import volume of inorganic salts: Reflects the international demand and competitiveness of the market. |
8.3 Research and development investment: Shows the focus on innovation and product development to meet market needs. |
8.4 Customer satisfaction index: Measures the acceptance and perception of inorganic salts in the market. |
8.5 Environmental sustainability metrics: Tracks the efforts towards eco-friendly production methods and compliance with regulations. |
9 Ghana Inorganic salts Market - Opportunity Assessment |
9.1 Ghana Inorganic salts Market Opportunity Assessment, By Application, 2022 & 2032F |
10 Ghana Inorganic salts Market - Competitive Landscape |
10.1 Ghana Inorganic salts Market Revenue Share, By Companies, 2025 |
10.2 Ghana Inorganic salts Market Competitive Benchmarking, By Operating and Technical Parameters |
11 Company Profiles |
12 Recommendations |
13 Disclaimer |
Global Go To Market Strategy - 2030
Export potential enables firms to identify high-growth global markets with greater confidence by combining advanced trade intelligence with a structured quantitative methodology. The framework analyzes emerging demand trends and country-level import patterns while integrating macroeconomic and trade datasets such as GDP and population forecasts, bilateral import–export flows, tariff structures, elasticity differentials between developed and developing economies, geographic distance, and import demand projections. Using weighted trade values from 2020–2024 as the base period to project country-to-country export potential for 2030, these inputs are operationalized through calculated drivers such as gravity model parameters, tariff impact factors, and projected GDP per-capita growth. Through an analysis of hidden potentials, demand hotspots, and market conditions that are most favorable to success, this method enables firms to focus on target countries, maximize returns, and global expansion with data, backed by accuracy.
By factoring in the projected importer demand gap that is currently unmet and could be potential opportunity, it identifies the potential for the Exporter (Country) among 190 countries, against the general trade analysis, which identifies the biggest importer or exporter.
To discover high-growth global markets and optimize your business strategy:
Click Here
Pricing
- Single User License$ 1,995
- Department License$ 2,400
- Site License$ 3,120
- Global License$ 3,795

Leadership Perspectives from Industry Events
Search
Thought Leadership and Analyst Meet


Our Clients
6WResearch In News
- India Air Conditioner Market Set for Strong Rebound in 2026 After Weather-Led Correction and GST-Driven Recovery: 6Wresearch
- ADAS in India: How Automatic Emergency Braking, Blind Spot Detection & Driver Monitoring are Transforming Road Safety
- Doha a strategic location for EV manufacturing hub: IPA Qatar
- Demand for luxury TVs surging in the GCC, says Samsung
- Empowering Growth: The Thriving Journey of Bangladesh’s Cable Industry
- Demand for luxury TVs surging in the GCC, says Samsung
Latest Reports
- Nicaragua RPG Gaming Market (2026-2032)
- New Zealand RPG Gaming Market (2026-2032)
- Netherlands RPG Gaming Market (2026-2032)
- Nauru RPG Gaming Market (2026-2032)
- Namibia RPG Gaming Market (2026-2032)
- Mozambique RPG Gaming Market (2026-2032)
- Montenegro RPG Gaming Market (2026-2032)
- Mongolia RPG Gaming Market (2026-2032)
- Monaco RPG Gaming Market (2026-2032)
- Micronesia RPG Gaming Market (2026-2032)
Industry Events and Analyst Meet

EV India Expo 2026

HIMTEX 2026

India Refining Summit 2026

India EV Show 2026

EV tech India Expo 2026
Whitepaper
- Middle East & Africa Commercial Security Market Click here to view more.
- Middle East & Africa Fire Safety Systems & Equipment Market Click here to view more.
- GCC Drone Market Click here to view more.
- Middle East Lighting Fixture Market Click here to view more.
- GCC Physical & Perimeter Security Market Click here to view more.