Ghana Pantothenic Acid Market (2026-2032) Outlook | Share, Revenue, Trends, Value, Size, Growth, Companies, Analysis, Industry & Forecast
Market Forecast By Form (Powder, Tablets), By End Use (Pharmaceuticals, Nutritional &dietary Supplements, Animal Health & Nutrition, Infant Food & Supplements, Food & Beverages), By Source (Plants, Animals, Dairy Products), By Nature (Organic And , Inorganic) And Competitive Landscape
| Product Code: ETC337136 | Publication Date: Aug 2022 | Updated Date: Jul 2026 | Product Type: Market Research Report | |
| Publisher: 6Wresearch | Author: Ravi Bhandari | No. of Pages: 75 | No. of Figures: 35 | No. of Tables: 20 |
Ghana Pantothenic Acid Market Size, Share & Growth Rate
The Ghana Pantothenic Acid Market was estimated at USD 1490 Million in 2025 and is projected to reach USD 2124 Million by 2032, growing at a CAGR of 5.2% from 2026 to 2032. This growth trajectory is primarily fueled by heightened consumer awareness regarding the health benefits of pantothenic acid, particularly its essential role in energy metabolism and skin health. As Ghanaians increasingly prioritize wellness and preventative healthcare measures, the demand for both dietary supplements and skincare products enriched with pantothenic acid is set to rise significantly.
Ghana Pantothenic Acid Market Year-wise Growth Rate and Key Drivers
This graph highlights how the Ghana Pantothenic Acid Market has steadily grown over the years, supported by major growth factors.
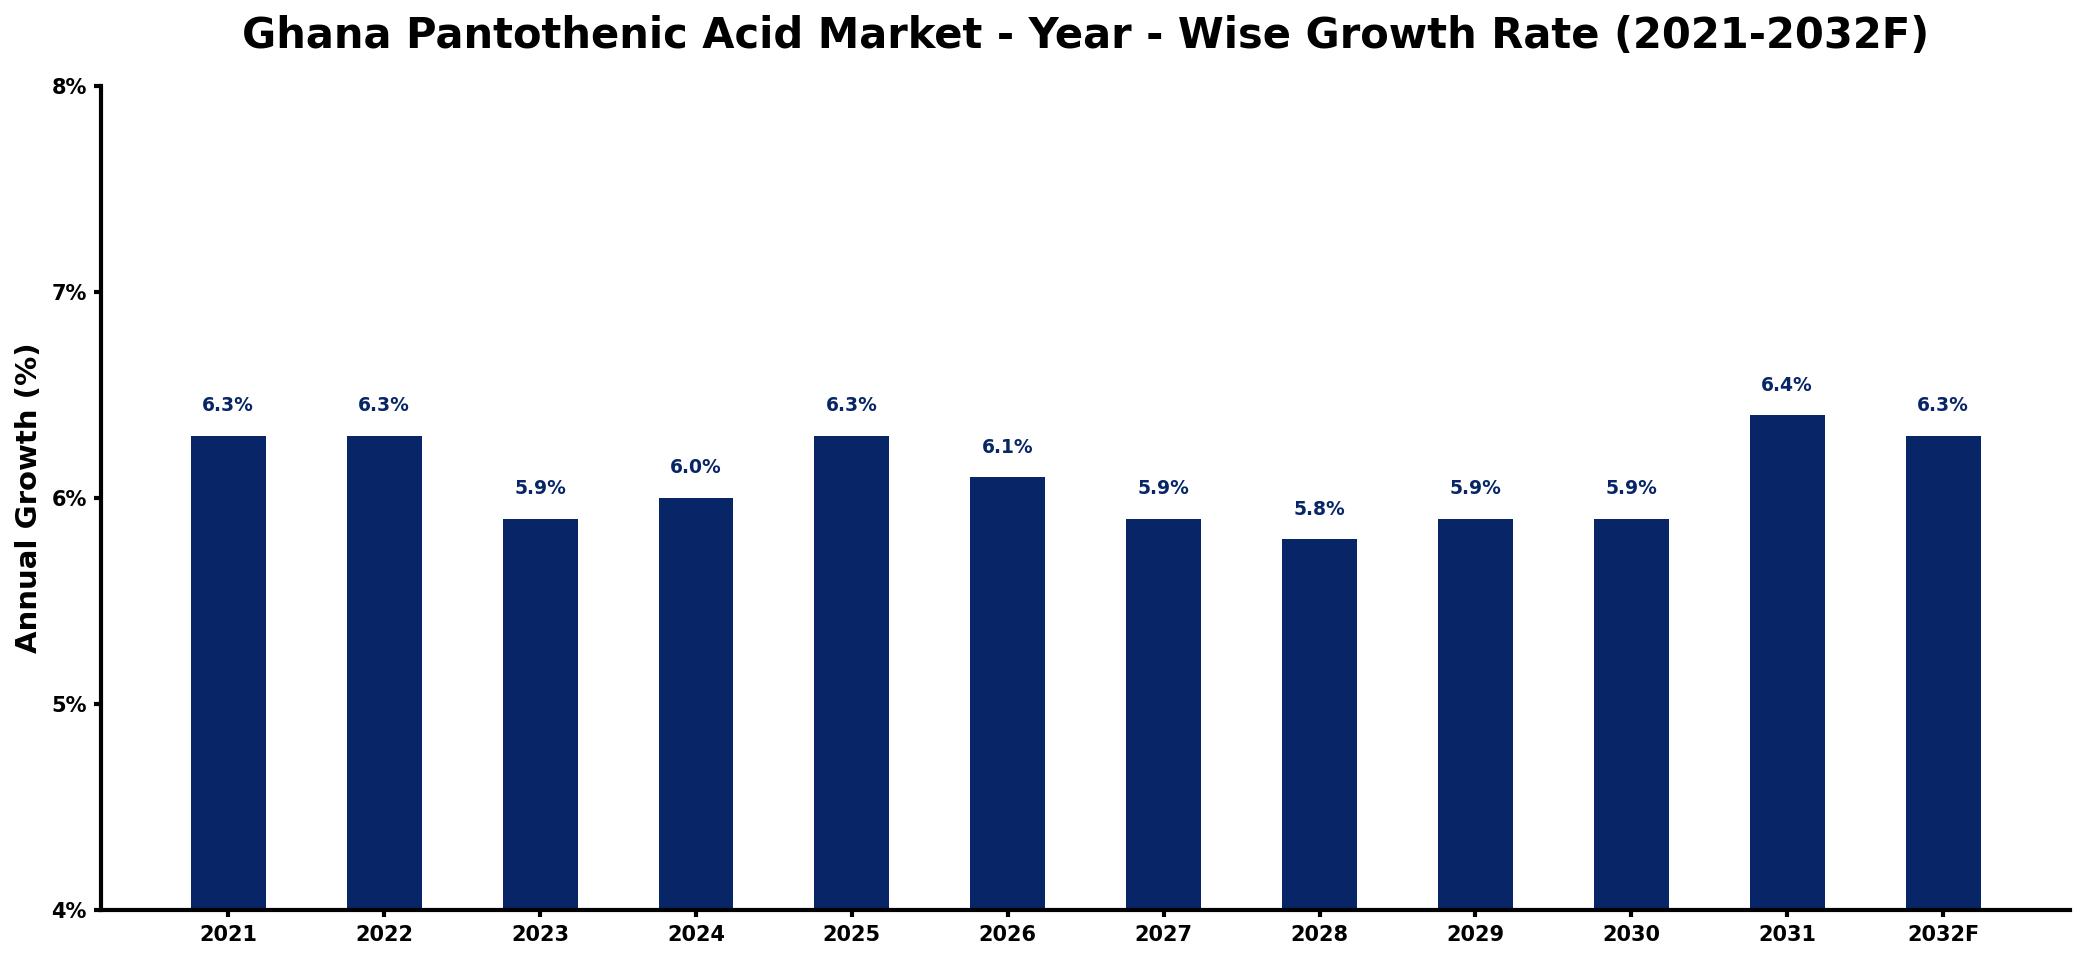
The table below presents the year‑wise growth rates along with the key drivers influencing the market
| Year | Growth Rate | Major Drivers |
| 2021 | 6.3% | Rising health awareness among consumers |
| 2022 | 6.3% | Increased dietary supplement consumption |
| 2023 | 5.9% | Growing demand for functional foods |
| 2024 | 6.0% | Expansion of wellness industry offerings |
| 2025 | 6.3% | Surge in preventive healthcare initiatives |
| 2026 | 6.1% | Investment in health research projects |
| 2027 | 5.9% | Wider availability in retail channels |
| 2028 | 5.8% | Emergence of new product formulations |
| 2029 | 5.9% | Focus on holistic health solutions |
| 2030 | 5.9% | Collaboration among industry stakeholders |
| 2031 | 6.4% | Increased exports to regional markets |
| 2032 | 6.3% | Enhanced consumer education programs |
Note: Market size estimations and growth projections presented in this report are based on 6Wresearch's proprietary forecasting methodology, utilizing the latest available industry data, government publications, and primary research inputs.
Ghana Pantothenic Acid Market Synopsis
The most influential force in the Ghana Pantothenic Acid market today is the growing emphasis on health and wellness. As consumers become more health-conscious, they are actively seeking supplements and fortified foods that can support their well-being and address specific health concerns.
Additionally, the burgeoning interest in natural and effective skincare solutions has led to an increase in beauty products containing pantothenic acid. This vitamin's moisturizing and skin-repairing properties resonate well with the local population, thus driving market demand.
Ghana Pantothenic Acid Market Key Takeaways
- The market is witnessing substantial growth driven by rising health consciousness among consumers.
- Increased demand for pantothenic acid in skincare formulations is shaping product innovation.
- Investment opportunities exist due to the trend toward natural and organic supplements.
- Regulatory frameworks are evolving to ensure product quality and safety.
- Collaborations with local manufacturers can enhance competitiveness in the market.
Evaluation of Restraints in Ghana Pantothenic Acid Market
Despite the promising growth potential, the Ghana Pantothenic Acid market faces several constraints. A significant challenge is the limited awareness of pantothenic acid's benefits among a portion of the consumer base, which translates to lower product demand. Furthermore, sourcing high-quality pantothenic acid can be problematic, affecting both product integrity and pricing strategies. Regulatory hurdles, including import restrictions and tariffs, also impede market expansion, and economic fluctuations may further complicate the landscape for businesses operating within this sector.
Ghana Pantothenic Acid Market Trends
Several current trends are shaping the Ghana Pantothenic Acid market. Consumers are increasingly opting for dietary supplements that promote skin health, recognizing the vitamin's anti-inflammatory and moisturizing properties. Additionally, there is a noticeable shift towards innovative product forms, such as topical creams and capsules, which cater to diverse consumer preferences. The market is also witnessing a broader trend of incorporating pantothenic acid into beauty and wellness routines as individuals seek holistic health solutions.
Ghana Pantothenic Acid Market Opportunities
The Ghana Pantothenic Acid market presents numerous investment opportunities, especially for companies involved in the production and distribution of dietary supplements and skincare products. With the rising disposable income levels and an increasing emphasis on preventive healthcare, there is significant scope for growth. Furthermore, by aligning with local agricultural producers, companies can enhance the sustainability and attractiveness of their offerings, ultimately driving market expansion.
Government Initiatives in the Ghana Pantothenic Acid Market
Government initiatives play a crucial role in shaping the Ghana Pantothenic Acid market landscape. The Ghana Food and Drugs Authority (FDA) regulates the registration and approval of pantothenic acid products to ensure compliance with safety and quality standards. Furthermore, the government promotes local manufacturing through favorable policies, ensuring that imported products meet stringent labeling and quality criteria. These measures aim to foster a safer marketplace for consumers while supporting local industry growth.
Future Insights of the Ghana Pantothenic Acid Market
Looking ahead to 2026-2032, the Ghana Pantothenic Acid market is expected to flourish, driven by sustained consumer education on the nutrient's health benefits. The surge in preventive healthcare trends, combined with growing disposable incomes, is likely to further stimulate demand for pantothenic acid in supplements and fortified foods. As the market matures, companies that innovate and adapt to consumer preferences will find ample opportunities to capture market share and enhance profitability.
Ghana Pantothenic Acid Market Latest Developments (2025 - 2026)
Recent developments within the Ghana Pantothenic Acid market indicate a shift towards more sustainable sourcing practices and enhanced product formulations. Companies are increasingly focusing on integrating pantothenic acid into multifunctional skincare products, addressing a wider range of consumer needs. Moreover, collaboration between local manufacturers and international suppliers is on the rise, aiming to optimize production processes while adhering to strict regulatory standards.
Ghana Pantothenic Acid Market - Key Attractiveness of the Report
- 10 Years of Market Numbers
- Historical Data Starting from 2022 to 2025
- Base Year: 2025
- Forecast Data until 2032
- Key Performance Indicators Impacting the Market
- Major Upcoming Developments and Projects
Key Highlights of the Report:
- Ghana Pantothenic Acid Market Outlook
- Market Size of Ghana Pantothenic Acid Market, 2025
- Forecast of Ghana Pantothenic Acid Market, 2032
- Historical Data and Forecast of Ghana Pantothenic Acid Revenues & Volume for the Period 2022-2032F
- Ghana Pantothenic Acid Market Trend Evolution
- Ghana Pantothenic Acid Market Drivers and Challenges
- Ghana Pantothenic Acid Price Trends
- Ghana Pantothenic Acid Porter's Five Forces
- Ghana Pantothenic Acid Industry Life Cycle
- Historical Data and Forecast of Ghana Pantothenic Acid Market Revenues & Volume By Form for the Period 2022-2032F
- Historical Data and Forecast of Ghana Pantothenic Acid Market Revenues & Volume By Powder for the Period 2022-2032F
- Historical Data and Forecast of Ghana Pantothenic Acid Market Revenues & Volume By Tablets for the Period 2022-2032F
- Historical Data and Forecast of Ghana Pantothenic Acid Market Revenues & Volume By End Use for the Period 2022-2032F
- Historical Data and Forecast of Ghana Pantothenic Acid Market Revenues & Volume By Pharmaceuticals for the Period 2022-2032F
- Historical Data and Forecast of Ghana Pantothenic Acid Market Revenues & Volume By Nutritional &dietary Supplements for the Period 2022-2032F
- Historical Data and Forecast of Ghana Pantothenic Acid Market Revenues & Volume By Animal Health & Nutrition for the Period 2022-2032F
- Historical Data and Forecast of Ghana Pantothenic Acid Market Revenues & Volume By Infant Food & Supplements for the Period 2022-2032F
- Historical Data and Forecast of Ghana Pantothenic Acid Market Revenues & Volume By Food & Beverages for the Period 2022-2032F
- Historical Data and Forecast of Ghana Pantothenic Acid Market Revenues & Volume By Source for the Period 2022-2032F
- Historical Data and Forecast of Ghana Pantothenic Acid Market Revenues & Volume By Plants for the Period 2022-2032F
- Historical Data and Forecast of Ghana Pantothenic Acid Market Revenues & Volume By Animals for the Period 2022-2032F
- Historical Data and Forecast of Ghana Pantothenic Acid Market Revenues & Volume By Dairy Products for the Period 2022-2032F
- Historical Data and Forecast of Ghana Pantothenic Acid Market Revenues & Volume By Nature for the Period 2022-2032F
- Historical Data and Forecast of Ghana Pantothenic Acid Market Revenues & Volume By Organic And for the Period 2022-2032F
- Historical Data and Forecast of Ghana Pantothenic Acid Market Revenues & Volume By Inorganic for the Period 2022-2032F
- Ghana Pantothenic Acid Import Export Trade Statistics
- Market Opportunity Assessment By Form
- Market Opportunity Assessment By End Use
- Market Opportunity Assessment By Source
- Market Opportunity Assessment By Nature
- Ghana Pantothenic Acid Top Companies Market Share
- Ghana Pantothenic Acid Competitive Benchmarking By Technical and Operational Parameters
- Ghana Pantothenic Acid Company Profiles
- Ghana Pantothenic Acid Key Strategic Recommendations
Frequently Asked Questions About the Market Study (FAQs):
The market is primarily driven by increasing health consciousness among Ghanaians, the rising popularity of dietary supplements, and growing demand for skincare products that contain pantothenic acid due to its moisturizing properties.
The market outlook is promising, with expectations of steady growth fueled by increased consumer awareness of pantothenic acid's benefits and a shift toward preventive healthcare from 2026 to 2032.
The Ghana Pantothenic Acid Market was estimated at USD 1490 Million in 2025 and is projected to reach USD 2124 Million by 2032, growing at a CAGR of 5.2% from 2026 to 2032, indicating robust growth potential.
Demand is particularly high in the dietary supplements and skincare sectors, where pantothenic acid's health benefits and moisturizing properties are increasingly recognized by consumers.
Companies may face challenges related to consumer awareness, sourcing high-quality pantothenic acid, and navigating regulatory hurdles that can impede market access and product approval.
Regulatory policies are crucial as they govern product safety and quality. Compliance with regulations ensures consumer protection and fosters a competitive market environment for local manufacturers.
6Wresearch actively monitors the Ghana Pantothenic Acid Market and publishes its comprehensive annual report, highlighting emerging trends, growth drivers, revenue analysis, and forecast outlook. Our insights help businesses to make data-backed strategic decisions with ongoing market dynamics. Our analysts track relevent industries related to the Ghana Pantothenic Acid Market, allowing our clients with actionable intelligence and reliable forecasts tailored to emerging regional needs.
Yes, we provide customisation as per your requirements. To learn more, feel free to contact us on sales@6wresearch.com
1 Executive Summary |
2 Introduction |
2.1 Key Highlights of the Report |
2.2 Report Description |
2.3 Market Scope & Segmentation |
2.4 Research Methodology |
2.5 Assumptions |
3 Ghana Pantothenic Acid Market Overview |
3.1 Ghana Country Macro Economic Indicators |
3.2 Ghana Pantothenic Acid Market Revenues & Volume, 2022 & 2032F |
3.3 Ghana Pantothenic Acid Market - Industry Life Cycle |
3.4 Ghana Pantothenic Acid Market - Porter's Five Forces |
3.5 Ghana Pantothenic Acid Market Revenues & Volume Share, By Form, 2022 & 2032F |
3.6 Ghana Pantothenic Acid Market Revenues & Volume Share, By End Use, 2022 & 2032F |
3.7 Ghana Pantothenic Acid Market Revenues & Volume Share, By Source , 2022 & 2032F |
3.8 Ghana Pantothenic Acid Market Revenues & Volume Share, By Nature, 2022 & 2032F |
4 Ghana Pantothenic Acid Market Dynamics |
4.1 Impact Analysis |
4.2 Market Drivers |
4.2.1 Increasing awareness about the health benefits of pantothenic acid |
4.2.2 Growing demand for dietary supplements and fortified food products |
4.2.3 Expansion of pharmaceutical and cosmetic industries in Ghana |
4.3 Market Restraints |
4.3.1 Price fluctuations of raw materials used in pantothenic acid production |
4.3.2 Stringent regulations related to the use of pantothenic acid in certain products |
5 Ghana Pantothenic Acid Market Trends |
6 Ghana Pantothenic Acid Market, By Types |
6.1 Ghana Pantothenic Acid Market, By Form |
6.1.1 Overview and Analysis |
6.1.2 Ghana Pantothenic Acid Market Revenues & Volume, By Form, 2022-2032F |
6.1.3 Ghana Pantothenic Acid Market Revenues & Volume, By Powder, 2022-2032F |
6.1.4 Ghana Pantothenic Acid Market Revenues & Volume, By Tablets, 2022-2032F |
6.2 Ghana Pantothenic Acid Market, By End Use |
6.2.1 Overview and Analysis |
6.2.2 Ghana Pantothenic Acid Market Revenues & Volume, By Pharmaceuticals, 2022-2032F |
6.2.3 Ghana Pantothenic Acid Market Revenues & Volume, By Nutritional &dietary Supplements, 2022-2032F |
6.2.4 Ghana Pantothenic Acid Market Revenues & Volume, By Animal Health & Nutrition, 2022-2032F |
6.2.5 Ghana Pantothenic Acid Market Revenues & Volume, By Infant Food & Supplements, 2022-2032F |
6.2.6 Ghana Pantothenic Acid Market Revenues & Volume, By Food & Beverages, 2022-2032F |
6.3 Ghana Pantothenic Acid Market, By Source |
6.3.1 Overview and Analysis |
6.3.2 Ghana Pantothenic Acid Market Revenues & Volume, By Plants, 2022-2032F |
6.3.3 Ghana Pantothenic Acid Market Revenues & Volume, By Animals, 2022-2032F |
6.3.4 Ghana Pantothenic Acid Market Revenues & Volume, By Dairy Products, 2022-2032F |
6.4 Ghana Pantothenic Acid Market, By Nature |
6.4.1 Overview and Analysis |
6.4.2 Ghana Pantothenic Acid Market Revenues & Volume, By Organic And , 2022-2032F |
6.4.3 Ghana Pantothenic Acid Market Revenues & Volume, By Inorganic, 2022-2032F |
7 Ghana Pantothenic Acid Market Import-Export Trade Statistics |
7.1 Ghana Pantothenic Acid Market Export to Major Countries |
7.2 Ghana Pantothenic Acid Market Imports from Major Countries |
8 Ghana Pantothenic Acid Market Key Performance Indicators |
8.1 Percentage increase in the number of pantothenic acid-enriched products in the market |
8.2 Growth in the number of research studies on the efficacy of pantothenic acid |
8.3 Adoption rate of pantothenic acid supplementation among the Ghanaian population |
9 Ghana Pantothenic Acid Market - Opportunity Assessment |
9.1 Ghana Pantothenic Acid Market Opportunity Assessment, By Form, 2022 & 2032F |
9.2 Ghana Pantothenic Acid Market Opportunity Assessment, By End Use, 2022 & 2032F |
9.3 Ghana Pantothenic Acid Market Opportunity Assessment, By Source , 2022 & 2032F |
9.4 Ghana Pantothenic Acid Market Opportunity Assessment, By Nature, 2022 & 2032F |
10 Ghana Pantothenic Acid Market - Competitive Landscape |
10.1 Ghana Pantothenic Acid Market Revenue Share, By Companies, 2025 |
10.2 Ghana Pantothenic Acid Market Competitive Benchmarking, By Operating and Technical Parameters |
11 Company Profiles |
12 Recommendations |
13 Disclaimer |
Global Go To Market Strategy - 2030
Export potential enables firms to identify high-growth global markets with greater confidence by combining advanced trade intelligence with a structured quantitative methodology. The framework analyzes emerging demand trends and country-level import patterns while integrating macroeconomic and trade datasets such as GDP and population forecasts, bilateral import–export flows, tariff structures, elasticity differentials between developed and developing economies, geographic distance, and import demand projections. Using weighted trade values from 2020–2024 as the base period to project country-to-country export potential for 2030, these inputs are operationalized through calculated drivers such as gravity model parameters, tariff impact factors, and projected GDP per-capita growth. Through an analysis of hidden potentials, demand hotspots, and market conditions that are most favorable to success, this method enables firms to focus on target countries, maximize returns, and global expansion with data, backed by accuracy.
By factoring in the projected importer demand gap that is currently unmet and could be potential opportunity, it identifies the potential for the Exporter (Country) among 190 countries, against the general trade analysis, which identifies the biggest importer or exporter.
To discover high-growth global markets and optimize your business strategy:
Click Here
Pricing
- Single User License$ 1,995
- Department License$ 2,400
- Site License$ 3,120
- Global License$ 3,795

Leadership Perspectives from Industry Events
Search
Thought Leadership and Analyst Meet


Our Clients
6WResearch In News
- India Air Conditioner Market Set for Strong Rebound in 2026 After Weather-Led Correction and GST-Driven Recovery: 6Wresearch
- ADAS in India: How Automatic Emergency Braking, Blind Spot Detection & Driver Monitoring are Transforming Road Safety
- Doha a strategic location for EV manufacturing hub: IPA Qatar
- Demand for luxury TVs surging in the GCC, says Samsung
- Empowering Growth: The Thriving Journey of Bangladesh’s Cable Industry
- Demand for luxury TVs surging in the GCC, says Samsung
Latest Reports
- Nicaragua RPG Gaming Market (2026-2032)
- New Zealand RPG Gaming Market (2026-2032)
- Netherlands RPG Gaming Market (2026-2032)
- Nauru RPG Gaming Market (2026-2032)
- Namibia RPG Gaming Market (2026-2032)
- Mozambique RPG Gaming Market (2026-2032)
- Montenegro RPG Gaming Market (2026-2032)
- Mongolia RPG Gaming Market (2026-2032)
- Monaco RPG Gaming Market (2026-2032)
- Micronesia RPG Gaming Market (2026-2032)
Industry Events and Analyst Meet

EV India Expo 2026

HIMTEX 2026

India Refining Summit 2026

India EV Show 2026

EV tech India Expo 2026
Whitepaper
- Middle East & Africa Commercial Security Market Click here to view more.
- Middle East & Africa Fire Safety Systems & Equipment Market Click here to view more.
- GCC Drone Market Click here to view more.
- Middle East Lighting Fixture Market Click here to view more.
- GCC Physical & Perimeter Security Market Click here to view more.