Ghana Phosphoric Acid Market (2026-2032) Outlook | Share, Size, Trends, Analysis, Growth, Value, Companies, Forecast, Industry, Revenue
Market Forecast By Process Type (Wet Process, Thermal Process, Others), By Application (Home Cleaning Agents, Fertilizer Chemicals), By Fertilizer Type (Mono-Ammonium Phosphate (MAP), Diammonium Phosphate (DAP), Triple Superphosphate (TSP)), By End-Users (Electronics, Beverage, Medical, Food, Fertilizer, Others), By Grade (Food-Grade, Technical Grade) And Competitive Landscape
| Product Code: ETC129523 | Publication Date: Jun 2021 | Updated Date: Jun 2026 | Product Type: Report | |
| Publisher: 6Wresearch | Author: Shubham Padhi | No. of Pages: 70 | No. of Figures: 35 | No. of Tables: 5 |
Ghana Phosphoric Acid Market Size, Share & Growth Rate
The Ghana Phosphoric Acid Market was estimated at USD 411 Million in 2025 and is projected to reach USD 577 Million by 2032, growing at a CAGR of 5.0% from 2026 to 2032. This positive trajectory is primarily driven by the escalating demand from the agriculture sector, where phosphoric acid is utilized as a key ingredient in fertilizers. Furthermore, the expanding food and beverage industry and increasing awareness about sustainable agricultural practices are propelling this growth, creating a robust market landscape.
Ghana Phosphoric Acid Market Year-wise Growth Rate and Key Drivers
This graph highlights how the Ghana Phosphoric Acid Market has steadily grown over the years, supported by major growth factors.
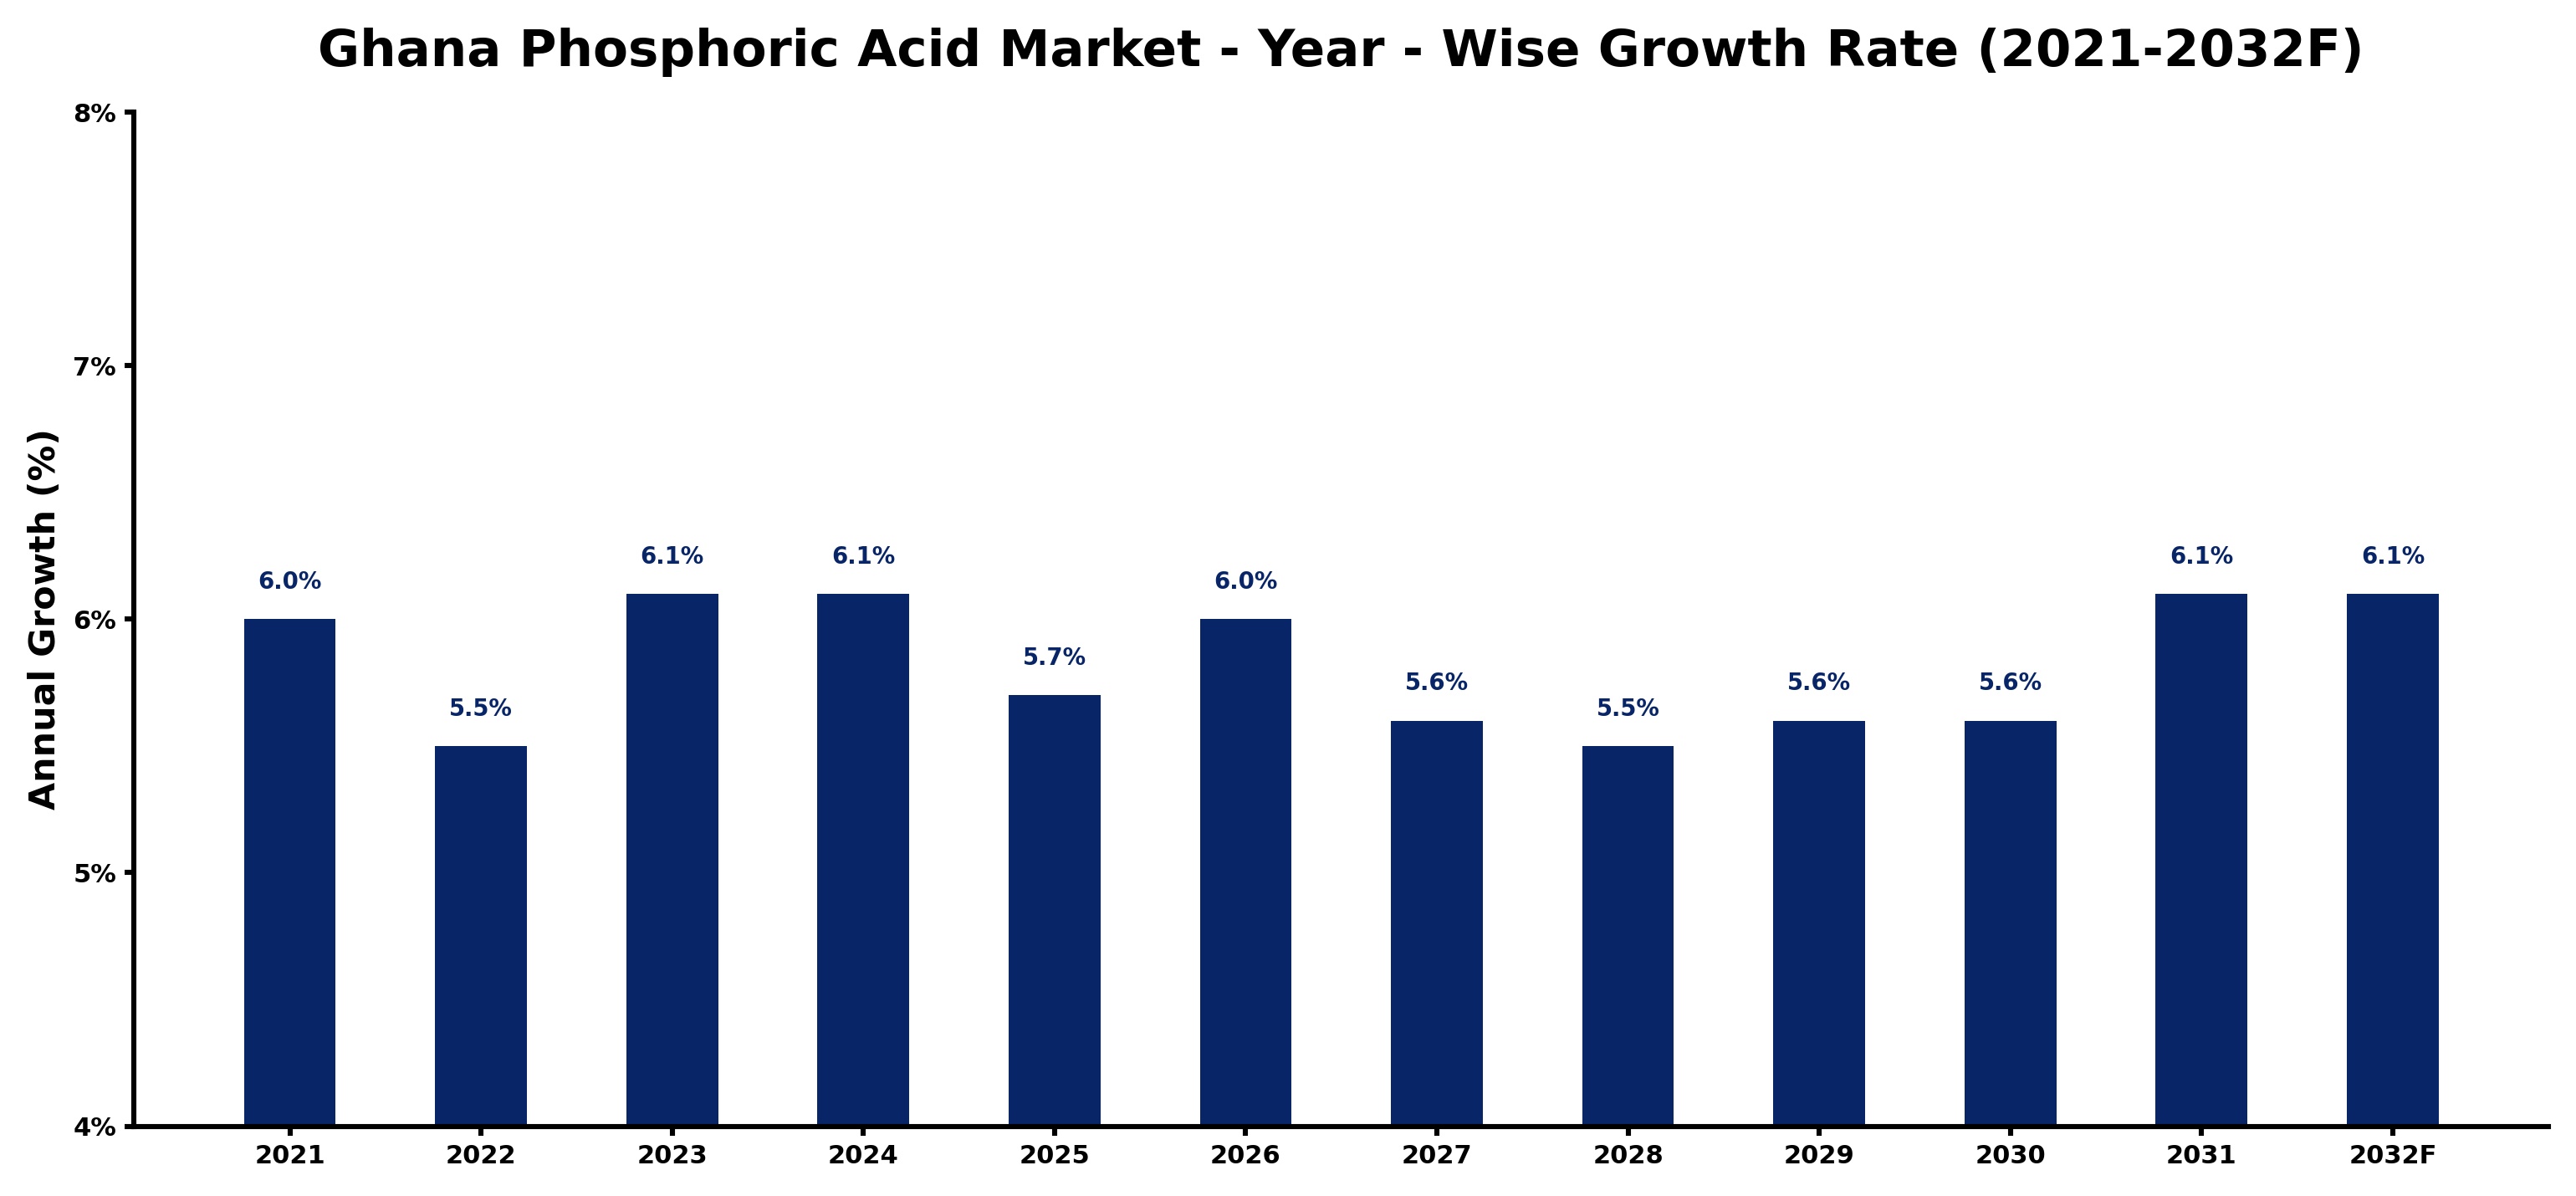
The table below presents the year‑wise growth rates along with the key drivers influencing the market
| Year | Growth Rate | Major Drivers |
| 2021 | 6.0% | Increasing industrial automation investments |
| 2022 | 5.5% | Expansion of transportation and logistics networks |
| 2023 | 6.1% | Expansion of commercial construction activities |
| 2024 | 6.1% | Growing renewable energy integration projects |
| 2025 | 5.7% | Increasing smart city development projects |
| 2026 | 6.0% | Government infrastructure modernization initiatives |
| 2027 | 5.6% | Rapid growth in telecom and data center sectors |
| 2028 | 5.5% | Increasing industrial infrastructure investments |
| 2029 | 5.6% | Government infrastructure modernization initiatives |
| 2030 | 5.6% | Expansion of manufacturing activities |
| 2031 | 6.1% | Expansion of transportation and logistics networks |
| 2032 | 6.1% | Increasing industrial infrastructure investments |
Note - Market size estimations and growth projections presented in this report are based on 6Wresearch’s advanced forecasting approach, validated with industry datasets as of June 2026.
Ghana Phosphoric Acid Market Synopsis
A significant force currently shaping the Ghana Phosphoric Acid Market is the agricultural sector's increasing emphasis on balanced fertilization. As farmers become more aware of phosphoric acid's vital role in enhancing crop quality and yields, the market is witnessing an uptick in demand. Additionally, the food and beverage industry's growth is further augmenting this demand, particularly for food additives.
Moreover, the pharmaceutical sector is beginning to recognize the potential applications of phosphoric acid in medicines and dietary supplements. As the market matures, strategic innovations and partnerships among stakeholders are becoming more prevalent, indicating a dynamic environment ripe for expansion.
Ghana Phosphoric Acid Market Key Takeaways
- The market is anticipated to experience robust growth, driven by the agricultural and food processing sectors.
- Increased awareness among farmers about sustainable practices is enhancing demand for phosphoric acid-based fertilizers.
- Investment in local production capabilities is essential to reduce dependence on imports and enhance market stability.
- Government policies are facilitating growth through incentives and infrastructure development.
- The expanding pharmaceutical sector is opening new avenues for phosphoric acid applications.
Evaluation of Restraints in Ghana Phosphoric Acid Market
The Ghana Phosphoric Acid Market faces several limitations that could hinder its growth trajectory. A primary concern is the limited local production capacity, which necessitates a heavy reliance on imports to satisfy the rising demand. This dependency not only exposes the market to global price fluctuations but also presents risks linked to trade restrictions and potential supply chain disruptions. Furthermore, competition from other phosphate-rich regions on the continent presents challenges for Ghana's pricing and market share, underscoring the need for strategic solutions to bolster local production and enhance competitiveness.
Ghana Phosphoric Acid Market Trends
Current trends indicate a growing focus on product innovation as companies strive to meet diverse industry requirements. Additionally, there is a noticeable shift towards sustainable practices, as agricultural stakeholders increasingly recognize the role of phosphoric acid in promoting long-term soil health and crop productivity. Enhanced regulatory frameworks are likely to guide these trends, ensuring that environmental considerations are prioritized as the market evolves.
Ghana Phosphoric Acid Market Opportunities
The market is ripe with investment opportunities, particularly given Ghana's rich phosphate reserves. By fostering local production capabilities, stakeholders can capitalize on the increasing domestic and regional demand for phosphoric acid. Partnerships with existing market players could provide the necessary support for investors looking to establish a foothold in this promising sector. Moreover, government initiatives aimed at boosting the mining sector and promoting industrialization further enhance the appeal of investments in phosphoric acid production.
Government Initiatives in the Ghana Phosphoric Acid Market
The Ghanaian government has enacted various policies to promote sustainable mining practices while enhancing production capacity within the phosphoric acid market. Incentives for foreign investment are encouraging partnerships between local and international companies, thus boosting production capabilities. Additionally, the government's focus on improving infrastructure and capacity building within the mining sector is set to contribute significantly to the stability and growth of the phosphoric acid industry.
Future Insights of the Ghana Phosphoric Acid Market
Looking ahead to the years 2026-2032, the Ghana Phosphoric Acid Market is anticipated to continue its upward trajectory, fueled by the burgeoning agriculture and food processing sectors. The increasing emphasis on agro-processing and the realization of phosphoric acid’s benefits in enhancing agricultural productivity will likely drive demand further. However, it is essential for stakeholders to remain proactive in addressing competitive pricing pressures and environmental concerns, which are pivotal for sustainable growth in the market.
Ghana Phosphoric Acid Market Latest Developments (May 2025 - June 2026)
Recent developments in the Ghana Phosphoric Acid Market indicate a noticeable shift towards strengthening local production capabilities. Stakeholders are actively exploring partnerships and collaborations aimed at enhancing production efficiency and reducing import dependency. The government continues to implement policies that promote sustainable practices, providing a conducive environment for further investments in the sector. Additionally, emerging trends in agro-processing are encouraging the integration of phosphoric acid in innovative agricultural solutions.
Ghana Phosphoric Acid Market - Key Attractiveness of the Report
- 10 Years of Market Numbers
- Historical Data Starting from 2022 to 2025
- Base Year: 2025
- Forecast Data until 2032
- Key Performance Indicators Impacting the Market
- Major Upcoming Developments and Projects
Key Highlights of the Report:
- Ghana Phosphoric Acid Market Outlook
- Market Size of Ghana Phosphoric Acid Market, 2025
- Forecast of Ghana Phosphoric Acid Market, 2032
- Historical Data and Forecast of Ghana Phosphoric Acid Revenues & Volume for the Period 2022-2032F
- Ghana Phosphoric Acid Market Trend Evolution
- Ghana Phosphoric Acid Market Drivers and Challenges
- Ghana Phosphoric Acid Price Trends
- Ghana Phosphoric Acid Porter's Five Forces
- Ghana Phosphoric Acid Industry Life Cycle
- Historical Data and Forecast of Ghana Phosphoric Acid Market Revenues & Volume By Process Type for the Period 2022-2032F
- Historical Data and Forecast of Ghana Phosphoric Acid Market Revenues & Volume By Wet Process for the Period 2022-2032F
- Historical Data and Forecast of Ghana Phosphoric Acid Market Revenues & Volume By Thermal Process for the Period 2022-2032F
- Historical Data and Forecast of Ghana Phosphoric Acid Market Revenues & Volume By Others for the Period 2022-2032F
- Historical Data and Forecast of Ghana Phosphoric Acid Market Revenues & Volume By Application for the Period 2022-2032F
- Historical Data and Forecast of Ghana Phosphoric Acid Market Revenues & Volume By Home Cleaning Agents for the Period 2022-2032F
- Historical Data and Forecast of Ghana Phosphoric Acid Market Revenues & Volume By Fertilizer Chemicals for the Period 2022-2032F
- Historical Data and Forecast of Ghana Phosphoric Acid Market Revenues & Volume By Fertilizer Type for the Period 2022-2032F
- Historical Data and Forecast of Ghana Phosphoric Acid Market Revenues & Volume By Mono-Ammonium Phosphate (MAP) for the Period 2022-2032F
- Historical Data and Forecast of Ghana Phosphoric Acid Market Revenues & Volume By Diammonium Phosphate (DAP) for the Period 2022-2032F
- Historical Data and Forecast of Ghana Phosphoric Acid Market Revenues & Volume By Triple Superphosphate (TSP) for the Period 2022-2032F
- Historical Data and Forecast of Ghana Phosphoric Acid Market Revenues & Volume By End-Users for the Period 2022-2032F
- Historical Data and Forecast of Ghana Phosphoric Acid Market Revenues & Volume By Electronics for the Period 2022-2032F
- Historical Data and Forecast of Ghana Phosphoric Acid Market Revenues & Volume By Beverage for the Period 2022-2032F
- Historical Data and Forecast of Ghana Phosphoric Acid Market Revenues & Volume By Medical for the Period 2022-2032F
- Historical Data and Forecast of Ghana Phosphoric Acid Market Revenues & Volume By Food for the Period 2022-2032F
- Historical Data and Forecast of Ghana Phosphoric Acid Market Revenues & Volume By Fertilizer for the Period 2022-2032F
- Historical Data and Forecast of Ghana Phosphoric Acid Market Revenues & Volume By Others for the Period 2022-2032F
- Historical Data and Forecast of Ghana Phosphoric Acid Market Revenues & Volume By Grade for the Period 2022-2032F
- Historical Data and Forecast of Ghana Phosphoric Acid Market Revenues & Volume By Food-Grade for the Period 2022-2032F
- Historical Data and Forecast of Ghana Phosphoric Acid Market Revenues & Volume By Technical Grade for the Period 2022-2032F
- Ghana Phosphoric Acid Import Export Trade Statistics
- Market Opportunity Assessment By Process Type
- Market Opportunity Assessment By Application
- Market Opportunity Assessment By Fertilizer Type
- Market Opportunity Assessment By End-Users
- Market Opportunity Assessment By Grade
- Ghana Phosphoric Acid Top Companies Market Share
- Ghana Phosphoric Acid Competitive Benchmarking By Technical and Operational Parameters
- Ghana Phosphoric Acid Company Profiles
- Ghana Phosphoric Acid Key Strategic Recommendations
Ghana Phosphoric Acid Market - Frequently Asked Questions
The Ghana Phosphoric Acid Market is expected to grow from USD 411 Million in 2025 to USD 577 Million by 2032, which reflects a CAGR of 5.0% from 2026 to 2032.
The agricultural sector is crucial, as phosphoric acid is a primary component in fertilizers, enhancing both crop yield and quality. Farmers' increasing awareness of sustainable practices is further fueling this demand.
Government policies that promote sustainable mining and incentivize foreign investment play a significant role. These initiatives help to boost production capabilities and improve market stability.
The market is constrained by limited local production capacity and heavy reliance on imports, which exposes it to global price fluctuations and competition from other phosphate-rich regions.
With significant phosphate reserves, there are substantial investment opportunities in local production capabilities. Partnerships with existing players can enhance market entry for investors looking to capitalize on growing demand.
6Wresearch actively monitors the Ghana Phosphoric Acid Market and publishes its comprehensive annual report, highlighting emerging trends, growth drivers, revenue analysis, and forecast outlook. Our insights help businesses to make data-backed strategic decisions with ongoing market dynamics. Our analysts track relevent industries related to the Ghana Phosphoric Acid Market, allowing our clients with actionable intelligence and reliable forecasts tailored to emerging regional needs.
Yes, we provide customisation as per your requirements. To learn more, feel free to contact us on sales@6wresearch.com
Ghana Phosphoric Acid |
1 Executive Summary |
2 Introduction |
2.1 Key Highlights of the Report |
2.2 Report Description |
2.3 Market Scope & Segmentation |
2.4 Research Methodology |
2.5 Assumptions |
3 Ghana Phosphoric Acid Market Overview |
3.1 Ghana Country Macro Economic Indicators |
3.2 Ghana Phosphoric Acid Market Revenues & Volume, 2022 & 2032F |
3.3 Ghana Phosphoric Acid Market - Industry Life Cycle |
3.4 Ghana Phosphoric Acid Market - Porter's Five Forces |
3.5 Ghana Phosphoric Acid Market Revenues & Volume Share, By Process Type, 2022 & 2032F |
3.6 Ghana Phosphoric Acid Market Revenues & Volume Share, By Form, 2022 & 2032F |
3.7 Ghana Phosphoric Acid Market Revenues & Volume Share, By Fertilizer Type, 2022 & 2032F |
3.8 Ghana Phosphoric Acid Market Revenues & Volume Share, By End-Users, 2022 & 2032F |
3.9 Ghana Phosphoric Acid Market Revenues & Volume Share, By Grade, 2022 & 2032F |
4 Ghana Phosphoric Acid Market Dynamics |
4.1 Impact Analysis |
4.2 Market Drivers |
4.3 Market Restraints |
5 Ghana Phosphoric Acid Market Trends |
6 Ghana Phosphoric Acid Market, By Types |
6.1 Ghana Phosphoric Acid Market, By Process Type |
6.1.1 Overview and Analysis |
6.1.2 Ghana Phosphoric Acid Market Revenues & Volume, By Process Type, 2022-2032F |
6.1.3 Ghana Phosphoric Acid Market Revenues & Volume, By Wet Process, 2022-2032F |
6.1.4 Ghana Phosphoric Acid Market Revenues & Volume, By Thermal Process, 2022-2032F |
6.1.5 Ghana Phosphoric Acid Market Revenues & Volume, By Others, 2022-2032F |
6.2 Ghana Phosphoric Acid Market, By Application |
6.2.1 Overview and Analysis |
6.2.2 Ghana Phosphoric Acid Market Revenues & Volume, By Home Cleaning Agents, 2022-2032F |
6.2.3 Ghana Phosphoric Acid Market Revenues & Volume, By Fertilizer Chemicals, 2022-2032F |
6.3 Ghana Phosphoric Acid Market, By Fertilizer Type |
6.3.1 Overview and Analysis |
6.3.2 Ghana Phosphoric Acid Market Revenues & Volume, By Mono-Ammonium Phosphate (MAP), 2022-2032F |
6.3.3 Ghana Phosphoric Acid Market Revenues & Volume, By Diammonium Phosphate (DAP), 2022-2032F |
6.3.4 Ghana Phosphoric Acid Market Revenues & Volume, By Triple Superphosphate (TSP), 2022-2032F |
6.4 Ghana Phosphoric Acid Market, By End-Users |
6.4.1 Overview and Analysis |
6.4.2 Ghana Phosphoric Acid Market Revenues & Volume, By Electronics, 2022-2032F |
6.4.3 Ghana Phosphoric Acid Market Revenues & Volume, By Beverage, 2022-2032F |
6.4.4 Ghana Phosphoric Acid Market Revenues & Volume, By Medical, 2022-2032F |
6.4.5 Ghana Phosphoric Acid Market Revenues & Volume, By Food, 2022-2032F |
6.4.6 Ghana Phosphoric Acid Market Revenues & Volume, By Fertilizer, 2022-2032F |
6.4.7 Ghana Phosphoric Acid Market Revenues & Volume, By Others, 2022-2032F |
6.5 Ghana Phosphoric Acid Market, By Grade |
6.5.1 Overview and Analysis |
6.5.2 Ghana Phosphoric Acid Market Revenues & Volume, By Food-Grade, 2022-2032F |
6.5.3 Ghana Phosphoric Acid Market Revenues & Volume, By Technical Grade, 2022-2032F |
7 Ghana Phosphoric Acid Market Import-Export Trade Statistics |
7.1 Ghana Phosphoric Acid Market Export to Major Countries |
7.2 Ghana Phosphoric Acid Market Imports from Major Countries |
8 Ghana Phosphoric Acid Market Key Performance Indicators |
9 Ghana Phosphoric Acid Market - Opportunity Assessment |
9.1 Ghana Phosphoric Acid Market Opportunity Assessment, By Process Type, 2022 & 2032F |
9.2 Ghana Phosphoric Acid Market Opportunity Assessment, By Application, 2022 & 2032F |
9.3 Ghana Phosphoric Acid Market Opportunity Assessment, By Fertilizer Type, 2022 & 2032F |
9.4 Ghana Phosphoric Acid Market Opportunity Assessment, By End-Users, 2022 & 2032F |
9.5 Ghana Phosphoric Acid Market Opportunity Assessment, By Grade, 2022 & 2032F |
10 Ghana Phosphoric Acid Market - Competitive Landscape |
10.1 Ghana Phosphoric Acid Market Revenue Share, By Companies, 2025 |
10.2 Ghana Phosphoric Acid Market Competitive Benchmarking, By Operating and Technical Parameters |
11 Company Profiles |
12 Recommendations |
13 Disclaimer |
Global Go To Market Strategy - 2030
Export potential enables firms to identify high-growth global markets with greater confidence by combining advanced trade intelligence with a structured quantitative methodology. The framework analyzes emerging demand trends and country-level import patterns while integrating macroeconomic and trade datasets such as GDP and population forecasts, bilateral import–export flows, tariff structures, elasticity differentials between developed and developing economies, geographic distance, and import demand projections. Using weighted trade values from 2020–2024 as the base period to project country-to-country export potential for 2030, these inputs are operationalized through calculated drivers such as gravity model parameters, tariff impact factors, and projected GDP per-capita growth. Through an analysis of hidden potentials, demand hotspots, and market conditions that are most favorable to success, this method enables firms to focus on target countries, maximize returns, and global expansion with data, backed by accuracy.
By factoring in the projected importer demand gap that is currently unmet and could be potential opportunity, it identifies the potential for the Exporter (Country) among 190 countries, against the general trade analysis, which identifies the biggest importer or exporter.
To discover high-growth global markets and optimize your business strategy:
Click Here
Pricing
- Single User License$ 1,995
- Department License$ 2,400
- Site License$ 3,120
- Global License$ 3,795

Leadership Perspectives from Industry Events
Search
Thought Leadership and Analyst Meet


Our Clients
6WResearch In News
- India Air Conditioner Market Set for Strong Rebound in 2026 After Weather-Led Correction and GST-Driven Recovery: 6Wresearch
- ADAS in India: How Automatic Emergency Braking, Blind Spot Detection & Driver Monitoring are Transforming Road Safety
- Doha a strategic location for EV manufacturing hub: IPA Qatar
- Demand for luxury TVs surging in the GCC, says Samsung
- Empowering Growth: The Thriving Journey of Bangladesh’s Cable Industry
- Demand for luxury TVs surging in the GCC, says Samsung
Latest Reports
- Nicaragua RPG Gaming Market (2026-2032)
- New Zealand RPG Gaming Market (2026-2032)
- Netherlands RPG Gaming Market (2026-2032)
- Nauru RPG Gaming Market (2026-2032)
- Namibia RPG Gaming Market (2026-2032)
- Mozambique RPG Gaming Market (2026-2032)
- Montenegro RPG Gaming Market (2026-2032)
- Mongolia RPG Gaming Market (2026-2032)
- Monaco RPG Gaming Market (2026-2032)
- Micronesia RPG Gaming Market (2026-2032)
Industry Events and Analyst Meet

EV India Expo 2026

HIMTEX 2026

India Refining Summit 2026

India EV Show 2026

EV tech India Expo 2026
Whitepaper
- Middle East & Africa Commercial Security Market Click here to view more.
- Middle East & Africa Fire Safety Systems & Equipment Market Click here to view more.
- GCC Drone Market Click here to view more.
- Middle East Lighting Fixture Market Click here to view more.
- GCC Physical & Perimeter Security Market Click here to view more.