Global Elevator And Escalator Market (2019-2025) | Value, Trends, Industry, Companies, Revenue, Growth, Forecast, Outlook, Share, Size & Analysis
Market Forecast By Types (Elevator (Passenger, Cargo, Home), Escalator (Moving Stairs, Moving Walks), By Applications (Commercial, Residential, Industrial), By Services (New Installations, Maintenance, Modernization), By Regions (Asia Pacific, Middle East, North America, Latin America, Europe, Africa) And Competitive Landscape.
| Product Code: ETC001512 | Publication Date: Apr 2022 | Product Type: Report | ||
| Publisher: 6Wresearch | Author: Ravi Bhandari | No. of Pages: 960 | No. of Figures: 930 | No. of Tables: 46 |
Latest 2022 Developments
Global Elevator and Escalator Market developments include the introduction of new cable technology, UltraRope, by KONE which allows the elevators to travel up to a kilometer without stopping, double the current distance. They also developed the world’s flattest auto walk technology, KONE InnoTrack autowalk, which is so flat that it can be installed entirely on the floor level. Schindler and Telefonica partnered in May 2019 for digital connectivity which is aimed to provide IoT connectivity for all smart elevators and escalators of Schindler.
Mergers and Acquisitions
- Thyssenkrupp sold its elevator technology business to a confederation led by Cinven, Advent, and RAG Foundation (Feb 2020)
- To enquire about latest release please click here
Previous Release
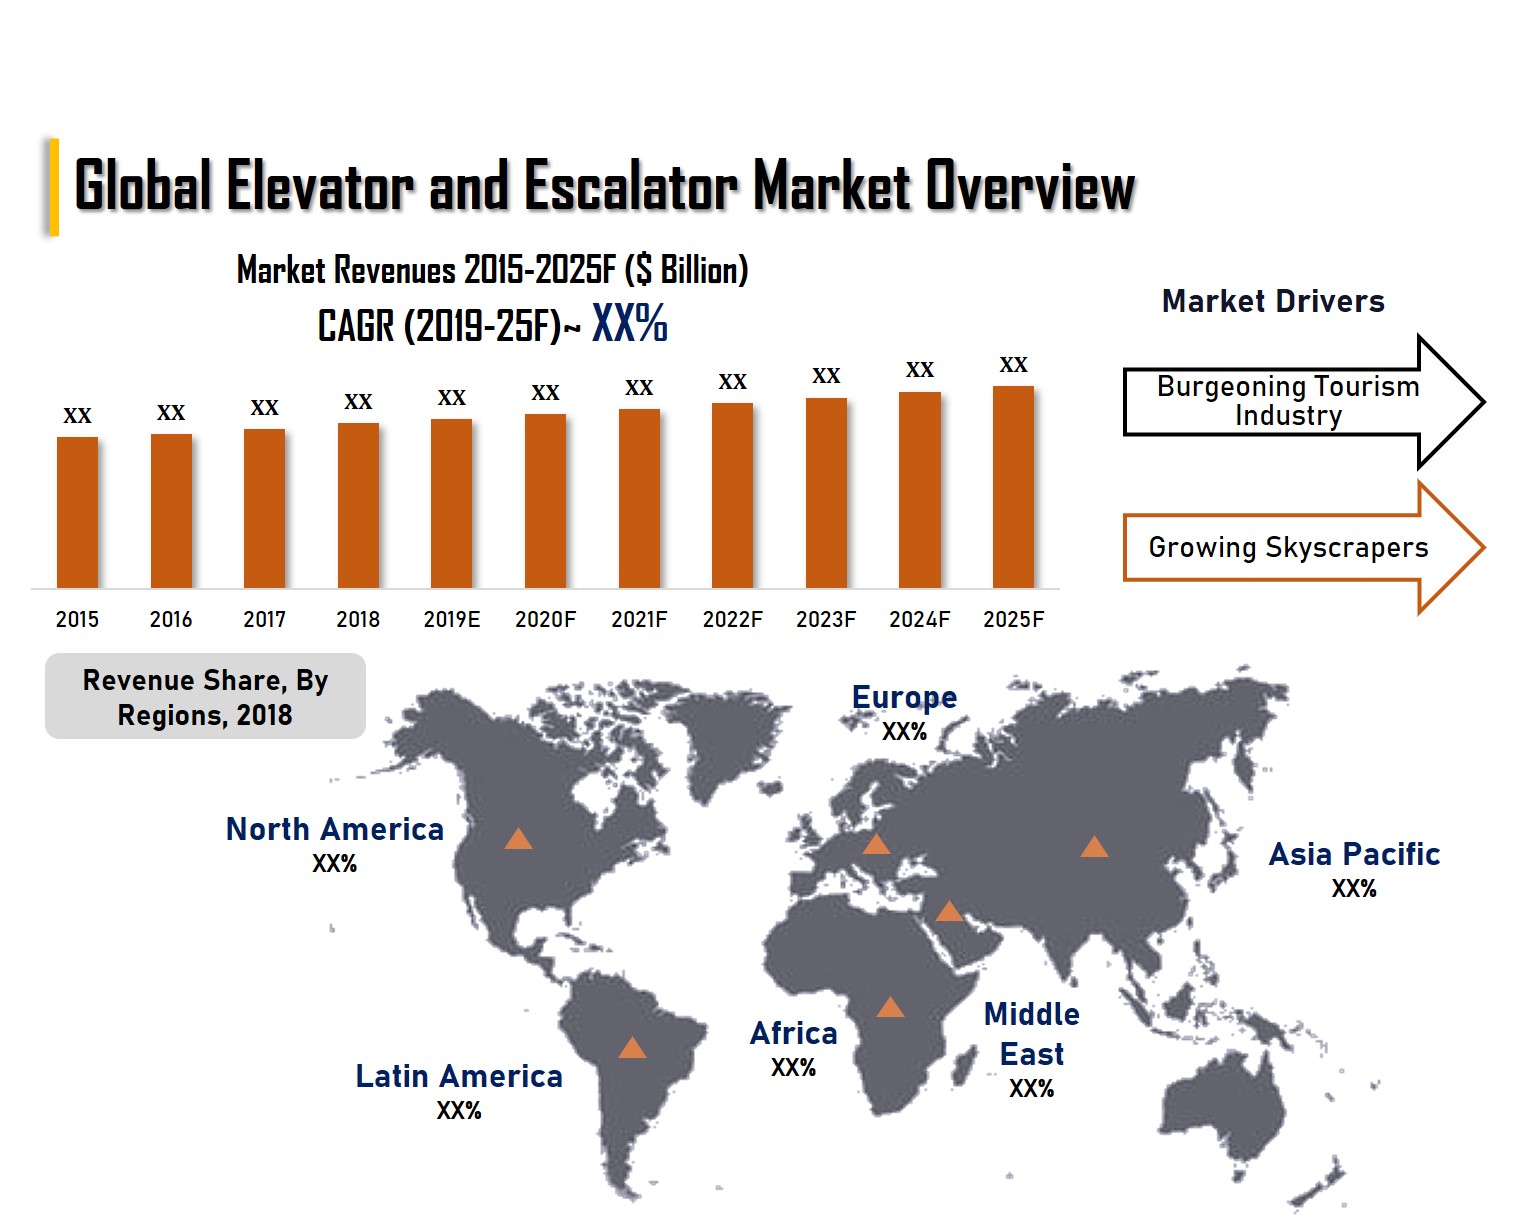
The global elevator and escalator market would continue to stay healthy on account of the rising installation of such solutions across segments such as commercial offices, hospitality, healthcare, transportation, and residential apartments. Additionally, projected growth in the construction market, upcoming new hotels and shopping malls coupled with increasing government spending on infrastructural development projects and increasing inflow of FDI in the construction and retail sectors across multiple regions are some of the key factors driving the Global elevator and escalator market globally.
According to 6Wresearch, Global Elevator And Escalator Market size are projected to grow at a CAGR of 3.0% during 2019-25. At present, the Asia Pacific region accounts for the highest revenue share in the overall global elevator and escalator market. Countries such as China and India are the major contributors in the region, owing to the rapid urbanization and infrastructural development across several verticals in these countries. Further, the African region is expected to emerge as a potentially lucrative market for elevators and escalators during the forecast period, primarily due to rapidly growing construction activities in the region.
The new installation market for elevators and escalators accounted for significant revenue share in the overall market globally in 2018, owing to widespread infrastructural development across several verticals, such as residential and commercial. However, as installations continue to rise across several countries, the demand for maintenance of elevators and escalators is expected to rise in correspondence, which would propel the services market for such solutions over the coming years.
Rising disposable income coupled with surging development in the residential sector is driving the Elevator and Escalator Market Share. Additionally, growing penetration among consumers regarding the luxury lifestyle has proliferated the growth of the market.
The Global elevator and escalator market report thoroughly covers the market by types, product types, applications, and regions. The Global elevator and escalator market outlook report provides an unbiased and detailed analysis of the on-going global elevator and escalator market trends, opportunities/high growth areas, and market drivers which would help the stakeholders to device and align their market strategies according to the current and future market dynamics.
The Global elevator and escalator market is estimated to grow steadily in the upcoming years on the back of variable factors such as rising demand for instance construction and infrastructure sectors, maintenance, and modernization of objects, and improvement in the after-sales service. Further, Rapid urbanization holds a large scope for growth of the escalator and elevator market globally in the coming years owing to a rise in the construction of a commercial and residential building which would demand increased installation of elevators and escalators globally and would propel the growth of global elevators and escalators market in the near future.
The increase in the infrastructural growth patterns in the commercial and the household premises is leading to an increased need for state-of-art and technology-aided electronics and amenities to ensure the premium living standards and as a result, is expected to be the proliferating factor for the growth of the elevator and escalator market globally in the coming years. An increase in construction activities is expected to be a positive growth contributing factor for the global elevator and escalator market in the next five to ten years. On the basis of regional breakup globally, the Middle East elevator and escalator market are expected to be the dominant factor in the overall global elevator and escalator market owing to vast construction taking place in the middle eastern countries such as Saudi Arabia, UAE, and Qatar and as a result, is expected to be the growth contributing factor for the Middle East elevator and escalator market and leave a positive impact on the overall growth of the global elevator and escalator market.
Key Highlights of the Report:
- Global Elevator and Escalator Market Overview
- Global Elevator and Escalator Market Outlook
- Global Elevator and Escalator Market Forecast
- Global Elevator and Escalator Market Size and Global Elevator and Escalator Market Forecast until 2025
- Global Elevator and Escalator Market Overview, By Types
- Global Elevator and Escalator Market Overview, By Product Types
- Global Elevator and Escalator Market Overview, By Applications
- Global Elevator and Escalator Market Overview, By Countries
- Global Elevator and Escalator Market Share, By Companies
- Historical Data & Forecast of Global Elevator and Escalator Market Revenues for the Period 2015-2025F
- Historical Data & Forecast of Global Elevator and Escalator Market Revenues, By Regions, for the Period 2015-2025F
- Historical Data & Forecast of Middle East Elevator and Escalator Market Revenues & Volume for the Period 2015-2025F
- Historical Data & Forecast of Middle East Elevator and Escalator Market Revenues and Volume, By Types, Product Types, Applications, and Countries for the Period 2015-2025F
- Historical Data & Forecast of North America Elevator and Escalator Market Revenues & Volume for the Period 2015-2025F
- Historical Data & Forecast of North America Elevator and Escalator Market Revenues and Volume, By Types, Product Types, Applications, and Countries for the Period 2015-2025F
- Historical Data & Forecast of Latin America Elevator and Escalator Market Revenues & Volume for the Period 2015-2025F
- Historical Data & Forecast of Latin America Elevator and Escalator Market Revenues and Volume, By Types, Product Types, Applications, and Countries for the Period 2015-2025F
- Historical Data & Forecast of Europe Elevator and Escalator Market Revenues & Volume for the Period 2015-2025F
- Historical Data & Forecast of Europe Elevator and Escalator Market Revenues and Volume, By Types, Product Types, Applications and Countries for the Period 2015-2025F
- Historical Data & Forecast of Africa Elevator and Escalator Market Revenues & Volume for the Period 2015-2025F
- Historical Data & Forecast of Africa Elevator and Escalator Market Revenues and Volume, By Types, Product Types, Applications and Countries for the Period 2015-2025F
- Historical Data & Forecast of Asia Pacific Elevator and Escalator Market Revenues & Volume for the Period 2015-2025F
- Historical Data & Forecast of Asia Pacific Elevator and Escalator Market Revenues and Volume, By Types, Product Types, Applications and Countries for the Period 2015-2025F
- Global Elevator and Escalator Market Drivers, Restraints, and Trends
- Global Elevator and Escalator Market Trends and Industry Life Cycle
- Porter’s Five Force Analysis
- Market Opportunity Assessment
- Global Elevator and Escalator Market Overview, On Competitive Benchmarking
- Company Profiles
- Key Strategic Recommendations
Market Covered:
The report provides a detailed analysis of the following market segments:
By Types:
oElevator
- Passenger
- Cargo
- Home
oEscalator
- Moving Stairs
- Moving Walks
By Applications:
- Commercial
- Residential
- Industrial
By Services:
- New Installations
- Maintenance
- Modernization
By Regions:
- Asia Pacific
- Middle East
- North America
- Latin America
- Europe
- Africa
Frequently Asked Questions About the Market Study (FAQs):
6Wresearch actively monitors the Global Elevator And Escalator Market and publishes its comprehensive annual report, highlighting emerging trends, growth drivers, revenue analysis, and forecast outlook. Our insights help businesses to make data-backed strategic decisions with ongoing market dynamics. Our analysts track relevent industries related to the Global Elevator And Escalator Market, allowing our clients with actionable intelligence and reliable forecasts tailored to emerging regional needs.
Yes, we provide customisation as per your requirements. To learn more, feel free to contact us on sales@6wresearch.com
| 1. Executive Summery |
| 2. Introduction |
| 2.1. Report Description |
| 2.2 Key Highlights of the Report |
| 2.3. Market Scope & Segmentation |
| 2.4. Research Methodology |
| 2.5. Assumptions |
| 3. Global Elevator and Escalator Market Overview |
| 3.1. Global Elevator and Escalator Market Revenues, 2015-2025F |
| 3.2. Global Elevator and Escalator Market - Industry Life Cycle, 2018 |
| 3.3. Global Elevator and Escalator Market - Porter’s Five Forces |
| 3.4. Global Elevator and Escalator Market Revenue Share, By Regions, 2018 & 2025F |
| 4. Global Elevator and Escalator Market Dynamics |
| 4.1. Impact Analysis |
| 4.2. Market Drivers |
| 4.3. Market Restraints |
| 5. Global Elevator and Escalator Market Trends |
| 6. Middle East Elevator and Escalator Market Overview |
| 6.1. Middle East Elevator and Escalator Market Revenues, 2015-2025F |
| 6.2. Middle East Elevator and Escalator Market Revenue Share, By Countries, 2018 & 2025F |
| 6.3. Saudi Arabia Elevator and Escalator Market Overview |
| 6.3.1. Country Overview |
| 6.3.2. Saudi Arabia Elevator and Escalator Market Revenues, 2015-2025F |
| 6.3.2.1. Saudi Arabia Elevator and Escalator Market Revenue Share, By Product Types, 2018 & 2025F |
| 6.3.2.2. Saudi Arabia Elevator and Escalator Market Revenue Share, By Types, 2018 & 2025F |
| 6.3.3. Saudi Arabia New Installation Elevator and Escalator Market Revenues & Volume, 2015-2025F |
| 6.3.3.1. Saudi Arabia New Installation Elevator and Escalator Market Revenue Share, By Product Types, 2018 & 2025F |
| 6.3.3.2. Saudi Arabia New Installation Elevator and Escalator Market Volume Share, By Product Types, 2018 & 2025F |
| 6.3.3.2.1. Saudi Arabia New Installation Elevator Market Revenues & Volume, 2015-2025F |
| 6.3.3.2.2. Saudi Arabia New Installation Escalator Market Revenues & Volume, 2015-2025F |
| 6.3.4. Saudi Arabia Elevator and Escalator Services Market Revenues, 2015-2025F |
| 6.3.4.1. Saudi Arabia Elevator and Escalator Services Market Revenue Share, By Product Types, 2018 & 2025F |
| 6.3.4.1.1. Saudi Arabia Elevator Services Market Revenues, 2015-2025F |
| 6.3.4.1.2. Saudi Arabia Escalator Services Market Revenues, 2015-2025F |
| 6.3.5. Saudi Arabia Elevator and Escalator Market Revenue Share, By Applications, 2018 & 2025F |
| 6.3.5.1. Saudi Arabia Commercial Application Elevator and Escalator Market Revenues, 2015-2025F |
| 6.3.5.2. Saudi Arabia Industrial Application Elevator and Escalator Market Revenues, 2015-2025F |
| 6.3.5.3. Saudi Arabia Residential Application Elevator and Escalator Market Revenues, 2015-2025F |
| 6.3.6. Saudi Arabia Elevator and Escalator Market Key Performance Indicators |
| 6.3.7. Saudi Arabia Elevator and Escalator Market Competitive Landscape |
| 6.4. UAE Elevator and Escalator Market Overview |
| 6.4.1. Country Overview |
| 6.4.2. UAE Elevator and Escalator Market Revenues, 2015-2025F |
| 6.4.2.1. UAE Elevator and Escalator Market Revenue Share, By Product Types, 2018 & 2025F |
| 6.4.2.2. UAE Elevator and Escalator Market Revenue Share, By Types, 2018 & 2025F |
| 6.4.3. UAE New Installation Elevator and Escalator Market Revenues & Volume, 2015-2025F |
| 6.4.3.1. UAE New Installation Elevator and Escalator Market Revenue Share, By Product Types, 2018 & 2025F |
| 6.4.3.2. UAE New Installation Elevator and Escalator Market Volume Share, By Product Types, 2018 & 2025F |
| 6.4.3.2.1. UAE New Installation Elevator Market Revenues & Volume, 2015-2025F |
| 6.4.3.2.2. UAE New Installation Escalator Market Revenues & Volume, 2015-2025F |
| 6.4.4. UAE Elevator and Escalator Services Market Revenues, 2015-2025F |
| 6.4.4.1. UAE Elevator and Escalator Services Market Revenue Share, By Product Types, 2018 & 2025F |
| 6.4.4.1.1. UAE Elevator Services Market Revenues, 2015-2025F |
| 6.4.4.1.2. UAE Escalator Services Market Revenues, 2015-2025F |
| 6.4.5. UAE Elevator and Escalator Market Revenue Share, By Applications, 2018 & 2025F |
| 6.4.5.1. UAE Commercial Application Elevator and Escalator Market Revenues, 2015-2025F |
| 6.4.5.2. UAE Industrial Application Elevator and Escalator Market Revenues, 2015-2025F |
| 6.4.5.3. UAE Residential Application Elevator and Escalator Market Revenues, 2015-2025F |
| 6.4.6. UAE Elevator and Escalator Market Key Performance Indicators |
| 6.4.7. UAE Elevator and Escalator Market Competitive Landscape |
| 6.5. Qatar Elevator and Escalator Market Overview |
| 6.5.1. Country Overview |
| 6.5.2. Qatar Elevator and Escalator Market Revenues, 2015-2025F |
| 6.5.2.1. Qatar Elevator and Escalator Market Revenue Share, By Product Types, 2018 & 2025F |
| 6.5.2.2. Qatar Elevator and Escalator Market Revenue Share, By Types, 2018 & 2025F |
| 6.5.3. Qatar New Installation Elevator and Escalator Market Revenues & Volume, 2015-2025F |
| 6.5.3.1. Qatar New Installation Elevator and Escalator Market Revenue Share, By Product Types, 2018 & 2025F |
| 6.5.3.2. Qatar New Installation Elevator and Escalator Market Volume Share, By Product Types, 2018 & 2025F |
| 6.5.3.2.1. Qatar New Installation Elevator Market Revenues & Volume, 2015-2025F |
| 6.5.3.2.2. Qatar New Installation Escalator Market Revenues & Volume, 2015-2025F |
| 6.5.4. Qatar Elevator and Escalator Services Market Revenues, 2015-2025F |
| 6.5.4.1. Qatar Elevator and Escalator Services Market Revenue Share, By Product Types, 2018 & 2025F |
| 6.5.4.1.1. Qatar Elevator Services Market Revenues, 2015-2025F |
| 6.5.4.1.2. Qatar Escalator Services Market Revenues, 2015-2025F |
| 6.5.5. Qatar Elevator and Escalator Market Revenue Share, By Applications, 2018 & 2025F |
| 6.5.5.1. Qatar Commercial Application Elevator and Escalator Market Revenues, 2015-2025F |
| 6.5.5.2. Qatar Industrial Application Elevator and Escalator Market Revenues, 2015-2025F |
| 6.5.5.3. Qatar Residential Application Elevator and Escalator Market Revenues, 2015-2025F |
| 6.5.6. Qatar Elevator and Escalator Market Key Performance Indicators |
| 6.5.7. Qatar Elevator and Escalator Market Competitive Landscape |
| 6.6. Kuwait Elevator and Escalator Market Overview |
| 6.6.1. Country Overview |
| 6.6.2. Kuwait Elevator and Escalator Market Revenues, 2015-2025F |
| 6.6.2.1. Kuwait Elevator and Escalator Market Revenue Share, By Product Types, 2018 & 2025F |
| 6.6.2.2. Kuwait Elevator and Escalator Market Revenue Share, By Types, 2018 & 2025F |
| 6.6.3. Kuwait New Installation Elevator and Escalator Market Revenues & Volume, 2015-2025F |
| 6.6.3.1. Kuwait New Installation Elevator and Escalator Market Revenue Share, By Product Types, 2018 & 2025F |
| 6.6.3.2. Kuwait New Installation Elevator and Escalator Market Volume Share, By Product Types, 2018 & 2025F |
| 6.6.3.2.1. Kuwait New Installation Elevator Market Revenues & Volume, 2015-2025F |
| 6.6.3.2.2. Kuwait New Installation Escalator Market Revenues & Volume, 2015-2025F |
| 6.6.4. Kuwait Elevator and Escalator Services Market Revenues, 2015-2025F |
| 6.6.4.1. Kuwait Elevator and Escalator Services Market Revenue Share, By Product Types, 2018 & 2025F |
| 6.6.4.1.1. Kuwait Elevator Services Market Revenues, 2015-2025F |
| 6.6.4.1.2. Kuwait Escalator Services Market Revenues, 2015-2025F |
| 6.6.5. Kuwait Elevator and Escalator Market Revenue Share, By Applications, 2018 & 2025F |
| 6.6.5.1. Kuwait Commercial Application Elevator and Escalator Market Revenues, 2015-2025F |
| 6.6.5.2. Kuwait Industrial Application Elevator and Escalator Market Revenues, 2015-2025F |
| 6.6.5.3. Kuwait Residential Application Elevator and Escalator Market Revenues, 2015-2025F |
| 6.6.6. Kuwait Elevator and Escalator Market Key Performance Indicators |
| 6.6.7. Kuwait Elevator and Escalator Market Competitive Landscape |
| 6.7. Oman Elevator and Escalator Market Overview |
| 6.7.1. Country Overview |
| 6.7.2. Oman Elevator and Escalator Market Revenues, 2015-2025F |
| 6.7.2.1. Oman Elevator and Escalator Market Revenue Share, By Product Types, 2018 & 2025F |
| 6.7.2.2. Oman Elevator and Escalator Market Revenue Share, By Types, 2018 & 2025F |
| 6.7.3. Oman New Installation Elevator and Escalator Market Revenues & Volume, 2015-2025F |
| 6.7.3.1. Oman New Installation Elevator and Escalator Market Revenue Share, By Product Types, 2018 & 2025F |
| 6.7.3.2. Oman New Installation Elevator and Escalator Market Volume Share, By Product Types, 2018 & 2025F |
| 6.7.3.2.1. Oman New Installation Elevator Market Revenues & Volume, 2015-2025F |
| 6.7.3.2.2. Oman New Installation Escalator Market Revenues & Volume, 2015-2025F |
| 6.7.4. Oman Elevator and Escalator Services Market Revenues, 2015-2025F |
| 6.7.4.1. Oman Elevator and Escalator Services Market Revenue Share, By Product Types, 2018 & 2025F |
| 6.7.4.1.1. Oman Elevator Services Market Revenues, 2015-2025F |
| 6.7.4.1.2. Oman Escalator Services Market Revenues, 2015-2025F |
| 6.7.5. Oman Elevator and Escalator Market Revenue Share, By Applications, 2018 & 2025F |
| 6.7.5.1. Oman Commercial Application Elevator and Escalator Market Revenues, 2015-2025F |
| 6.7.5.2. Oman Industrial Application Elevator and Escalator Market Revenues, 2015-2025F |
| 6.7.5.3. Oman Residential Application Elevator and Escalator Market Revenues, 2015-2025F |
| 6.7.6. Oman Elevator and Escalator Market Key Performance Indicators |
| 6.7.7. Oman Elevator and Escalator Market Competitive Landscape |
| 6.8. Bahrain Elevator and Escalator Market Overview |
| 6.8.1. Country Overview |
| 6.8.2. Bahrain Elevator and Escalator Market Revenues, 2015-2025F |
| 6.8.2.1. Bahrain Elevator and Escalator Market Revenue Share, By Product Types, 2018 & 2025F |
| 6.8.2.2. Bahrain Elevator and Escalator Market Revenue Share, By Types, 2018 & 2025F |
| 6.8.3. Bahrain New Installation Elevator and Escalator Market Revenues & Volume, 2015-2025F |
| 6.8.3.1. Bahrain New Installation Elevator and Escalator Market Revenue Share, By Product Types, 2018 & 2025F |
| 6.8.3.2. Bahrain New Installation Elevator and Escalator Market Volume Share, By Product Types, 2018 & 2025F |
| 6.8.3.2.1. Bahrain New Installation Elevator Market Revenues & Volume, 2015-2025F |
| 6.8.3.2.2. Bahrain New Installation Escalator Market Revenues & Volume, 2015-2025F |
| 6.8.4. Bahrain Elevator and Escalator Services Market Revenues, 2015-2025F |
| 6.8.4.1. Bahrain Elevator and Escalator Services Market Revenue Share, By Product Types, 2018 & 2025F |
| 6.8.4.1.1. Bahrain Elevator Services Market Revenues, 2015-2025F |
| 6.8.4.1.2. Bahrain Escalator Services Market Revenues, 2015-2025F |
| 6.8.5. Bahrain Elevator and Escalator Market Revenue Share, By Applications, 2018 & 2025F |
| 6.8.5.1. Bahrain Commercial Application Elevator and Escalator Market Revenues, 2015-2025F |
| 6.8.5.2. Bahrain Industrial Application Elevator and Escalator Market Revenues, 2015-2025F |
| 6.8.5.3. Bahrain Residential Application Elevator and Escalator Market Revenues, 2015-2025F |
| 6.8.6. Bahrain Elevator and Escalator Market Key Performance Indicators |
| 6.8.7. Bahrain Elevator and Escalator Market Competitive Landscape |
| 6.9. Iraq Elevator and Escalator Market Overview |
| 6.9.1. Country Overview |
| 6.9.2. Iraq Elevator and Escalator Market Revenues, 2015-2025F |
| 6.9.2.1. Iraq Elevator and Escalator Market Revenue Share, By Product Types, 2018 & 2025F |
| 6.9.2.2. Iraq Elevator and Escalator Market Revenue Share, By Types, 2018 & 2025F |
| 6.9.3. Iraq New Installation Elevator and Escalator Market Revenues & Volume, 2015-2025F |
| 6.9.3.1. Iraq New Installation Elevator and Escalator Market Revenue Share, By Product Types, 2018 & 2025F |
| 6.9.3.2. Iraq New Installation Elevator and Escalator Market Volume Share, By Product Types, 2018 & 2025F |
| 6.9.3.2.1. Iraq New Installation Elevator Market Revenues & Volume, 2015-2025F |
| 6.9.3.2.2. Iraq New Installation Escalator Market Revenues & Volume, 2015-2025F |
| 6.9.4. Iraq Elevator and Escalator Services Market Revenues, 2015-2025F |
| 6.9.4.1. Iraq Elevator and Escalator Services Market Revenue Share, By Product Types, 2018 & 2025F |
| 6.9.4.1.1. Iraq Elevator Services Market Revenues, 2015-2025F |
| 6.9.4.1.2. Iraq Escalator Services Market Revenues, 2015-2025F |
| 6.9.5. Iraq Elevator and Escalator Market Revenue Share, By Applications, 2018 & 2025F |
| 6.9.5.1. Iraq Commercial Application Elevator and Escalator Market Revenues, 2015-2025F |
| 6.9.5.2. Iraq Industrial Application Elevator and Escalator Market Revenues, 2015-2025F |
| 6.9.5.3. Iraq Residential Application Elevator and Escalator Market Revenues, 2015-2025F |
| 6.9.6. Iraq Elevator and Escalator Market Key Performance Indicators |
| 6.9.7. Iraq Elevator and Escalator Market Competitive Landscape |
| 6.10. Jordan Elevator and Escalator Market Overview |
| 6.10.1. Country Overview |
| 6.10.2. Jordan Elevator and Escalator Market Revenues, 2015-2025F |
| 6.10.2.1. Jordan Elevator and Escalator Market Revenue Share, By Product Types, 2018 & 2025F |
| 6.10.2.2. Jordan Elevator and Escalator Market Revenue Share, By Types, 2018 & 2025F |
| 6.10.3. Jordan New Installation Elevator and Escalator Market Revenues & Volume, 2015-2025F |
| 6.10.3.1. Jordan New Installation Elevator and Escalator Market Revenue Share, By Product Types, 2018 & 2025F |
| 6.10.3.2. Jordan New Installation Elevator and Escalator Market Volume Share, By Product Types, 2018 & 2025F |
| 6.10.3.2.1. Jordan New Installation Elevator Market Revenues & Volume, 2015-2025F |
| 6.10.3.2.2. Jordan New Installation Escalator Market Revenues & Volume, 2015-2025F |
| 6.10.4. Jordan Elevator and Escalator Services Market Revenues, 2015-2025F |
| 6.10.4.1. Jordan Elevator and Escalator Services Market Revenue Share, By Product Types, 2018 & 2025F |
| 6.10.4.1.1. Jordan Elevator Services Market Revenues, 2015-2025F |
| 6.10.4.1.2. Jordan Escalator Services Market Revenues, 2015-2025F |
| 6.10.5. Jordan Elevator and Escalator Market Revenue Share, By Applications, 2018 & 2025F |
| 6.10.5.1. Jordan Commercial Application Elevator and Escalator Market Revenues, 2015-2025F |
| 6.10.5.2. Jordan Industrial Application Elevator and Escalator Market Revenues, 2015-2025F |
| 6.10.5.3. Jordan Residential Application Elevator and Escalator Market Revenues, 2015-2025F |
| 6.10.6. Jordan Elevator and Escalator Market Key Performance Indicators |
| 6.10.7. Jordan Elevator and Escalator Market Competitive Landscape |
| 6.11. Turkey Elevator and Escalator Market Overview |
| 6.11.1. Country Overview |
| 6.11.2. Turkey Elevator and Escalator Market Revenues, 2015-2025F |
| 6.11.2.1. Turkey Elevator and Escalator Market Revenue Share, By Product Types, 2018 & 2025F |
| 6.11.2.2. Turkey Elevator and Escalator Market Revenue Share, By Types, 2018 & 2025F |
| 6.11.3. Turkey New Installation Elevator and Escalator Market Revenues & Volume, 2015-2025F |
| 6.11.3.1. Turkey New Installation Elevator and Escalator Market Revenue Share, By Product Types, 2018 & 2025F |
| 6.11.3.2. Turkey New Installation Elevator and Escalator Market Volume Share, By Product Types, 2018 & 2025F |
| 6.11.3.2.1 Turkey New Installation Elevator Market Revenues & Volume, 2015-2025F |
| 6.11.3.2.2. Turkey New Installation Escalator Market Revenues & Volume, 2015-2025F |
| 6.11.4. Turkey Elevator and Escalator Services Market Revenues, 2015-2025F |
| 6.11.4.1. Turkey Elevator and Escalator Services Market Revenue Share, By Product Types, 2018 & 2025F |
| 6.11.4.1.1. Turkey Elevator Services Market Revenues, 2015-2025F |
| 6.11.4.1.2. Turkey Escalator Services Market Revenues, 2015-2025F |
| 6.11.5. Turkey Elevator and Escalator Market Revenue Share, By Applications, 2018 & 2025F |
| 6.11.5.1. Turkey Commercial Application Elevator and Escalator Market Revenues, 2015-2025F |
| 6.11.5.2. Turkey Industrial Application Elevator and Escalator Market Revenues, 2015-2025F |
| 6.11.5.3. Turkey Residential Application Elevator and Escalator Market Revenues, 2015-2025F |
| 6.11.6. Turkey Elevator and Escalator Market Key Performance Indicators |
| 6.11.7. Turkey Elevator and Escalator Market Competitive Landscape |
| 6.12. Rest of Middle East Elevator and Escalator Market Overview |
| 6.12.1. Rest of Middle East Elevator and Escalator Market Revenues, 2015-2025F |
| 7. North America Elevator and Escalator Market Overview |
| 7.1. North America Elevator and Escalator Market Revenues, 2015-2025F |
| 7.2. North America Elevator and Escalator Market Revenue Share, By Countries, 2018 & 2025F |
| 7.3. USA Elevator and Escalator Market Overview |
| 7.3.1. Country Overview |
| 7.3.2. USA Elevator and Escalator Market Revenues, 2015-2025F |
| 7.3.2.1. USA Elevator and Escalator Market Revenue Share, By Product Types, 2018 & 2025F |
| 7.3.2.2. USA Elevator and Escalator Market Revenue Share, By Types, 2018 & 2025F |
| 7.3.3. USA New Installation Elevator and Escalator Market Revenues & Volume, 2015-2025F |
| 7.3.3.1. USA New Installation Elevator and Escalator Market Revenue Share, By Product Types, 2018 & 2025F |
| 7.3.3.2. USA New Installation Elevator and Escalator Market Volume Share, By Product Types, 2018 & 2025F |
| 7.3.3.2.1. USA New Installation Elevator Market Revenues & Volume, 2015-2025F |
| 7.3.3.2.2. USA New Installation Escalator Market Revenues & Volume, 2015-2025F |
| 7.3.4. USA Elevator and Escalator Services Market Revenues, 2015-2025F |
| 7.3.4.1. USA Elevator and Escalator Services Market Revenue Share, By Product Types, 2018 & 2025F |
| 7.3.4.1.1. USA Elevator Services Market Revenues, 2015-2025F |
| 7.3.4.1.2. USA Escalator Services Market Revenues, 2015-2025F |
| 7.3.5. USA Elevator and Escalator Market Revenue Share, By Applications, 2018 & 2025F |
| 7.3.5.1. USA Commercial Application Elevator and Escalator Market Revenues, 2015-2025F |
| 7.3.5.2. USA Industrial Application Elevator and Escalator Market Revenues, 2015-2025F |
| 7.3.5.3. USA Residential Application Elevator and Escalator Market Revenues, 2015-2025F |
| 7.3.6. USA Elevator and Escalator Market Key Performance Indicators |
| 7.3.7. USA Elevator and Escalator Market Competitive Landscape |
| 7.4. Canada Elevator and Escalator Market Overview |
| 7.4.1. Country Overview |
| 7.4.2. Canada Elevator and Escalator Market Revenues, 2015-2025F |
| 7.4.2.1. Canada Elevator and Escalator Market Revenue Share, By Product Types, 2018 & 2025F |
| 7.4.2.2. Canada Elevator and Escalator Market Revenue Share, By Types, 2018 & 2025F |
| 7.4.3. Canada New Installation Elevator and Escalator Market Revenues & Volume, 2015-2025F |
| 7.4.3.1. Canada New Installation Elevator and Escalator Market Revenue Share, By Product Types, 2018 & 2025F |
| 7.4.3.2. Canada New Installation Elevator and Escalator Market Volume Share, By Product Types, 2018 & 2025F |
| 7.4.3.2.1. Canada New Installation Elevator Market Revenues & Volume, 2015-2025F |
| 7.4.3.2.2. Canada New Installation Escalator Market Revenues & Volume, 2015-2025F |
| 7.4.4. Canada Elevator and Escalator Services Market Revenues, 2015-2025F |
| 7.4.4.1. Canada Elevator and Escalator Services Market Revenue Share, By Product Types, 2018 & 2025F |
| 7.4.4.1.1. Canada Elevator Services Market Revenues, 2015-2025F |
| 7.4.4.1.2. Canada Escalator Services Market Revenues, 2015-2025F |
| 7.4.5. Canada Elevator and Escalator Market Revenue Share, By Applications, 2018 & 2025F |
| 7.4.5.1. Canada Commercial Application Elevator and Escalator Market Revenues, 2015-2025F |
| 7.4.5.2. Canada Industrial Application Elevator and Escalator Market Revenues, 2015-2025F |
| 7.4.5.3. Canada Residential Application Elevator and Escalator Market Revenues, 2015-2025F |
| 7.4.6. Canada Elevator and Escalator Market Key Performance Indicators |
| 7.4.7. Canada Elevator and Escalator Market Competitive Landscape |
| 8. Latin America Elevator and Escalator Market Overview |
| 8.1. Latin America Elevator and Escalator Market Revenues, 2015-2025F |
| 8.2. Latin America Elevator and Escalator Market Revenue Share, By Countries, 2018 & 2025F |
| 8.3. Mexico Elevator and Escalator Market Overview |
| 8.3.1. Country Overview |
| 8.3.2. Mexico Elevator and Escalator Market Revenues, 2015-2025F |
| 8.3.2.1. Mexico Elevator and Escalator Market Revenue Share, By Product Types, 2018 & 2025F |
| 8.3.2.2. Mexico Elevator and Escalator Market Revenue Share, By Types, 2018 & 2025F |
| 8.3.3. Mexico New Installation Elevator and Escalator Market Revenues & Volume, 2015-2025F |
| 8.3.3.1. Mexico New Installation Elevator and Escalator Market Revenue Share, By Product Types, 2018 & 2025F |
| 8.3.3.2. Mexico New Installation Elevator and Escalator Market Volume Share, By Product Types, 2018 & 2025F |
| 8.3.3.2.1. Mexico New Installation Elevator Market Revenues & Volume, 2015-2025F |
| 8.3.3.2.2. Mexico New Installation Escalator Market Revenues & Volume, 2015-2025F |
| 8.3.4. Mexico Elevator and Escalator Services Market Revenues, 2015-2025F |
| 8.3.4.1. Mexico Elevator and Escalator Services Market Revenue Share, By Product Types, 2018 & 2025F |
| 8.3.4.1.1. Mexico Elevator Services Market Revenues, 2015-2025F |
| 8.3.4.1.2. Mexico Escalator Services Market Revenues, 2015-2025F |
| 8.3.5. Mexico Elevator and Escalator Market Revenue Share, By Applications, 2018 & 2025F |
| 8.3.5.1. Mexico Commercial Application Elevator and Escalator Market Revenues, 2015-2025F |
| 8.3.5.2. Mexico Industrial Application Elevator and Escalator Market Revenues, 2015-2025F |
| 8.3.5.3. Mexico Residential Application Elevator and Escalator Market Revenues, 2015-2025F |
| 8.3.6. Mexico Elevator and Escalator Market Key Performance Indicators |
| 8.3.7. Mexico Elevator and Escalator Market Competitive Landscape |
| 8.4. Brazil Elevator and Escalator Market Overview |
| 8.4.1. Country Overview |
| 8.4.2. Brazil Elevator and Escalator Market Revenues, 2015-2025F |
| 8.4.2.1. Brazil Elevator and Escalator Market Revenue Share, By Product Types, 2018 & 2025F |
| 8.4.2.2. Brazil Elevator and Escalator Market Revenue Share, By Types, 2018 & 2025F |
| 8.4.3. Brazil New Installation Elevator and Escalator Market Revenues & Volume, 2015-2025F |
| 8.4.3.1. Brazil New Installation Elevator and Escalator Market Revenue Share, By Product Types, 2018 & 2025F |
| 8.4.3.2. Brazil New Installation Elevator and Escalator Market Volume Share, By Product Types, 2018 & 2025F |
| 8.4.3.2.1. Brazil New Installation Elevator Market Revenues & Volume, 2015-2025F |
| 8.4.3.2.2. Brazil New Installation Escalator Market Revenues & Volume, 2015-2025F |
| 8.4.4. Brazil Elevator and Escalator Services Market Revenues, 2015-2025F |
| 8.4.4.1. Brazil Elevator and Escalator Services Market Revenue Share, By Product Types, 2018 & 2025F |
| 8.4.4.1.1. Brazil Elevator Services Market Revenues, 2015-2025F |
| 8.4.4.1.2. Brazil Escalator Services Market Revenues, 2015-2025F |
| 8.4.5. Brazil Elevator and Escalator Market Revenue Share, By Applications, 2018 & 2025F |
| 8.4.5.1. Brazil Commercial Application Elevator and Escalator Market Revenues, 2015-2025F |
| 8.4.5.2. Brazil Industrial Application Elevator and Escalator Market Revenues, 2015-2025F |
| 8.4.5.3. Brazil Residential Application Elevator and Escalator Market Revenues, 2015-2025F |
| 8.4.6. Brazil Elevator and Escalator Market Key Performance Indicators |
| 8.4.7. Brazil Elevator and Escalator Market Competitive Landscape |
| 8.5. Argentina Elevator and Escalator Market Overview |
| 8.5.1. Country Overview |
| 8.5.2. Argentina Elevator and Escalator Market Revenues, 2015-2025F |
| 8.5.2.1. Argentina Elevator and Escalator Market Revenue Share, By Product Types, 2018 & 2025F |
| 8.5.2.2. Argentina Elevator and Escalator Market Revenue Share, By Types, 2018 & 2025F |
| 8.5.3. Argentina New Installation Elevator and Escalator Market Revenues & Volume, 2015-2025F |
| 8.5.3.1. Argentina New Installation Elevator and Escalator Market Revenue Share, By Product Types, 2018 & 2025F |
| 8.5.3.2. Argentina New Installation Elevator and Escalator Market Volume Share, By Product Types, 2018 & 2025F |
| 8.5.3.2.1. Argentina New Installation Elevator Market Revenues & Volume, 2015-2025F |
| 8.5.3.2.2. Argentina New Installation Escalator Market Revenues & Volume, 2015-2025F |
| 8.5.4. Argentina Elevator and Escalator Services Market Revenues, 2015-2025F |
| 8.5.4.1. Argentina Elevator and Escalator Services Market Revenue Share, By Product Types, 2018 & 2025F |
| 8.5.4.1.1. Argentina Elevator Services Market Revenues, 2015-2025F |
| 8.5.4.1.2. Argentina Escalator Services Market Revenues, 2015-2025F |
| 8.5.5. Argentina Elevator and Escalator Market Revenue Share, By Applications, 2018 & 2025F |
| 8.5.5.1. Argentina Commercial Application Elevator and Escalator Market Revenues, 2015-2025F |
| 8.5.5.2. Argentina Industrial Application Elevator and Escalator Market Revenues, 2015-2025F |
| 8.5.5.3. Argentina Residential Application Elevator and Escalator Market Revenues, 2015-2025F |
| 8.5.6. Argentina Elevator and Escalator Market Key Performance Indicators |
| 8.5.7. Argentina Elevator and Escalator Market Competitive Landscape |
| 8.6. Rest of Latin America Elevator and Escalator Market Overview |
| 8.6.1. Rest of Latin America Elevator and Escalator Market Revenues, 2015-2025F |
| 9. Europe Elevator and Escalator Market Overview |
| 9.1. Europe Elevator and Escalator Market Revenues, 2015-2025F |
| 9.2. Europe Elevator and Escalator Market Revenue Share, By Countries, 2018 & 2025F |
| 9.3. United Kingdom Elevator and Escalator Market Overview |
| 9.3.1. Country Overview |
| 9.3.2. United Kingdom Elevator and Escalator Market Revenues, 2015-2025F |
| 9.3.2.1. United Kingdom Elevator and Escalator Market Revenue Share, By Product Types, 2018 & 2025F |
| 9.3.2.2. United Kingdom Elevator and Escalator Market Revenue Share, By Types, 2018 & 2025F |
| 9.3.3. United Kingdom New Installation Elevator and Escalator Market Revenues & Volume, 2015-2025F |
| 9.3.3.1. United Kingdom New Installation Elevator and Escalator Market Revenue Share, By Product Types, 2018 & 2025F |
| 9.3.3.2. United Kingdom New Installation Elevator and Escalator Market Volume Share, By Product Types, 2018 & 2025F |
| 9.3.3.2.1. United Kingdom New Installation Elevator Market Revenues & Volume, 2015-2025F |
| 9.3.3.2.2. United Kingdom New Installation Escalator Market Revenues & Volume, 2015-2025F |
| 9.3.4. United Kingdom Elevator and Escalator Services Market Revenues, 2015-2025F |
| 9.3.4.1. United Kingdom Elevator and Escalator Services Market Revenue Share, By Product Types, 2018 & 2025F |
| 9.3.4.1.1. United Kingdom Elevator Services Market Revenues, 2015-2025F |
| 9.3.4.1.2. United Kingdom Escalator Services Market Revenues, 2015-2025F |
| 9.3.5. United Kingdom Elevator and Escalator Market Revenue Share, By Applications, 2018 & 2025F |
| 9.3.5.1. United Kingdom Commercial Application Elevator and Escalator Market Revenues, 2015-2025F |
| 9.3.5.2. United Kingdom Industrial Application Elevator and Escalator Market Revenues, 2015-2025F |
| 9.3.5.3. United Kingdom Residential Application Elevator and Escalator Market Revenues, 2015-2025F |
| 9.3.6. United Kingdom Elevator and Escalator Market Key Performance Indicators |
| 9.3.7. United Kingdom Elevator and Escalator Market Competitive Landscape |
| 9.4. Germany Elevator and Escalator Market Overview |
| 9.4.1. Country Overview |
| 9.4.2. Germany Elevator and Escalator Market Revenues, 2015-2025F |
| 9.4.2.1. Germany Elevator and Escalator Market Revenue Share, By Product Types, 2018 & 2025F |
| 9.4.2.2. Germany Elevator and Escalator Market Revenue Share, By Types, 2018 & 2025F |
| 9.4.3. Germany New Installation Elevator and Escalator Market Revenues & Volume, 2015-2025F |
| 9.4.3.1. Germany New Installation Elevator and Escalator Market Revenue Share, By Product Types, 2018 & 2025F |
| 9.4.3.2. Germany New Installation Elevator and Escalator Market Volume Share, By Product Types, 2018 & 2025F |
| 9.4.3.2.1. Germany New Installation Elevator Market Revenues & Volume, 2015-2025F |
| 9.4.3.2.2. Germany New Installation Escalator Market Revenues & Volume, 2015-2025F |
| 9.4.4. Germany Elevator and Escalator Services Market Revenues, 2015-2025F |
| 9.4.4.1. Germany Elevator and Escalator Services Market Revenue Share, By Product Types, 2018 & 2025F |
| 9.4.4.1.1. Germany Elevator Services Market Revenues, 2015-2025F |
| 9.4.4.1.2. Germany Escalator Services Market Revenues, 2015-2025F |
| 9.4.5. Germany Elevator and Escalator Market Revenue Share, By Applications, 2018 & 2025F |
| 9.4.5.1. Germany Commercial Application Elevator and Escalator Market Revenues, 2015-2025F |
| 9.4.5.2. Germany Industrial Application Elevator and Escalator Market Revenues, 2015-2025F |
| 9.4.5.3. Germany Residential Application Elevator and Escalator Market Revenues, 2015-2025F |
| 9.4.6. Germany Elevator and Escalator Market Key Performance Indicators |
| 9.5. Italy Elevator and Escalator Market Overview |
| 9.5.1. Country Overview |
| 9.5.2. Italy Elevator and Escalator Market Revenues, 2015-2025F |
| 9.5.2.1. Italy Elevator and Escalator Market Revenue Share, By Product Types, 2018 & 2025F |
| 9.5.2.2. Italy Elevator and Escalator Market Revenue Share, By Types, 2018 & 2025F |
| 9.5.3. Italy New Installation Elevator and Escalator Market Revenues & Volume, 2015-2025F |
| 9.5.3.1. Italy New Installation Elevator and Escalator Market Revenue Share, By Product Types, 2018 & 2025F |
| 9.5.3.2. Italy New Installation Elevator and Escalator Market Volume Share, By Product Types, 2018 & 2025F |
| 9.5.3.2.1. Italy New Installation Elevator Market Revenues & Volume, 2015-2025F |
| 9.5.3.2.2. Italy New Installation Escalator Market Revenues & Volume, 2015-2025F |
| 9.5.4. Italy Elevator and Escalator Services Market Revenues, 2015-2025F |
| 9.5.4.1. Italy Elevator and Escalator Services Market Revenue Share, By Product Types, 2018 & 2025F |
| 9.5.4.1.1. Italy Elevator Services Market Revenues, 2015-2025F |
| 9.5.4.1.2. Italy Escalator Services Market Revenues, 2015-2025F |
| 9.5.5. Italy Elevator and Escalator Market Revenue Share, By Applications, 2018 & 2025F |
| 9.5.5.1. Italy Commercial Application Elevator and Escalator Market Revenues, 2015-2025F |
| 9.5.5.2. Italy Industrial Application Elevator and Escalator Market Revenues, 2015-2025F |
| 9.5.5.3. Italy Residential Application Elevator and Escalator Market Revenues, 2015-2025F |
| 9.5.6. Italy Elevator and Escalator Market Key Performance Indicators |
| 9.5.7. Italy Elevator and Escalator Market Competitive Landscape |
| 9.6. France Elevator and Escalator Market Overview |
| 9.6.1. Country Overview |
| 9.6.2. France Elevator and Escalator Market Revenues, 2015-2025F |
| 9.6.2.1. France Elevator and Escalator Market Revenue Share, By Product Types, 2018 & 2025F |
| 9.6.2.2. France Elevator and Escalator Market Revenue Share, By Types, 2018 & 2025F |
| 9.6.3. France New Installation Elevator and Escalator Market Revenues & Volume, 2015-2025F |
| 9.6.3.1. France New Installation Elevator and Escalator Market Revenue Share, By Product Types, 2018 & 2025F |
| 9.6.3.2. France New Installation Elevator and Escalator Market Volume Share, By Product Types, 2018 & 2025F |
| 9.6.3.2.1. France New Installation Elevator Market Revenues & Volume, 2015-2025F |
| 9.6.3.2.2. France New Installation Escalator Market Revenues & Volume, 2015-2025F |
| 9.6.4. France Elevator and Escalator Services Market Revenues, 2015-2025F |
| 9.6.4.1. France Elevator and Escalator Services Market Revenue Share, By Product Types, 2018 & 2025F |
| 9.6.4.1.1. France Elevator Services Market Revenues, 2015-2025F |
| 9.6.4.1.2. France Escalator Services Market Revenues, 2015-2025F |
| 9.6.5. France Elevator and Escalator Market Revenue Share, By Applications, 2018 & 2025F |
| 9.6.5.1. France Commercial Application Elevator and Escalator Market Revenues, 2015-2025F |
| 9.6.5.2. France Industrial Application Elevator and Escalator Market Revenues, 2015-2025F |
| 9.6.5.3. France Residential Application Elevator and Escalator Market Revenues, 2015-2025F |
| 9.6.6. France Elevator and Escalator Market Key Performance Indicators |
| 9.7. Spain Elevator and Escalator Market Overview |
| 9.7.1. Country Overview |
| 9.7.2. Spain Elevator and Escalator Market Revenues, 2015-2025F |
| 9.7.2.1. Spain Elevator and Escalator Market Revenue Share, By Product Types, 2018 & 2025F |
| 9.7.2.2. Spain Elevator and Escalator Market Revenue Share, By Types, 2018 & 2025F |
| 9.7.3. Spain New Installation Elevator and Escalator Market Revenues & Volume, 2015-2025F |
| 9.7.3.1. Spain New Installation Elevator and Escalator Market Revenue Share, By Product Types, 2018 & 2025F |
| 9.7.3.2. Spain New Installation Elevator and Escalator Market Volume Share, By Product Types, 2018 & 2025F |
| 9.7.3.2.1. Spain New Installation Elevator Market Revenues & Volume, 2015-2025F |
| 9.7.3.2.2. Spain New Installation Escalator Market Revenues & Volume, 2015-2025F |
| 9.7.4. Spain Elevator and Escalator Services Market Revenues, 2015-2025F |
| 9.7.4.1. Spain Elevator and Escalator Services Market Revenue Share, By Product Types, 2018 & 2025F |
| 9.7.4.1.1. Spain Elevator Services Market Revenues, 2015-2025F |
| 9.7.4.1.2. Spain Escalator Services Market Revenues, 2015-2025F |
| 9.7.5. Spain Elevator and Escalator Market Revenue Share, By Applications, 2018 & 2025F |
| 9.7.5.1. Spain Commercial Application Elevator and Escalator Market Revenues, 2015-2025F |
| 9.7.5.2. Spain Industrial Application Elevator and Escalator Market Revenues, 2015-2025F |
| 9.7.5.3. Spain Residential Application Elevator and Escalator Market Revenues, 2015-2025F |
| 9.7.6. Spain Elevator and Escalator Market Key Performance Indicators |
| 9.7.7. Spain Elevator and Escalator Market Competitive Landscape |
| 9.8. Eastern Europe Elevator and Escalator Market Overview |
| 9.8.1. Country Overview |
| 9.8.2. Eastern Europe Elevator and Escalator Market Revenues, 2015-2025F |
| 9.8.2.1. Eastern Europe Elevator and Escalator Market Revenue Share, By Product Types, 2018 & 2025F |
| 9.8.2.2. Eastern Europe Elevator and Escalator Market Revenue Share, By Types, 2018 & 2025F |
| 9.8.3. Eastern Europe New Installation Elevator and Escalator Market Revenues & Volume, 2015-2025F |
| 9.8.3.1. Eastern Europe New Installation Elevator and Escalator Market Revenue Share, By Product Types, 2018 & 2025F |
| 9.8.3.2. Eastern Europe New Installation Elevator and Escalator Market Volume Share, By Product Types, 2018 & 2025F |
| 9.8.3.2.1. Eastern Europe New Installation Elevator Market Revenues & Volume, 2015-2025F |
| 9.8.3.2.2. Eastern Europe New Installation Escalator Market Revenues & Volume, 2015-2025F |
| 9.8.4. Eastern Europe Elevator and Escalator Services Market Revenues, 2015-2025F |
| 9.8.4.1. Eastern Europe Elevator and Escalator Services Market Revenue Share, By Product Types, 2018 & 2025F |
| 9.8.4.1.1. Eastern Europe Elevator Services Market Revenues, 2015-2025F |
| 9.8.4.1.2. Eastern Europe Escalator Services Market Revenues, 2015-2025F |
| 9.8.5. Eastern Europe Elevator and Escalator Market Revenue Share, By Applications, 2018 & 2025F |
| 9.8.5.1. Eastern Europe Commercial Application Elevator and Escalator Market Revenues, 2015-2025F |
| 9.8.5.2. Eastern Europe Industrial Application Elevator and Escalator Market Revenues, 2015-2025F |
| 9.8.5.3. Eastern Europe Residential Application Elevator and Escalator Market Revenues, 2015-2025F |
| 9.8.6. Eastern Europe Elevator and Escalator Market Key Performance Indicators |
| 9.9. Rest of Europe Elevator and Escalator Market Overview |
| 9.9.1. Rest of Europe Elevator and Escalator Market Revenues, 2015-2025F |
| 10. Africa Elevator and Escalator Market Overview |
| 10.1. Africa Elevator and Escalator Market Revenues, 2015-2025F |
| 10.2. Africa Elevator and Escalator Market Revenue Share, By Countries, 2018 & 2025F |
| 10.3. Algeria Elevator and Escalator Market Overview |
| 10.3.1. Country Overview |
| 10.3.2. Algeria Elevator and Escalator Market Revenues, 2015-2025F |
| 10.3.2.1. Algeria Elevator and Escalator Market Revenue Share, By Product Types, 2018 & 2025F |
| 10.3.2.2. Algeria Elevator and Escalator Market Revenue Share, By Types, 2018 & 2025F |
| 10.3.3. Algeria New Installation Elevator and Escalator Market Revenues & Volume, 2015-2025F |
| 10.3.3.1. Algeria New Installation Elevator and Escalator Market Revenue Share, By Product Types, 2018 & 2025F |
| 10.3.3.2. Algeria New Installation Elevator and Escalator Market Volume Share, By Product Types, 2018 & 2025F |
| 10.3.3.2.1. Algeria New Installation Elevator Market Revenues & Volume, 2015-2025F |
| 10.3.3.2.2. Algeria New Installation Escalator Market Revenues & Volume, 2015-2025F |
| 10.3.4. Algeria Elevator and Escalator Services Market Revenues, 2015-2025F |
| 10.3.4.1. Algeria Elevator and Escalator Services Market Revenue Share, By Product Types, 2018 & 2025F |
| 10.3.4.1.1. Algeria Elevator Services Market Revenues, 2015-2025F |
| 10.3.4.1.2. Algeria Escalator Services Market Revenues, 2015-2025F |
| 10.3.5. Algeria Elevator and Escalator Market Revenue Share, By Applications, 2018 & 2025F |
| 10.3.5.1. Algeria Commercial Application Elevator and Escalator Market Revenues, 2015-2025F |
| 10.3.5.2. Algeria Industrial Application Elevator and Escalator Market Revenues, 2015-2025F |
| 10.3.5.3. Algeria Residential Application Elevator and Escalator Market Revenues, 2015-2025F |
| 10.3.6. Algeria Elevator and Escalator Market Key Performance Indicators |
| 10.3.7. Algeria Elevator and Escalator Market Competitive Landscape |
| 10.4. Egypt Elevator and Escalator Market Overview |
| 10.4.1. Country Overview |
| 10.4.2. Egypt Elevator and Escalator Market Revenues, 2015-2025F |
| 10.4.2.1. Egypt Elevator and Escalator Market Revenue Share, By Product Types, 2018 & 2025F |
| 10.4.2.2. Egypt Elevator and Escalator Market Revenue Share, By Types, 2018 & 2025F |
| 10.4.3. Egypt New Installation Elevator and Escalator Market Revenues & Volume, 2015-2025F |
| 10.4.3.1. Egypt New Installation Elevator and Escalator Market Revenue Share, By Product Types, 2018 & 2025F |
| 10.4.3.2. Egypt New Installation Elevator and Escalator Market Volume Share, By Product Types, 2018 & 2025F |
| 10.4.3.2.1. Egypt New Installation Elevator Market Revenues & Volume, 2015-2025F |
| 10.4.3.2.2. Egypt New Installation Escalator Market Revenues & Volume, 2015-2025F |
| 10.4.4. Egypt Elevator and Escalator Services Market Revenues, 2015-2025F |
| 10.4.4.1. Egypt Elevator and Escalator Services Market Revenue Share, By Product Types, 2018 & 2025F |
| 10.4.4.1.1. Egypt Elevator Services Market Revenues, 2015-2025F |
| 10.4.4.1.2. Egypt Escalator Services Market Revenues, 2015-2025F |
| 10.4.5. Egypt Elevator and Escalator Market Revenue Share, By Applications, 2018 & 2025F |
| 10.4.5.1. Egypt Commercial Application Elevator and Escalator Market Revenues, 2015-2025F |
| 10.4.5.2. Egypt Industrial Application Elevator and Escalator Market Revenues, 2015-2025F |
| 10.4.5.3. Egypt Residential Application Elevator and Escalator Market Revenues, 2015-2025F |
| 10.4.6. Egypt Elevator and Escalator Market Key Performance Indicators |
| 10.4.7. Egypt Elevator and Escalator Market Competitive Landscape |
| 10.5. Nigeria Elevator and Escalator Market Overview |
| 10.5.1. Country Overview |
| 10.5.2. Nigeria Elevator and Escalator Market Revenues, 2015-2025F |
| 10.5.2.1. Nigeria Elevator and Escalator Market Revenue Share, By Product Types, 2018 & 2025F |
| 10.5.2.2. Nigeria Elevator and Escalator Market Revenue Share, By Types, 2018 & 2025F |
| 10.5.3. Nigeria New Installation Elevator and Escalator Market Revenues & Volume, 2015-2025F |
| 10.5.3.1. Nigeria New Installation Elevator and Escalator Market Revenue Share, By Product Types, 2018 & 2025F |
| 10.5.3.2. Nigeria New Installation Elevator and Escalator Market Volume Share, By Product Types, 2018 & 2025F |
| 10.5.3.2.1. Nigeria New Installation Elevator Market Revenues & Volume, 2015-2025F |
| 10.5.3.2.2. Nigeria New Installation Escalator Market Revenues & Volume, 2015-2025F |
| 10.5.4. Nigeria Elevator and Escalator Services Market Revenues, 2015-2025F |
| 10.5.4.1. Nigeria Elevator and Escalator Services Market Revenue Share, By Product Types, 2018 & 2025F |
| 10.5.4.1.1. Nigeria Elevator Services Market Revenues, 2015-2025F |
| 10.5.4.1.2. Nigeria Escalator Services Market Revenues, 2015-2025F |
| 10.5.5. Nigeria Elevator and Escalator Market Revenue Share, By Applications, 2018 & 2025F |
| 10.5.5.1. Nigeria Commercial Application Elevator and Escalator Market Revenues, 2015-2025F |
| 10.5.5.2. Nigeria Industrial Application Elevator and Escalator Market Revenues, 2015-2025F |
| 10.5.5.3. Nigeria Residential Application Elevator and Escalator Market Revenues, 2015-2025F |
| 10.5.6. Nigeria Elevator and Escalator Market Key Performance Indicators |
| 10.5.7. Nigeria Elevator and Escalator Market Competitive Landscape |
| 10.6. South Africa Elevator and Escalator Market Overview |
| 10.6.1. Country Overview |
| 10.6.2. South Africa Elevator and Escalator Market Revenues, 2015-2025F |
| 10.6.2.1. South Africa Elevator and Escalator Market Revenue Share, By Product Types, 2018 & 2025F |
| 10.6.2.2. South Africa Elevator and Escalator Market Revenue Share, By Types, 2018 & 2025F |
| 10.6.3. South Africa New Installation Elevator and Escalator Market Revenues & Volume, 2015-2025F |
| 10.6.3.1. South Africa New Installation Elevator and Escalator Market Revenue Share, By Product Types, 2018 & 2025F |
| 10.6.3.2. South Africa New Installation Elevator and Escalator Market Volume Share, By Product Types, 2018 & 2025F |
| 10.6.3.2.1. South Africa New Installation Elevator Market Revenues & Volume, 2015-2025F |
| 10.6.3.2.2. South Africa New Installation Escalator Market Revenues & Volume, 2015-2025F |
| 10.6.4. South Africa Elevator and Escalator Services Market Revenues, 2015-2025F |
| 10.6.4.1. South Africa Elevator and Escalator Services Market Revenue Share, By Product Types, 2018 & 2025F |
| 10.6.4.1.1. South Africa Elevator Services Market Revenues, 2015-2025F |
| 10.6.4.1.2. South Africa Escalator Services Market Revenues, 2015-2025F |
| 10.6.5. South Africa Elevator and Escalator Market Revenue Share, By Applications, 2018 & 2025F |
| 10.6.5.1. South Africa Commercial Application Elevator and Escalator Market Revenues, 2015-2025F |
| 10.6.5.2. South Africa Industrial Application Elevator and Escalator Market Revenues, 2015-2025F |
| 10.6.5.3. South Africa Residential Application Elevator and Escalator Market Revenues, 2015-2025F |
| 10.6.6. South Africa Elevator and Escalator Market Key Performance Indicators |
| 10.6.7. South Africa Elevator and Escalator Market Competitive Landscape |
| 10.7. Kenya Elevator and Escalator Market Overview |
| 10.7.1. Country Overview |
| 10.7.2. Kenya Elevator and Escalator Market Revenues, 2015-2025F |
| 10.7.2.1. Kenya Elevator and Escalator Market Revenue Share, By Product Types, 2018 & 2025F |
| 10.7.2.2. Kenya Elevator and Escalator Market Revenue Share, By Types, 2018 & 2025F |
| 10.7.3. Kenya New Installation Elevator and Escalator Market Revenues & Volume, 2015-2025F |
| 10.7.3.1. Kenya New Installation Elevator and Escalator Market Revenue Share, By Product Types, 2018 & 2025F |
| 10.7.3.2. Kenya New Installation Elevator and Escalator Market Volume Share, By Product Types, 2018 & 2025F |
| 10.7.3.2.1. Kenya New Installation Elevator Market Revenues & Volume, 2015-2025F |
| 10.7.3.2.2. Kenya New Installation Escalator Market Revenues & Volume, 2015-2025F |
| 10.7.4. Kenya Elevator and Escalator Services Market Revenues, 2015-2025F |
| 10.7.4.1. Kenya Elevator and Escalator Services Market Revenue Share, By Product Types, 2018 & 2025F |
| 10.7.4.1.1. Kenya Elevator Services Market Revenues, 2015-2025F |
| 10.7.4.1.2. Kenya Escalator Services Market Revenues, 2015-2025F |
| 10.7.5. Kenya Elevator and Escalator Market Revenue Share, By Applications, 2018 & 2025F |
| 10.7.5.1. Kenya Commercial Application Elevator and Escalator Market Revenues, 2015-2025F |
| 10.7.5.2. Kenya Industrial Application Elevator and Escalator Market Revenues, 2015-2025F |
| 10.7.5.3. Kenya Residential Application Elevator and Escalator Market Revenues, 2015-2025F |
| 10.7.6. Kenya Elevator and Escalator Market Key Performance Indicators |
| 10.7.7. Kenya Elevator and Escalator Market Competitive Landscape |
| 10.8. Ghana Elevator and Escalator Market Overview |
| 10.8.1. Country Overview |
| 10.8.2. Ghana Elevator and Escalator Market Revenues, 2015-2025F |
| 10.8.2.1. Ghana Elevator and Escalator Market Revenue Share, By Product Types, 2018 & 2025F |
| 10.8.2.2. Ghana Elevator and Escalator Market Revenue Share, By Types, 2018 & 2025F |
| 10.8.3. Ghana New Installation Elevator and Escalator Market Revenues & Volume, 2015-2025F |
| 10.8.3.1. Ghana New Installation Elevator and Escalator Market Revenue Share, By Product Types, 2018 & 2025F |
| 10.8.3.2. Ghana New Installation Elevator and Escalator Market Volume Share, By Product Types, 2018 & 2025F |
| 10.8.3.2.1. Ghana New Installation Elevator Market Revenues & Volume, 2015-2025F |
| 10.8.3.2.2. Ghana New Installation Escalator Market Revenues & Volume, 2015-2025F |
| 10.8.4. Ghana Elevator and Escalator Services Market Revenues, 2015-2025F |
| 10.8.4.1. Ghana Elevator and Escalator Services Market Revenue Share, By Product Types, 2018 & 2025F |
| 10.8.4.1.1. Ghana Elevator Services Market Revenues, 2015-2025F |
| 10.8.4.1.2. Ghana Escalator Services Market Revenues, 2015-2025F |
| 10.8.5. Ghana Elevator and Escalator Market Revenue Share, By Applications, 2018 & 2025F |
| 10.8.5.1. Ghana Commercial Application Elevator and Escalator Market Revenues, 2015-2025F |
| 10.8.5.2. Ghana Industrial Application Elevator and Escalator Market Revenues, 2015-2025F |
| 10.8.5.3. Ghana Residential Application Elevator and Escalator Market Revenues, 2015-2025F |
| 10.8.6. Ghana Elevator and Escalator Market Key Performance Indicators |
| 10.8.7. Ghana Elevator and Escalator Market Competitive Landscape |
| 10.9. Tanzania Elevator and Escalator Market Overview |
| 10.9.1. Country Overview |
| 10.9.2. Tanzania Elevator and Escalator Market Revenues, 2015-2025F |
| 10.9.2.1. Tanzania Elevator and Escalator Market Revenue Share, By Product Types, 2018 & 2025F |
| 10.9.2.2. Tanzania Elevator and Escalator Market Revenue Share, By Types, 2018 & 2025F |
| 10.9.3. Tanzania New Installation Elevator and Escalator Market Revenues & Volume, 2015-2025F |
| 10.9.3.1. Tanzania New Installation Elevator and Escalator Market Revenue Share, By Product Types, 2018 & 2025F |
| 10.9.3.2. Tanzania New Installation Elevator and Escalator Market Volume Share, By Product Types, 2018 & 2025F |
| 10.9.3.2.1. Tanzania New Installation Elevator Market Revenues & Volume, 2015-2025F |
| 10.9.3.2.2. Tanzania New Installation Escalator Market Revenues & Volume, 2015-2025F |
| 10.9.4. Tanzania Elevator and Escalator Services Market Revenues, 2015-2025F |
| 10.9.4.1. Tanzania Elevator and Escalator Services Market Revenue Share, By Product Types, 2018 & 2025F |
| 10.9.4.1.1. Tanzania Elevator Services Market Revenues, 2015-2025F |
| 10.9.4.1.2. Tanzania Escalator Services Market Revenues, 2015-2025F |
| 10.9.5. Tanzania Elevator and Escalator Market Revenue Share, By Applications, 2018 & 2025F |
| 10.9.5.1. Tanzania Commercial Application Elevator and Escalator Market Revenues, 2015-2025F |
| 10.9.5.2. Tanzania Industrial Application Elevator and Escalator Market Revenues, 2015-2025F |
| 10.9.5.3. Tanzania Residential Application Elevator and Escalator Market Revenues, 2015-2025F |
| 10.9.6. Tanzania Elevator and Escalator Market Key Performance Indicators |
| 10.9.7. Tanzania Elevator and Escalator Market Competitive Landscape |
| 10.10. Morocco Elevator and Escalator Market Overview |
| 10.10.1. Country Overview |
| 10.10.2. Morocco Elevator and Escalator Market Revenues, 2015-2025F |
| 10.10.2.1. Morocco Elevator and Escalator Market Revenue Share, By Product Types, 2018 & 2025F |
| 10.10.2.2. Morocco Elevator and Escalator Market Revenue Share, By Types, 2018 & 2025F |
| 10.10.3. Morocco New Installation Elevator and Escalator Market Revenues & Volume, 2015-2025F |
| 10.10.3.1. Morocco New Installation Elevator and Escalator Market Revenue Share, By Product Types, 2018 & 2025F |
| 10.10.3.2. Morocco New Installation Elevator and Escalator Market Volume Share, By Product Types, 2018 & 2025F |
| 10.10.3.2.1. Morocco New Installation Elevator Market Revenues & Volume, 2015-2025F |
| 10.10.3.2.2. Morocco New Installation Escalator Market Revenues & Volume, 2015-2025F |
| 10.10.4. Morocco Elevator and Escalator Services Market Revenues, 2015-2025F |
| 10.10.4.1. Morocco Elevator and Escalator Services Market Revenue Share, By Product Types, 2018 & 2025F |
| 10.10.4.1.1. Morocco Elevator Services Market Revenues, 2015-2025F |
| 10.10.4.1.2. Morocco Escalator Services Market Revenues, 2015-2025F |
| 10.10.5. Morocco Elevator and Escalator Market Revenue Share, By Applications, 2018 & 2025F |
| 10.10.5.1. Morocco Commercial Application Elevator and Escalator Market Revenues, 2015-2025F |
| 10.10.5.2. Morocco Industrial Application Elevator and Escalator Market Revenues, 2015-2025F |
| 10.10.5.3. Morocco Residential Application Elevator and Escalator Market Revenues, 2015-2025F |
| 10.10.6. Morocco Elevator and Escalator Market Key Performance Indicators |
| 10.10.7. Morocco Elevator and Escalator Market Competitive Landscape |
| 10.11. Sudan Elevator and Escalator Market Overview |
| 10.11.1. Country Overview |
| 10.11.2. Sudan Elevator and Escalator Market Revenues, 2015-2025F |
| 10.11.2.1. Sudan Elevator and Escalator Market Revenue Share, By Product Types, 2018 & 2025F |
| 10.11.2.2. Sudan Elevator and Escalator Market Revenue Share, By Types, 2018 & 2025F |
| 10.11.3. Sudan New Installation Elevator and Escalator Market Revenues & Volume, 2015-2025F |
| 10.11.3.1. Sudan New Installation Elevator and Escalator Market Revenue Share, By Product Types, 2018 & 2025F |
| 10.11.3.2. Sudan New Installation Elevator and Escalator Market Volume Share, By Product Types, 2018 & 2025F |
| 10.11.3.2.1. Sudan New Installation Elevator Market Revenues & Volume, 2015-2025F |
| 10.11.3.2.2. Sudan New Installation Escalator Market Revenues & Volume, 2015-2025F |
| 10.11.4. Sudan Elevator and Escalator Services Market Revenues, 2015-2025F |
| 10.11.4.1. Sudan Elevator and Escalator Services Market Revenue Share, By Product Types, 2018 & 2025F |
| 10.11.4.1.1. Sudan Elevator Services Market Revenues, 2015-2025F |
| 10.11.4.1.2. Sudan Escalator Services Market Revenues, 2015-2025F |
| 10.11.5. Sudan Elevator and Escalator Market Revenue Share, By Applications, 2018 & 2025F |
| 10.11.5.1. Sudan Commercial Application Elevator and Escalator Market Revenues, 2015-2025F |
| 10.11.5.2. Sudan Industrial Application Elevator and Escalator Market Revenues, 2015-2025F |
| 10.11.5.3. Sudan Residential Application Elevator and Escalator Market Revenues, 2015-2025F |
| 10.11.6. Sudan Elevator and Escalator Market Key Performance Indicators |
| 10.11.7. Sudan Elevator and Escalator Market Competitive Landscape |
| 10.12. Tunisia Elevator and Escalator Market Overview |
| 10.12.1. Country Overview |
| 10.12.2. Tunisia Elevator and Escalator Market Revenues, 2015-2025F |
| 10.12.2.1. Tunisia Elevator and Escalator Market Revenue Share, By Product Types, 2018 & 2025F |
| 10.12.2.2. Tunisia Elevator and Escalator Market Revenue Share, By Types, 2018 & 2025F |
| 10.12.3. Tunisia New Installation Elevator and Escalator Market Revenues & Volume, 2015-2025F |
| 10.12.3.1. Tunisia New Installation Elevator and Escalator Market Revenue Share, By Product Types, 2018 & 2025F |
| 10.12.3.2. Tunisia New Installation Elevator and Escalator Market Volume Share, By Product Types, 2018 & 2025F |
| 10.12.3.2.1. Tunisia New Installation Elevator Market Revenues & Volume, 2015-2025F |
| 10.12.3.2.2. Tunisia New Installation Escalator Market Revenues & Volume, 2015-2025F |
| 10.12.4. Tunisia Elevator and Escalator Services Market Revenues, 2015-2025F |
| 10.12.4.1. Tunisia Elevator and Escalator Services Market Revenue Share, By Product Types, 2018 & 2025F |
| 10.12.4.1.1. Tunisia Elevator Services Market Revenues, 2015-2025F |
| 10.12.4.1.2. Tunisia Escalator Services Market Revenues, 2015-2025F |
| 10.12.5. Tunisia Elevator and Escalator Market Revenue Share, By Applications, 2018 & 2025F |
| 10.12.5.1. Tunisia Commercial Application Elevator and Escalator Market Revenues, 2015-2025F |
| 10.12.5.2. Tunisia Industrial Application Elevator and Escalator Market Revenues, 2015-2025F |
| 10.12.5.3. Tunisia Residential Application Elevator and Escalator Market Revenues, 2015-2025F |
| 10.12.6. Tunisia Elevator and Escalator Market Key Performance Indicators |
| 10.12.7. Tunisia Elevator and Escalator Market Competitive Landscape |
| 10.13. Ethiopia Elevator and Escalator Market Overview |
| 10.13.1. Country Overview |
| 10.13.2. Ethiopia Elevator and Escalator Market Revenues, 2015-2025F |
| 10.13.2.1. Ethiopia Elevator and Escalator Market Revenue Share, By Product Types, 2018 & 2025F |
| 10.13.2.2. Ethiopia Elevator and Escalator Market Revenue Share, By Types, 2018 & 2025F |
| 10.13.3. Ethiopia New Installation Elevator and Escalator Market Revenues & Volume, 2015-2025F |
| 10.13.3.1. Ethiopia New Installation Elevator and Escalator Market Revenue Share, By Product Types, 2018 & 2025F |
| 10.13.3.2. Ethiopia New Installation Elevator and Escalator Market Volume Share, By Product Types, 2018 & 2025F |
| 10.13.3.2.1. Ethiopia New Installation Elevator Market Revenues & Volume, 2015-2025F |
| 10.13.3.2.2. Ethiopia New Installation Escalator Market Revenues & Volume, 2015-2025F |
| 10.13.4. Ethiopia Elevator and Escalator Services Market Revenues, 2015-2025F |
| 10.13.4.1. Ethiopia Elevator and Escalator Services Market Revenue Share, By Product Types, 2018 & 2025F |
| 10.13.4.1.1. Ethiopia Elevator Services Market Revenues, 2015-2025F |
| 10.13.4.1.2. Ethiopia Escalator Services Market Revenues, 2015-2025F |
| 10.13.5. Ethiopia Elevator and Escalator Market Revenue Share, By Applications, 2018 & 2025F |
| 10.13.5.1. Ethiopia Commercial Application Elevator and Escalator Market Revenues, 2015-2025F |
| 10.13.5.2. Ethiopia Industrial Application Elevator and Escalator Market Revenues, 2015-2025F |
| 10.13.5.3. Ethiopia Residential Application Elevator and Escalator Market Revenues, 2015-2025F |
| 10.13.6. Ethiopia Elevator and Escalator Market Key Performance Indicators |
| 10.13.7. Ethiopia Elevator and Escalator Market Competitive Landscape |
| 10.14. Rest of Africa Elevator and Escalator Market Overview |
| 10.14.1. Rest of Africa Elevator and Escalator Market Revenues, 2015-2025F |
| 11. Asia Pacific Elevator and Escalator Market Overview |
| 11.1. Asia Pacific Elevator and Escalator Market Revenues, 2015-2025F |
| 11.2. Asia Pacific Elevator and Escalator Market Revenue Share, By Countries, 2018 & 2025F |
| 11.3. China Elevator and Escalator Market Overview |
| 11.3.1. Country Overview |
| 11.3.2. China Elevator and Escalator Market Revenues, 2015-2025F |
| 11.3.2.1. China Elevator and Escalator Market Revenue Share, By Product Types, 2018 & 2025F |
| 11.3.2.2. China Elevator and Escalator Market Revenue Share, By Types, 2018 & 2025F |
| 11.3.3. China New Installation Elevator and Escalator Market Revenues & Volume, 2015-2025F |
| 11.3.3.1. China New Installation Elevator and Escalator Market Revenue Share, By Product Types, 2018 & 2025F |
| 11.3.3.2. China New Installation Elevator and Escalator Market Volume Share, By Product Types, 2018 & 2025F |
| 11.3.3.2.1. China New Installation Elevator Market Revenues & Volume, 2015-2025F |
| 11.3.3.2.2. China New Installation Escalator Market Revenues & Volume, 2015-2025F |
| 11.3.4. China Elevator and Escalator Services Market Revenues, 2015-2025F |
| 11.3.4.1. China Elevator and Escalator Services Market Revenue Share, By Product Types, 2018 & 2025F |
| 11.3.4.1.1. China Elevator Services Market Revenues, 2015-2025F |
| 11.3.4.1.2. China Escalator Services Market Revenues, 2015-2025F |
| 11.3.5. China Elevator and Escalator Market Revenue Share, By Applications, 2018 & 2025F |
| 11.3.5.1. China Commercial Application Elevator and Escalator Market Revenues, 2015-2025F |
| 11.3.5.2. China Industrial Application Elevator and Escalator Market Revenues, 2015-2025F |
| 11.3.5.3. China Residential Application Elevator and Escalator Market Revenues, 2015-2025F |
| 11.3.6. China Elevator and Escalator Market Key Performance Indicators |
| 11.3.7. China Elevator and Escalator Market Competitive Landscape |
| 11.4. New Zealand Elevator and Escalator Market Overview |
| 11.4.1. Country Overview |
| 11.4.2. New Zealand Elevator and Escalator Market Revenues, 2015-2025F |
| 11.4.2.1. New Zealand Elevator and Escalator Market Revenue Share, By Product Types, 2018 & 2025F |
| 11.4.2.2. New Zealand Elevator and Escalator Market Revenue Share, By Types, 2018 & 2025F |
| 11.4.3. New Zealand New Installation Elevator and Escalator Market Revenues & Volume, 2015-2025F |
| 11.4.3.1. New Zealand New Installation Elevator and Escalator Market Revenue Share, By Product Types, 2018 & 2025F |
| 11.4.3.2. New Zealand New Installation Elevator and Escalator Market Volume Share, By Product Types, 2018 & 2025F |
| 11.4.3.2.1. New Zealand New Installation Elevator Market Revenues & Volume, 2015-2025F |
| 11.4.3.2.2. New Zealand New Installation Escalator Market Revenues & Volume, 2015-2025F |
| 11.4.4. New Zealand Elevator and Escalator Services Market Revenues, 2015-2025F |
| 11.4.4.1. New Zealand Elevator and Escalator Services Market Revenue Share, By Product Types, 2018 & 2025F |
| 11.4.4.1.1. New Zealand Elevator Services Market Revenues, 2015-2025F |
| 11.4.4.1.2. New Zealand Escalator Services Market Revenues, 2015-2025F |
| 11.4.5. New Zealand Elevator and Escalator Market Revenue Share, By Applications, 2018 & 2025F |
| 11.4.5.1. New Zealand Commercial Application Elevator and Escalator Market Revenues, 2015-2025F |
| 11.4.5.2. New Zealand Industrial Application Elevator and Escalator Market Revenues, 2015-2025F |
| 11.4.5.3. New Zealand Residential Application Elevator and Escalator Market Revenues, 2015-2025F |
| 11.4.6. New Zealand Elevator and Escalator Market Key Performance Indicators |
| 11.5. South Korea Elevator and Escalator Market Overview |
| 11.5.1. Country Overview |
| 11.5.2. South Korea Elevator and Escalator Market Revenues, 2015-2025F |
| 11.5.2.1. South Korea Elevator and Escalator Market Revenue Share, By Product Types, 2018 & 2025F |
| 11.5.2.2. South Korea Elevator and Escalator Market Revenue Share, By Types, 2018 & 2025F |
| 11.5.3. South Korea New Installation Elevator and Escalator Market Revenues & Volume, 2015-2025F |
| 11.5.3.1. South Korea New Installation Elevator and Escalator Market Revenue Share, By Product Types, 2018 & 2025F |
| 11.5.3.2. South Korea New Installation Elevator and Escalator Market Volume Share, By Product Types, 2018 & 2025F |
| 11.5.3.2.1. South Korea New Installation Elevator Market Revenues & Volume, 2015-2025F |
| 11.5.3.2.2. South Korea New Installation Escalator Market Revenues & Volume, 2015-2025F |
| 11.5.4. South Korea Elevator and Escalator Services Market Revenues, 2015-2025F |
| 11.5.4.1. South Korea Elevator and Escalator Services Market Revenue Share, By Product Types, 2018 & 2025F |
| 11.5.4.1.1. South Korea Elevator Services Market Revenues, 2015-2025F |
| 11.5.4.1.2. South Korea Escalator Services Market Revenues, 2015-2025F |
| 11.5.5. South Korea Elevator and Escalator Market Revenue Share, By Applications, 2018 & 2025F |
| 11.5.5.1. South Korea Commercial Application Elevator and Escalator Market Revenues, 2015-2025F |
| 11.5.5.2. South Korea Industrial Application Elevator and Escalator Market Revenues, 2015-2025F |
| 11.5.5.3. South Korea Residential Application Elevator and Escalator Market Revenues, 2015-2025F |
| 11.5.6. South Korea Elevator and Escalator Market Key Performance Indicators |
| 11.5.7. South Korea Elevator and Escalator Market Competitive Landscape |
| 11.6. Australia Elevator and Escalator Market Overview |
| 11.6.1. Country Overview |
| 11.6.2. Australia Elevator and Escalator Market Revenues, 2015-2025F |
| 11.6.2.1. Australia Elevator and Escalator Market Revenue Share, By Product Types, 2018 & 2025F |
| 11.6.2.2. Australia Elevator and Escalator Market Revenue Share, By Types, 2018 & 2025F |
| 11.6.3. Australia New Installation Elevator and Escalator Market Revenues & Volume, 2015-2025F |
| 11.6.3.1. Australia New Installation Elevator and Escalator Market Revenue Share, By Product Types, 2018 & 2025F |
| 11.6.3.2. Australia New Installation Elevator and Escalator Market Volume Share, By Product Types, 2018 & 2025F |
| 11.6.3.2.1. Australia New Installation Elevator Market Revenues & Volume, 2015-2025F |
| 11.6.3.2.2. Australia New Installation Escalator Market Revenues & Volume, 2015-2025F |
| 11.6.4. Australia Elevator and Escalator Services Market Revenues, 2015-2025F |
| 11.6.4.1. Australia Elevator and Escalator Services Market Revenue Share, By Product Types, 2018 & 2025F |
| 11.6.4.1.1. Australia Elevator Services Market Revenues, 2015-2025F |
| 11.6.4.1.2. Australia Escalator Services Market Revenues, 2015-2025F |
| 11.6.5. Australia Elevator and Escalator Market Revenue Share, By Applications, 2018 & 2025F |
| 11.6.5.1. Australia Commercial Application Elevator and Escalator Market Revenues, 2015-2025F |
| 11.6.5.2. Australia Industrial Application Elevator and Escalator Market Revenues, 2015-2025F |
| 11.6.5.3. Australia Residential Application Elevator and Escalator Market Revenues, 2015-2025F |
| 11.6.6. Australia Elevator and Escalator Market Key Performance Indicators |
| 11.7. Thailand Elevator and Escalator Market Overview |
| 11.7.1. Country Overview |
| 11.7.2. Thailand Elevator and Escalator Market Revenues, 2015-2025F |
| 11.7.2.1. Thailand Elevator and Escalator Market Revenue Share, By Product Types, 2018 & 2025F |
| 11.7.2.2. Thailand Elevator and Escalator Market Revenue Share, By Types, 2018 & 2025F |
| 11.7.3. Thailand New Installation Elevator and Escalator Market Revenues & Volume, 2015-2025F |
| 11.7.3.1. Thailand New Installation Elevator and Escalator Market Revenue Share, By Product Types, 2018 & 2025F |
| 11.7.3.2. Thailand New Installation Elevator and Escalator Market Volume Share, By Product Types, 2018 & 2025F |
| 11.7.3.2.1. Thailand New Installation Elevator Market Revenues & Volume, 2015-2025F |
| 11.7.3.2.2. Thailand New Installation Escalator Market Revenues & Volume, 2015-2025F |
| 11.7.4. Thailand Elevator and Escalator Services Market Revenues, 2015-2025F |
| 11.7.4.1. Thailand Elevator and Escalator Services Market Revenue Share, By Product Types, 2018 & 2025F |
| 11.7.4.1.1. Thailand Elevator Services Market Revenues, 2015-2025F |
| 11.7.4.1.2. Thailand Escalator Services Market Revenues, 2015-2025F |
| 11.7.5. Thailand Elevator and Escalator Market Revenue Share, By Applications, 2018 & 2025F |
| 11.7.5.1. Thailand Commercial Application Elevator and Escalator Market Revenues, 2015-2025F |
| 11.7.5.2. Thailand Industrial Application Elevator and Escalator Market Revenues, 2015-2025F |
| 11.7.5.3. Thailand Residential Application Elevator and Escalator Market Revenues, 2015-2025F |
| 11.7.6. Thailand Elevator and Escalator Market Key Performance Indicators |
| 11.7.7. Thailand Elevator and Escalator Market Competitive Landscape |
| 11.8. Vietnam Elevator and Escalator Market Overview |
| 11.8.1. Country Overview |
| 11.8.2. Vietnam Elevator and Escalator Market Revenues, 2015-2025F |
| 11.8.2.1. Vietnam Elevator and Escalator Market Revenue Share, By Product Types, 2018 & 2025F |
| 11.8.2.2. Vietnam Elevator and Escalator Market Revenue Share, By Types, 2018 & 2025F |
| 11.8.3. Vietnam New Installation Elevator and Escalator Market Revenues & Volume, 2015-2025F |
| 11.8.3.1. Vietnam New Installation Elevator and Escalator Market Revenue Share, By Product Types, 2018 & 2025F |
| 11.8.3.2. Vietnam New Installation Elevator and Escalator Market Volume Share, By Product Types, 2018 & 2025F |
| 11.8.3.2.1. Vietnam New Installation Elevator Market Revenues & Volume, 2015-2025F |
| 11.8.3.2.2. Vietnam New Installation Escalator Market Revenues & Volume, 2015-2025F |
| 11.8.4. Vietnam Elevator and Escalator Services Market Revenues, 2015-2025F |
| 11.8.4.1. Vietnam Elevator and Escalator Services Market Revenue Share, By Product Types, 2018 & 2025F |
| 11.8.4.1.1. Vietnam Elevator Services Market Revenues, 2015-2025F |
| 11.8.4.1.2. Vietnam Escalator Services Market Revenues, 2015-2025F |
| 11.8.5. Vietnam Elevator and Escalator Market Revenue Share, By Applications, 2018 & 2025F |
| 11.8.5.1. Vietnam Commercial Application Elevator and Escalator Market Revenues, 2015-2025F |
| 11.8.5.2. Vietnam Industrial Application Elevator and Escalator Market Revenues, 2015-2025F |
| 11.8.5.3. Vietnam Residential Application Elevator and Escalator Market Revenues, 2015-2025F |
| 11.8.6. Vietnam Elevator and Escalator Market Key Performance Indicators |
| 11.8.7. Vietnam Elevator and Escalator Market Competitive Landscape |
| 11.9. Indonesia Elevator and Escalator Market Overview |
| 11.9.1. Country Overview |
| 11.9.2. Indonesia Elevator and Escalator Market Revenues, 2015-2025F |
| 11.9.2.1. Indonesia Elevator and Escalator Market Revenue Share, By Product Types, 2018 & 2025F |
| 11.9.2.2. Indonesia Elevator and Escalator Market Revenue Share, By Types, 2018 & 2025F |
| 11.9.3. Indonesia New Installation Elevator and Escalator Market Revenues & Volume, 2015-2025F |
| 11.9.3.1. Indonesia New Installation Elevator and Escalator Market Revenue Share, By Product Types, 2018 & 2025F |
| 11.9.3.2. Indonesia New Installation Elevator and Escalator Market Volume Share, By Product Types, 2018 & 2025F |
| 11.9.3.2.1. Indonesia New Installation Elevator Market Revenues & Volume, 2015-2025F |
| 11.9.3.2.2. Indonesia New Installation Escalator Market Revenues & Volume, 2015-2025F |
| 11.9.4. Indonesia Elevator and Escalator Services Market Revenues, 2015-2025F |
| 11.9.4.1. Indonesia Elevator and Escalator Services Market Revenue Share, By Product Types, 2018 & 2025F |
| 11.9.4.1.1. Indonesia Elevator Services Market Revenues, 2015-2025F |
| 11.9.4.1.2. Indonesia Escalator Services Market Revenues, 2015-2025F |
| 11.9.5. Indonesia Elevator and Escalator Market Revenue Share, By Applications, 2018 & 2025F |
| 11.9.5.1. Indonesia Commercial Application Elevator and Escalator Market Revenues, 2015-2025F |
| 11.9.5.2. Indonesia Industrial Application Elevator and Escalator Market Revenues, 2015-2025F |
| 11.9.5.3. Indonesia Residential Application Elevator and Escalator Market Revenues, 2015-2025F |
| 11.9.6. Indonesia Elevator and Escalator Market Key Performance Indicators |
| 11.9.7. Indonesia Elevator and Escalator Market Competitive Landscape |
| 11.10. Malaysia Elevator and Escalator Market Overview |
| 11.10.1. Country Overview |
| 11.10.2. Malaysia Elevator and Escalator Market Revenues, 2015-2025F |
| 11.10.2.1. Malaysia Elevator and Escalator Market Revenue Share, By Product Types, 2018 & 2025F |
| 11.10.2.2. Malaysia Elevator and Escalator Market Revenue Share, By Types, 2018 & 2025F |
| 11.10.3. Malaysia New Installation Elevator and Escalator Market Revenues & Volume, 2015-2025F |
| 11.10.3.1. Malaysia New Installation Elevator and Escalator Market Revenue Share, By Product Types, 2018 & 2025F |
| 11.10.3.2. Malaysia New Installation Elevator and Escalator Market Volume Share, By Product Types, 2018 & 2025F |
| 11.10.3.2.1. Malaysia New Installation Elevator Market Revenues & Volume, 2015-2025F |
| 11.10.3.2.2. Malaysia New Installation Escalator Market Revenues & Volume, 2015-2025F |
| 11.10.4. Malaysia Elevator and Escalator Services Market Revenues, 2015-2025F |
| 11.10.4.1. Malaysia Elevator and Escalator Services Market Revenue Share, By Product Types, 2018 & 2025F |
| 11.10.4.1.1. Malaysia Elevator Services Market Revenues, 2015-2025F |
| 11.10.4.1.2. Malaysia Escalator Services Market Revenues, 2015-2025F |
| 11.10.5. Malaysia Elevator and Escalator Market Revenue Share, By Applications, 2018 & 2025F |
| 11.10.5.1. Malaysia Commercial Application Elevator and Escalator Market Revenues, 2015-2025F |
| 11.10.5.2. Malaysia Industrial Application Elevator and Escalator Market Revenues, 2015-2025F |
| 11.10.5.3. Malaysia Residential Application Elevator and Escalator Market Revenues, 2015-2025F |
| 11.10.6. Malaysia Elevator and Escalator Market Key Performance Indicators |
| 11.10.7. Malaysia Elevator and Escalator Market Competitive Landscape |
| 11.11. Philippines Elevator and Escalator Market Overview |
| 11.11.1. Country Overview |
| 11.11.2. Philippines Elevator and Escalator Market Revenues, 2015-2025F |
| 11.11.2.1. Philippines Elevator and Escalator Market Revenue Share, By Product Types, 2018 & 2025F |
| 11.11.2.2. Philippines Elevator and Escalator Market Revenue Share, By Types, 2018 & 2025F |
| 11.11.3. Philippines New Installation Elevator and Escalator Market Revenues & Volume, 2015-2025F |
| 11.11.3.1. Philippines New Installation Elevator and Escalator Market Revenue Share, By Product Types, 2018 & 2025F |
| 11.11.3.2. Philippines New Installation Elevator and Escalator Market Volume Share, By Product Types, 2018 & 2025F |
| 11.11.3.2.1. Philippines New Installation Elevator Market Revenues & Volume, 2015-2025F |
| 11.11.3.2.2. Philippines New Installation Escalator Market Revenues & Volume, 2015-2025F |
| 11.11.4. Philippines Elevator and Escalator Services Market Revenues, 2015-2025F |
| 11.11.4.1. Philippines Elevator and Escalator Services Market Revenue Share, By Product Types, 2018 & 2025F |
| 11.11.4.1.1. Philippines Elevator Services Market Revenues, 2015-2025F |
| 11.11.4.1.2. Philippines Escalator Services Market Revenues, 2015-2025F |
| 11.11.5. Philippines Elevator and Escalator Market Revenue Share, By Applications, 2018 & 2025F |
| 11.11.5.1. Philippines Commercial Application Elevator and Escalator Market Revenues, 2015-2025F |
| 11.11.5.2. Philippines Industrial Application Elevator and Escalator Market Revenues, 2015-2025F |
| 11.11.5.3. Philippines Residential Application Elevator and Escalator Market Revenues, 2015-2025F |
| 11.11.6. Philippines Elevator and Escalator Market Key Performance Indicators |
| 11.11.7. Philippines Elevator and Escalator Market Competitive Landscape |
| 11.12. Cambodia Elevator and Escalator Market Overview |
| 11.12.1. Country Overview |
| 11.12.2. Cambodia Elevator and Escalator Market Revenues, 2015-2025F |
| 11.12.2.1. Cambodia Elevator and Escalator Market Revenue Share, By Product Types, 2018 & 2025F |
| 11.12.2.2. Cambodia Elevator and Escalator Market Revenue Share, By Types, 2018 & 2025F |
| 11.12.3. Cambodia New Installation Elevator and Escalator Market Revenues & Volume, 2015-2025F |
| 11.12.3.1. Cambodia New Installation Elevator and Escalator Market Revenue Share, By Product Types, 2018 & 2025F |
| 11.12.3.2. Cambodia New Installation Elevator and Escalator Market Volume Share, By Product Types, 2018 & 2025F |
| 11.12.3.2.1. Cambodia New Installation Elevator Market Revenues & Volume, 2015-2025F |
| 11.12.3.2.2. Cambodia New Installation Escalator Market Revenues & Volume, 2015-2025F |
| 11.12.4. Cambodia Elevator and Escalator Services Market Revenues, 2015-2025F |
| 11.12.4.1. Cambodia Elevator and Escalator Services Market Revenue Share, By Product Types, 2018 & 2025F |
| 11.12.4.1.1. Cambodia Elevator Services Market Revenues, 2015-2025F |
| 11.12.4.1.2. Cambodia Escalator Services Market Revenues, 2015-2025F |
| 11.12.5. Cambodia Elevator and Escalator Market Revenue Share, By Applications, 2018 & 2025F |
| 11.12.5.1. Cambodia Commercial Application Elevator and Escalator Market Revenues, 2015-2025F |
| 11.12.5.2. Cambodia Industrial Application Elevator and Escalator Market Revenues, 2015-2025F |
| 11.12.5.3. Cambodia Residential Application Elevator and Escalator Market Revenues, 2015-2025F |
| 11.12.6. Cambodia Elevator and Escalator Market Key Performance Indicators |
| 11.13. India Elevator and Escalator Market Overview |
| 11.13.1. Country Overview |
| 11.13.2. India Elevator and Escalator Market Revenues, 2015-2025F |
| 11.13.2.1. India Elevator and Escalator Market Revenue Share, By Product Types, 2018 & 2025F |
| 11.13.2.2. India Elevator and Escalator Market Revenue Share, By Types, 2018 & 2025F |
| 11.13.3. India New Installation Elevator and Escalator Market Revenues & Volume, 2015-2025F |
| 11.13.3.1. India New Installation Elevator and Escalator Market Revenue Share, By Product Types, 2018 & 2025F |
| 11.13.3.2. India New Installation Elevator and Escalator Market Volume Share, By Product Types, 2018 & 2025F |
| 11.13.3.2.1. India New Installation Elevator Market Revenues & Volume, 2015-2025F |
| 11.13.3.2.2. India New Installation Escalator Market Revenues & Volume, 2015-2025F |
| 11.13.4. India Elevator and Escalator Services Market Revenues, 2015-2025F |
| 11.13.4.1. India Elevator and Escalator Services Market Revenue Share, By Product Types, 2018 & 2025F |
| 11.13.4.1.1. India Elevator Services Market Revenues, 2015-2025F |
| 11.13.4.1.2. India Escalator Services Market Revenues, 2015-2025F |
| 11.13.5. India Elevator and Escalator Market Revenue Share, By Applications, 2018 & 2025F |
| 11.13.5.1. India Commercial Application Elevator and Escalator Market Revenues, 2015-2025F |
| 11.13.5.2. India Industrial Application Elevator and Escalator Market Revenues, 2015-2025F |
| 11.13.5.3. India Residential Application Elevator and Escalator Market Revenues, 2015-2025F |
| 11.13.6. India Elevator and Escalator Market Key Performance Indicators |
| 11.13.7. India Elevator and Escalator Market Competitive Landscape |
| 11.14. Myanmar Elevator and Escalator Market Overview |
| 11.14.1. Country Overview |
| 11.14.2. Myanmar Elevator and Escalator Market Revenues, 2015-2025F |
| 11.14.2.1. Myanmar Elevator and Escalator Market Revenue Share, By Product Types, 2018 & 2025F |
| 11.14.2.2. Myanmar Elevator and Escalator Market Revenue Share, By Types, 2018 & 2025F |
| 11.14.3. Myanmar New Installation Elevator and Escalator Market Revenues & Volume, 2015-2025F |
| 11.14.3.1. Myanmar New Installation Elevator and Escalator Market Revenue Share, By Product Types, 2018 & 2025F |
| 11.14.3.2. Myanmar New Installation Elevator and Escalator Market Volume Share, By Product Types, 2018 & 2025F |
| 11.14.3.2.1. Myanmar New Installation Elevator Market Revenues & Volume, 2015-2025F |
| 11.14.3.2.2. Myanmar New Installation Escalator Market Revenues & Volume, 2015-2025F |
| 11.14.4. Myanmar Elevator and Escalator Services Market Revenues, 2015-2025F |
| 11.14.4.1. Myanmar Elevator and Escalator Services Market Revenue Share, By Product Types, 2018 & 2025F |
| 11.14.4.1.1. Myanmar Elevator Services Market Revenues, 2015-2025F |
| 11.14.4.1.2. Myanmar Escalator Services Market Revenues, 2015-2025F |
| 11.14.5. Myanmar Elevator and Escalator Market Revenue Share, By Applications, 2018 & 2025F |
| 11.14.5.1. Myanmar Commercial Application Elevator and Escalator Market Revenues, 2015-2025F |
| 11.14.5.2. Myanmar Industrial Application Elevator and Escalator Market Revenues, 2015-2025F |
| 11.14.5.3. Myanmar Residential Application Elevator and Escalator Market Revenues, 2015-2025F |
| 11.14.6. Myanmar Elevator and Escalator Market Key Performance Indicators |
| 11.14.7. Myanmar Elevator and Escalator Market Competitive Landscape |
| 11.15. Singapore Elevator and Escalator Market Overview |
| 11.15.1. Country Overview |
| 11.15.2. Singapore Elevator and Escalator Market Revenues, 2015-2025F |
| 11.15.2.1. Singapore Elevator and Escalator Market Revenue Share, By Product Types, 2018 & 2025F |
| 11.15.2.2. Singapore Elevator and Escalator Market Revenue Share, By Types, 2018 & 2025F |
| 11.15.3. Singapore New Installation Elevator and Escalator Market Revenues & Volume, 2015-2025F |
| 11.15.3.1. Singapore New Installation Elevator and Escalator Market Revenue Share, By Product Types, 2018 & 2025F |
| 11.15.3.2. Singapore New Installation Elevator and Escalator Market Volume Share, By Product Types, 2018 & 2025F |
| 11.15.3.2.1. Singapore New Installation Elevator Market Revenues & Volume, 2015-2025F |
| 11.15.3.2.2. Singapore New Installation Escalator Market Revenues & Volume, 2015-2025F |
| 11.15.4. Singapore Elevator and Escalator Services Market Revenues, 2015-2025F |
| 11.15.4.1. Singapore Elevator and Escalator Services Market Revenue Share, By Product Types, 2018 & 2025F |
| 11.15.4.1.1. Singapore Elevator Services Market Revenues, 2015-2025F |
| 11.15.4.1.2. Singapore Escalator Services Market Revenues, 2015-2025F |
| 11.15.5. Singapore Elevator and Escalator Market Revenue Share, By Applications, 2018 & 2025F |
| 11.15.5.1. Singapore Commercial Application Elevator and Escalator Market Revenues, 2015-2025F |
| 11.15.5.2. Singapore Industrial Application Elevator and Escalator Market Revenues, 2015-2025F |
| 11.15.5.3. Singapore Residential Application Elevator and Escalator Market Revenues, 2015-2025F |
| 11.15.6. Singapore Elevator and Escalator Market Key Performance Indicators |
| 11.15.7. Singapore Elevator and Escalator Market Competitive Landscape |
| 11.16. Japan Elevator and Escalator Market Overview |
| 11.16.1. Country Overview |
| 11.16.2. Japan Elevator and Escalator Market Revenues, 2015-2025F |
| 11.16.2.1. Japan Elevator and Escalator Market Revenue Share, By Product Types, 2018 & 2025F |
| 11.16.2.2. Japan Elevator and Escalator Market Revenue Share, By Types, 2018 & 2025F |
| 11.16.3. Japan New Installation Elevator and Escalator Market Revenues & Volume, 2015-2025F |
| 11.16.3.1. Japan New Installation Elevator and Escalator Market Revenue Share, By Product Types, 2018 & 2025F |
| 11.16.3.2. Japan New Installation Elevator and Escalator Market Volume Share, By Product Types, 2018 & 2025F |
| 11.16.3.2.1. Japan New Installation Elevator Market Revenues & Volume, 2015-2025F |
| 11.16.3.2.2. Japan New Installation Escalator Market Revenues & Volume, 2015-2025F |
| 11.16.4. Japan Elevator and Escalator Services Market Revenues, 2015-2025F |
| 11.16.4.1. Japan Elevator and Escalator Services Market Revenue Share, By Product Types, 2018 & 2025F |
| 11.16.4.1.1. Japan Elevator Services Market Revenues, 2015-2025F |
| 11.16.4.1.2. Japan Escalator Services Market Revenues, 2015-2025F |
| 11.16.5. Japan Elevator and Escalator Market Revenue Share, By Applications, 2018 & 2025F |
| 11.16.5.1. Japan Commercial Application Elevator and Escalator Market Revenues, 2015-2025F |
| 11.16.5.2. Japan Industrial Application Elevator and Escalator Market Revenues, 2015-2025F |
| 11.16.5.3. Japan Residential Application Elevator and Escalator Market Revenues, 2015-2025F |
| 11.16.6. Japan Elevator and Escalator Market Key Performance Indicators |
| 11.16.7. Japan Elevator and Escalator Market Competitive Landscape |
| 11.17. Laos Elevator and Escalator Market Overview |
| 11.17.1. Country Overview |
| 11.17.2. Laos Elevator and Escalator Market Revenues, 2015-2025F |
| 11.17.2.1. Laos Elevator and Escalator Market Revenue Share, By Product Types, 2018 & 2025F |
| 11.17.2.2. Laos Elevator and Escalator Market Revenue Share, By Types, 2018 & 2025F |
| 11.17.3. Laos New Installation Elevator and Escalator Market Revenues & Volume, 2015-2025F |
| 11.17.3.1. Laos New Installation Elevator and Escalator Market Revenue Share, By Product Types, 2018 & 2025F |
| 11.17.3.2. Laos New Installation Elevator and Escalator Market Volume Share, By Product Types, 2018 & 2025F |
| 11.17.3.2.1. Laos New Installation Elevator Market Revenues & Volume, 2015-2025F |
| 11.17.3.2.2. Laos New Installation Escalator Market Revenues & Volume, 2015-2025F |
| 11.17.4. Laos Elevator and Escalator Services Market Revenues, 2015-2025F |
| 11.17.4.1. Laos Elevator and Escalator Services Market Revenue Share, By Product Types, 2018 & 2025F |
| 11.17.4.1.1. Laos Elevator Services Market Revenues, 2015-2025F |
| 11.17.4.1.2. Laos Escalator Services Market Revenues, 2015-2025F |
| 11.17.5. Laos Elevator and Escalator Market Revenue Share, By Applications, 2018 & 2025F |
| 11.17.5.1. Laos Commercial Application Elevator and Escalator Market Revenues, 2015-2025F |
| 11.17.5.2. Laos Industrial Application Elevator and Escalator Market Revenues, 2015-2025F |
| 11.17.5.3. Laos Residential Application Elevator and Escalator Market Revenues, 2015-2025F |
| 11.17.6. Laos Elevator and Escalator Market Key Performance Indicators |
| 11.17.7. Laos Elevator and Escalator Market Competitive Landscape |
| 11.18. Rest of Asia Pacific Elevator and Escalator Market Overview |
| 11.18.1. Rest of Asia Pacific Elevator and Escalator Market Revenues, 2015-2025F |
| 12. Global Elevator and Escalator Market Opportunity Assessment |
| 12.1. Global Elevator and Escalator Market Opportunity Assessment, By Regions, 2025F |
| 13. Global Elevator and Escalator Market Competitive Landscape |
| 13.1. Global Elevator and Escalator Market Competitive Benchmarking, By Product Types |
| 13.2. Global Elevator and Escalator Market Competitive Benchmarking, By Operating Parameters |
| 14. Company Profiles |
| 14.1. Otis Elevator Co. |
| 14.2. Schindler Holding Ltd. |
| 14.3. KONE Corporation |
| 14.4. Hyundai Elevator Co., Ltd. |
| 14.5. Toshiba Corporation |
| 14.6. Mitsubishi Electric Corporation |
| 14.7. Thyssenkrupp AG |
| 14.8. Kleemann Hellas S.A. |
| 14.9. Orona |
| 14.10. Servicom SARL |
| 15. Key Strategic Recommendations |
| 16. Disclaimer |
| List of Figures |
| Figure 1: Global Elevator and Escalator Market Revenues, 2015-2025F ($ Billion) |
| Figure 2: Global Elevator and Escalator Market - Industry Life Cycle, 2018 |
| Figure 3: Global Elevator and Escalator Market Revenue Share, By Regions, 2018 & 2025F |
| Figure 4: Middle East Elevator and Escalator Market Revenues, 2015-2025F ($ Million) |
| Figure 5: Middle East Elevator and Escalator Market Revenue Share, By Countries, 2018 & 2025F |
| Figure 6: Saudi Arabia Elevator and Escalator Market Revenues, 2015-2025F ($ Million) |
| Figure 7: Saudi Arabia Elevator and Escalator Market Revenue Share, By Product Types, 2018 & 2025F |
| Figure 8: Saudi Arabia Elevator and Escalator Market Revenue Share, By Types, 2018 & 2025F |
| Figure 9: Saudi Arabia New Installation Elevator and Escalator Market Revenues & Volume, 2015-2025F ($ Million, Units) |
| Figure 10: Saudi Arabia New Installation Elevator and Escalator Market Revenue Share, By Product Types, 2018 & 2025F |
| Figure 11: Saudi Arabia New Installation Elevator and Escalator Market Volume Share, By Product Types, 2018 & 2025F |
| Figure 12: Saudi Arabia New Installation Elevator Market Revenues & Volume, 2015-2025F ($ Million, Units) |
| Figure 13: Saudi Arabia New Installation Escalator Market Revenues & Volume, 2015-2025F ($ Million, Units) |
| Figure 14: Saudi Arabia Elevator and Escalator Services Market Revenues, 2015-2025F ($ Million) |
| Figure 15: Saudi Arabia Elevator and Escalator Services Market Revenue Share, By Product Types, 2018 & 2025F |
| Figure 16: Saudi Arabia Elevator Services Market Revenues, 2015-2025F ($ Million) |
| Figure 17: Saudi Arabia Escalator Services Market Revenues, 2015-2025F ($ Million) |
| Figure 18: Saudi Arabia Elevator and Escalator Market Revenue Share, By Applications, 2018 & 2025F |
| Figure 19: Saudi Arabia Commercial Application Elevator and Escalator Market Revenues, 2015-2025F ($ Million) |
| Figure 20: Saudi Arabia Industrial Application Elevator and Escalator Market Revenues, 2015-2025F ($ Million) |
| Figure 21: Saudi Arabia Residential Application Elevator and Escalator Market Revenues, 2015-2025F ($ Million) |
| Figure 22: Saudi Arabia Actual Government Spending Vs Actual Government Revenues, 2015-2024F (SAR Trillion) |
| Figure 23: Saudi Arabia Government Budget Spending Outlook, 2019E (SAR Billion) |
| Figure 24: Riyadh Residential Supply, 2015-2020F (Thousand Units) |
| Figure 25: Jeddah Residential Supply, 2015-2020F (Thousand Units) |
| Figure 26: Dammam Residential Supply, 2015-2020F (Thousand Units) |
| Figure 27: Makkah Residential Supply, 2015-2020F (Thousand Units) |
| Figure 28: Riyadh Office Supply, 2015-2018 (‘000 Sq. m.) |
| Figure 29: Jeddah Office Supply, 2015-2020F (‘000 Sq. m.) |
| Figure 30: Riyadh Retail Supply, 2015-2020F (‘000 Sq. m.) |
| Figure 31: Jeddah Retail Supply, 2015-2020F (‘000 Sq. m.) |
| Figure 32: Riyadh Hotel Supply, 2014-2019E (No. of Rooms) |
| Figure 33: Jeddah Hotel Supply, 2014-2019E (No. of Rooms) |
| Figure 34: Major Upcoming Healthcare Projects in Saudi Arabia |
| Figure 35: Saudi Arabia Steel Production, 2018-2019 (Thousand Tonnes) |
| Figure 36: Upcoming Power Plant Projects in Saudi Arabia |
| Figure 37: Saudi Arabia Elevator and Escalator Market Revenue Share, By Company, 2018 |
| Figure 38: UAE Elevator and Escalator Market Revenues, 2015-2025F ($ Million) |
| Figure 39: UAE Elevator and Escalator Market Revenue Share, By Product Types, 2018 & 2025F |
| Figure 40: UAE Elevator and Escalator Market Revenue Share, By Types, 2018 & 2025F |
| Figure 41: UAE New Installation Elevator and Escalator Market Revenues & Volume, 2015-2025F ($ Million, Units) |
| Figure 42: UAE New Installation Elevator and Escalator Market Revenue Share, By Product Types, 2018 & 2025F |
| Figure 43: UAE New Installation Elevator and Escalator Market Volume Share, By Product Types, 2018 & 2025F |
| Figure 44: UAE New Installation Elevator Market Revenues & Volume, 2015-2025F ($ Million, Units) |
| Figure 45: UAE New Installation Escalator Market Revenues & Volume, 2015-2025F ($ Million, Units) |
| Figure 46: UAE Elevator and Escalator Services Market Revenues, 2015-2025F ($ Million) |
| Figure 47: UAE Elevator and Escalator Services Market Revenue Share, By Product Types, 2018 & 2025F |
| Figure 48: UAE Elevator Services Market Revenues, 2015-2025F ($ Million) |
| Figure 49: UAE Escalator Services Market Revenues, 2015-2025F ($ Million) |
| Figure 50: UAE Elevator and Escalator Market Revenue Share, By Applications, 2018 & 2025F |
| Figure 51: UAE Commercial Application Elevator and Escalator Market Revenues, 2015-2025F ($ Million) |
| Figure 52: UAE Industrial Application Elevator and Escalator Market Revenues, 2015-2025F ($ Million) |
| Figure 53: UAE Residential Application Elevator and Escalator Market Revenues, 2015-2025F ($ Million) |
| Figure 54: UAE Actual Government Spending Vs Actual Government Revenues, 2015-2024F (AED Billion) |
| Figure 55: Dubai Office Supply, 2015-2020 (Million Sq. m. of GLA) |
| Figure 56: Abu Dhabi Office Supply, 2014-2019 (Million Sq. m. of GLA) |
| Figure 57: Dubai Residential Supply, 2014-2020F (Thousand Units) |
| Figure 58: Abu Dhabi Residential Supply, 2014-2020F ( Thousand Units) |
| Figure 59: UAE Elevator and Escalator Market Revenue Share, By Company, 2018 |
| Figure 60: Qatar Elevator and Escalator Market Revenues, 2015-2025F ($ Million) |
| Figure 61: Qatar Elevator and Escalator Market Revenue Share, By Product Types, 2018 & 2025F |
| Figure 62: Qatar Elevator and Escalator Market Revenue Share, By Types, 2018 & 2025F |
| Figure 63: Qatar New Installation Elevator and Escalator Market Revenues & Volume, 2015-2025F ($ Million, Units) |
| Figure 64: Qatar New Installation Elevator and Escalator Market Revenue Share, By Product Types, 2018 & 2025F |
| Figure 65: Qatar New Installation Elevator and Escalator Market Volume Share, By Product Types, 2018 & 2025F |
| Figure 66: Qatar New Installation Elevator Market Revenues & Volume, 2015-2025F ($ Million, Units) |
| Figure 67: Qatar New Installation Escalator Market Revenues & Volume, 2015-2025F ($ Million, Units) |
| Figure 68: Qatar Elevator and Escalator Services Market Revenues, 2015-2025F ($ Million) |
| Figure 69: Qatar Elevator and Escalator Services Market Revenue Share, By Product Types, 2018 & 2025F |
| Figure 70: Qatar Elevator Services Market Revenues, 2015-2025F ($ Million) |
| Figure 71: Qatar Escalator Services Market Revenues, 2015-2025F ($ Million) |
| Figure 72: Qatar Elevator and Escalator Market Revenue Share, By Applications, 2018 & 2025F |
| Figure 73: Qatar Commercial Application Elevator and Escalator Market Revenues, 2015-2025F ($ Million) |
| Figure 74: Qatar Industrial Application Elevator and Escalator Market Revenues, 2015-2025F ($ Million) |
| Figure 75: Qatar Residential Application Elevator and Escalator Market Revenues, 2015-2025F ($ Million) |
| Figure 76: Qatar Actual Government Spending Vs Actual Government Revenues, 2015-2024F (QAR Billion) |
| Figure 77: Qatar Government Budget Spending Outlook, 2019 (QAR Billion) |
| Figure 78: Qatar Prime Apartment Supply, Prime Districts, 2012-2020 (Units) |
| Figure 79: Qatar Organized Retail Supply, 2012-2019 (sq.m. GLA) |
| Figure 80: Qatar Private Healthcare Spending, 2016 & 2026F ($ Billion) |
| Figure 81: Qatar Public Healthcare Spending, 2016 & 2026F ($ Billion) |
| Figure 82: Qatar Hotel Supply, 2015-2019 (No. of Keys) |
| Figure 83: Qatar Upcoming Mega Projects |
| Figure 84: Qatar Electricity Demand, 2014-2025 (TWh) |
| Figure 85: Qatar Elevator and Escalator Market Revenue Ranking, By Company, 2018 |
| Figure 86: Kuwait Elevator and Escalator Market Revenues, 2015-2025F ($ Million) |
| Figure 87: Kuwait Elevator and Escalator Market Revenue Share, By Product Types, 2018 & 2025F |
| Figure 88: Kuwait Elevator and Escalator Market Revenue Share, By Types, 2018 & 2025F |
| Figure 89: Kuwait New Installation Elevator and Escalator Market Revenues & Volume, 2015-2025F ($ Million, Units) |
| Figure 90: Kuwait New Installation Elevator and Escalator Market Revenue Share, By Product Types, 2018 & 2025F |
| Figure 91: Kuwait New Installation Elevator and Escalator Market Volume Share, By Product Types, 2018 & 2025F |
| Figure 92: Kuwait New Installation Elevator Market Revenues & Volume, 2015-2025F ($ Million, Units) |
| Figure 93: Kuwait New Installation Escalator Market Revenues & Volume, 2015-2025F ($ Million, Units) |
| Figure 94: Kuwait Elevator and Escalator Services Market Revenues, 2015-2025F ($ Million) |
| Figure 95: Kuwait Elevator and Escalator Services Market Revenue Share, By Product Types, 2018 & 2025F |
| Figure 96: Kuwait Elevator Services Market Revenues, 2015-2025F ($ Million) |
| Figure 97: Kuwait Escalator Services Market Revenues, 2015-2025F ($ Million) |
| Figure 98: Kuwait Elevator and Escalator Market Revenue Share, By Applications, 2018 & 2025F |
| Figure 99: Kuwait Commercial Application Elevator and Escalator Market Revenues, 2015-2025F ($ Million) |
| Figure 100: Kuwait Industrial Application Elevator and Escalator Market Revenues, 2015-2025F ($ Million) |
| Figure 101: Kuwait Residential Application Elevator and Escalator Market Revenues, 2015-2025F ($ Million) |
| Figure 102: Kuwait Actual Government Spending Vs Actual Government Revenues, 2015-2024F (KWD Billion) |
| Figure 103: Kuwait Upcoming Government Funded Transportation Projects |
| Figure 104: Kuwait Upcoming Mall Projects |
| Figure 105: Kuwait International Tourist Arrivals, 2013-29F (Thousand) |
| Figure 106: Kuwait Elevator and Escalator Market Revenue Share, By Company, 2018 |
| Figure 107: Oman Elevator and Escalator Market Revenues, 2015-2025F ($ Million) |
| Figure 108: Oman Elevator and Escalator Market Revenue Share, By Product Types, 2018 & 2025F |
| Figure 109: Oman Elevator and Escalator Market Revenue Share, By Types, 2018 & 2025F |
| Figure 110: Oman New Installation Elevator and Escalator Market Revenues & Volume, 2015-2025F ($ Million, Units) |
| Figure 111: Oman New Installation Elevator and Escalator Market Revenue Share, By Product Types, 2018 & 2025F |
| Figure 112: Oman New Installation Elevator and Escalator Market Volume Share, By Product Types, 2018 & 2025F |
| Figure 113: Oman New Installation Elevator Market Revenues & Volume, 2015-2025F ($ Million, Units) |
| Figure 114: Oman New Installation Escalator Market Revenues & Volume, 2015-2025F ($ Million, Units) |
| Figure 115: Oman Elevator and Escalator Services Market Revenues, 2015-2025F ($ Million) |
| Figure 116: Oman Elevator and Escalator Services Market Revenue Share, By Product Types, 2018 & 2025F |
| Figure 117: Oman Elevator Services Market Revenues, 2015-2025F ($ Million) |
| Figure 118: Oman Escalator Services Market Revenues, 2015-2025F ($ Million) |
| Figure 119: Oman Elevator and Escalator Market Revenue Share, By Applications, 2018 & 2025F |
| Figure 120: Oman Commercial Application Elevator and Escalator Market Revenues, 2015-2025F ($ Million) |
| Figure 121: Oman Industrial Application Elevator and Escalator Market Revenues, 2015-2025F ($ Million) |
| Figure 122: Oman Residential Application Elevator and Escalator Market Revenues, 2015-2025F ($ Million) |
| Figure 123: Oman Actual Government Spending Vs Actual Government Revenues, 2015-2024F (OMR Billion) |
| Figure 124: Oman Elevator and Escalator Market Revenue Share, By Company, 2018 |
| Figure 125: Bahrain Elevator and Escalator Market Revenues, 2015-2025F ($ Million) |
| Figure 126: Bahrain Elevator and Escalator Market Revenue Share, By Product Types, 2018 & 2025F |
| Figure 127: Bahrain Elevator and Escalator Market Revenue Share, By Types, 2018 & 2025F |
| Figure 128: Bahrain New Installation Elevator and Escalator Market Revenues & Volume, 2015-2025F ($ Million, Units) |
| Figure 129: Bahrain New Installation Elevator and Escalator Market Revenue Share, By Product Types, 2018 & 2025F |
| Figure 130: Bahrain New Installation Elevator and Escalator Market Volume Share, By Product Types, 2018 & 2025F |
| Figure 131: Bahrain New Installation Elevator Market Revenues & Volume, 2015-2025F ($ Million, Units) |
| Figure 132: Bahrain New Installation Escalator Market Revenues & Volume, 2015-2025F ($ Million, Units) |
| Figure 133: Bahrain Elevator and Escalator Services Market Revenues, 2015-2025F ($ Million) |
| Figure 134: Bahrain Elevator and Escalator Services Market Revenue Share, By Product Types, 2018 & 2025F |
| Figure 135: Bahrain Elevator Services Market Revenues, 2015-2025F ($ Million) |
| Figure 136: Bahrain Escalator Services Market Revenues, 2015-2025F ($ Million) |
| Figure 137: Bahrain Elevator and Escalator Market Revenue Share, By Applications, 2018 & 2025F |
| Figure 138: Bahrain Commercial Application Elevator and Escalator Market Revenues, 2015-2025F ($ Million) |
| Figure 139: Bahrain Industrial Application Elevator and Escalator Market Revenues, 2015-2025F ($ Million) |
| Figure 140: Bahrain Residential Application Elevator and Escalator Market Revenues, 2015-2025F ($ Million) |
| Figure 141: Bahrain Actual Government Spending Vs Actual Government Revenues, 2015-2024F (BHD Billion) |
| Figure 142: Bahrain Residential Supply Pipeline, 2017-2020 (Units) |
| Figure 143: Bahrain Residential Units Under Construction, By Submarket, 2017-2020 (Units) |
| Figure 144: Bahrain Retail Market Size, Gross Leasable Area, 2007-2019 (‘000 sq.m.) |
| Figure 145: Manama Hotel Supply, 2016-2020 (Number of Branded Hotel Keys) |
| Figure 146: Bahrain Elevator and Escalator Market Revenue Share, By Company, 2018 |
| Figure 147: Iraq Elevator and Escalator Market Revenues, 2015-2025F ($ Million) |
| Figure 148: Iraq Elevator and Escalator Market Revenue Share, By Product Types, 2018 & 2025F |
| Figure 149: Iraq Elevator and Escalator Market Revenue Share, By Types, 2018 & 2025F |
| Figure 150: Iraq New Installation Elevator and Escalator Market Revenues & Volume, 2015-2025F ($ Million, Units) |
| Figure 151: Iraq New Installation Elevator and Escalator Market Revenue Share, By Product Types, 2018 & 2025F |
| Figure 152: Iraq New Installation Elevator and Escalator Market Volume Share, By Product Types, 2018 & 2025F |
| Figure 153: Iraq New Installation Elevator Market Revenues & Volume, 2015-2025F ($ Million, Units) |
| Figure 154: Iraq New Installation Escalator Market Revenues & Volume, 2015-2025F ($ Million, Units) |
| Figure 155: Iraq Elevator and Escalator Services Market Revenues, 2015-2025F ($ Million) |
| Figure 156: Iraq Elevator and Escalator Services Market Revenue Share, By Product Types, 2018 & 2025F |
| Figure 157: Iraq Elevator Services Market Revenues, 2015-2025F ($ Million) |
| Figure 158: Iraq Escalator Services Market Revenues, 2015-2025F ($ Million) |
| Figure 159: Iraq Elevator and Escalator Market Revenue Share, By Applications, 2018 & 2025F |
| Figure 160: Iraq Commercial Application Elevator and Escalator Market Revenues, 2015-2025F ($ Million) |
| Figure 161: Iraq Industrial Application Elevator and Escalator Market Revenues, 2015-2025F ($ Million) |
| Figure 162: Iraq Residential Application Elevator and Escalator Market Revenues, 2015-2025F ($ Million) |
| Figure 163: Iraq Actual Government Spending Vs Actual Government Revenues, 2015-2024F (IQD Trillion) |
| Figure 164: Iraq Elevator and Escalator Market Revenue Rankings, By Company, 2018 |
| Figure 165: Jordan Elevator and Escalator Market Revenues, 2015-2025F ($ Million) |
| Figure 166: Jordan Elevator and Escalator Market Revenue Share, By Product Types, 2018 & 2025F |
| Figure 167: Jordan Elevator and Escalator Market Revenue Share, By Types, 2018 & 2025F |
| Figure 168: Jordan New Installation Elevator and Escalator Market Revenues & Volume, 2015-2025F ($ Million, Units) |
| Figure 169: Jordan New Installation Elevator and Escalator Market Revenue Share, By Product Types, 2018 & 2025F |
| Figure 170: Jordan New Installation Elevator and Escalator Market Volume Share, By Product Types, 2018 & 2025F |
| Figure 171: Jordan New Installation Elevator Market Revenues & Volume, 2015-2025F ($ Million, Units) |
| Figure 172: Jordan New Installation Escalator Market Revenues & Volume, 2015-2025F ($ Million, Units) |
| Figure 173: Jordan Elevator and Escalator Services Market Revenues, 2015-2025F ($ Million) |
| Figure 174: Jordan Elevator and Escalator Services Market Revenue Share, By Product Types, 2018 & 2025F |
| Figure 175: Jordan Elevator Services Market Revenues, 2015-2025F ($ Million) |
| Figure 176: Jordan Escalator Services Market Revenues, 2015-2025F ($ Million) |
| Figure 177: Jordan Elevator and Escalator Market Revenue Share, By Applications, 2018 & 2025F |
| Figure 178: Jordan Commercial Application Elevator and Escalator Market Revenues, 2015-2025F ($ Million) |
| Figure 179: Jordan Industrial Application Elevator and Escalator Market Revenues, 2015-2025F ($ Million) |
| Figure 180: Jordan Residential Application Elevator and Escalator Market Revenues, 2015-2025F ($ Million) |
| Figure 181: Jordan Actual Government Spending Vs Actual Government Revenues, 2015-2024F (JOD Billion) |
| Figure 182: Jordan Elevator and Escalator Market Revenue Rankings, By Company, 2018 |
| Figure 183: Turkey Elevator and Escalator Market Revenues, 2015-2025F ($ Million) |
| Figure 184: Turkey Elevator and Escalator Market Revenue Share, By Product Types, 2018 & 2025F |
| Figure 185: Turkey Elevator and Escalator Market Revenue Share, By Types, 2018 & 2025F |
| Figure 186: Turkey New Installation Elevator and Escalator Market Revenues & Volume, 2015-2025F ($ Million, Units) |
| Figure 187: Turkey New Installation Elevator and Escalator Market Revenue Share, By Product Types, 2018 & 2025F |
| Figure 188: Turkey New Installation Elevator and Escalator Market Volume Share, By Product Types, 2018 & 2025F |
| Figure 189: Turkey New Installation Elevator Market Revenues & Volume, 2015-2025F ($ Million, Units) |
| Figure 190: Turkey New Installation Escalator Market Revenues & Volume, 2015-2025F ($ Million, Units) |
| Figure 191: Turkey Elevator and Escalator Services Market Revenues, 2015-2025F ($ Million) |
| Figure 192: Turkey Elevator and Escalator Services Market Revenue Share, By Product Types, 2018 & 2025F |
| Figure 193: Turkey Elevator Services Market Revenues, 2015-2025F ($ Million) |
| Figure 194: TurkeyEscalator Services Market Revenues, 2015-2025F ($ Million) |
| Figure 195: Turkey Elevator and Escalator Market Revenue Share, By Applications, 2018 & 2025F |
| Figure 196: Turkey Commercial Application Elevator and Escalator Market Revenues, 2015-2025F ($ Million) |
| Figure 197: Turkey Industrial Application Elevator and Escalator Market Revenues, 2015-2025F ($ Million) |
| Figure 198: Turkey Residential Application Elevator and Escalator Market Revenues, 2015-2025F ($ Million) |
| Figure 199: Turkey Actual Government Spending Vs Actual Government Revenues, 2015-2024F (TRY Trillion) |
| Figure 200: Turkey Infrastructure Investment Forecast, 2018-2040 ($ Billion) |
| Figure 201: Turkey Infrastructure Investment Forecast, By Sector, 2016-2040 ($ Billion) |
| Figure 202: Turkey Elevator and Escalator Market Revenue Share, By Company, 2018 |
| Figure 203: Rest of Middle East Elevator and Escalator Market Revenues, 2015-2025F ($ Million) |
| Figure 204: North America Elevator and Escalator Market Revenues, 2015-2025F ($ Billion) |
| Figure 205: North America Elevator and Escalator Market Revenue Share, By Countries, 2018 & 2025F |
| Figure 206: USA Elevator and Escalator Market Revenues, 2015-2025F ($ Billion) |
| Figure 207: USA Elevator and Escalator Market Revenue Share, By Product Types, 2018 & 2025F |
| Figure 208: USA Elevator and Escalator Market Revenue Share, By Types, 2018 & 2025F |
| Figure 209: US New Installation Elevator and Escalator Market Revenues & Volume, 2015-2025F ($ Billion, Thousand Units) |
| Figure 210: USA New Installation Elevator and Escalator Market Revenue Share, By Product Types, 2018 & 2025F |
| Figure 211: USA New Installation Elevator and Escalator Market Volume Share, By Product Types, 2018 & 2025F |
| Figure 212: US New Installation Elevator Market Revenues & Volume, 2015-2025F ($ Billion, Thousand Units) |
| Figure 213: US New Installation Escalator Market Revenues & Volume, 2015-2025F ($ Million, Thousand Units) |
| Figure 214: USA Elevator and Escalator Services Market Revenues, 2015-2025F ($ Billion) |
| Figure 215: USA Elevator and Escalator Services Market Revenue Share, By Product Types, 2018 & 2025F |
| Figure 216: USA Elevator Services Market Revenues, 2015-2025F ($ Billion) |
| Figure 217: USA Escalator Services Market Revenues, 2015-2025F ($ Million) |
| Figure 218: USA Elevator and Escalator Market Revenue Share, By Applications, 2018 & 2025F |
| Figure 219: USA Commercial Application Elevator and Escalator Market Revenues, 2015-2025F ($ Billion) |
| Figure 220: USA Industrial Application Elevator and Escalator Market Revenues, 2015-2025F ($ Million) |
| Figure 221: USA Residential Application Elevator and Escalator Market Revenues, 2015-2025F ($ Million) |
| Figure 222: USA Actual Government Spending Vs Actual Government Revenues, 2015-2024F (USD Trillion) |
| Figure 223: USA Elevator and Escalator Market Revenue Rankings, By Company, 2018 |
| Figure 224: Canada Elevator and Escalator Market Revenues, 2015-2025F ($ Billion) |
| Figure 225: Canada Elevator and Escalator Market Revenue Share, By Product Types, 2018 & 2025F |
| Figure 226: Canada Elevator and Escalator Market Revenue Share, By Types, 2018 & 2025F |
| Figure 227: Canada New Installation Elevator and Escalator Market Revenues & Volume, 2015-2025F ($ Million, Thousand Units) |
| Figure 228: Canada New Installation Elevator and Escalator Market Revenue Share, By Product Types, 2018 & 2025F |
| Figure 229: Canada New Installation Elevator and Escalator Market Volume Share, By Product Types, 2018 & 2025F |
| Figure 230: Canada New Installation Elevator Market Revenues & Volume, 2015-2025F ($ Million, Thousand Units) |
| Figure 231: Canada New Installation Escalator Market Revenues & Volume, 2015-2025F ($ Million, Thousand Units) |
| Figure 232: Canada Elevator and Escalator Services Market Revenues, 2015-2025F ($ Million) |
| Figure 233: Canada Elevator and Escalator Services Market Revenue Share, By Product Types, 2018 & 2025F |
| Figure 234: Canada Elevator Services Market Revenues, 2015-2025F ($ Million) |
| Figure 235: Canada Escalator Services Market Revenues, 2015-2025F ($ Million) |
| Figure 236: Canada Elevator and Escalator Market Revenue Share, By Applications, 2018 & 2025F |
| Figure 237: Canada Commercial Application Elevator and Escalator Market Revenues, 2015-2025F ($ Million) |
| Figure 238: Canada Industrial Application Elevator and Escalator Market Revenues, 2015-2025F ($ Million) |
| Figure 239: Canada Residential Application Elevator and Escalator Market Revenues, 2015-2025F ($ Million) |
| Figure 240: Canada Actual Government Spending Vs Actual Government Revenues, 2015-2024F (CAD Trillion) |
| Figure 241: Canada Elevator and Escalator Market Revenue Rankings, By Company, 2018 |
| Figure 242: Latin America Elevator and Escalator Market Revenues, 2015-2025F ($ Million) |
| Figure 243: Latin America Elevator and Escalator Market Revenue Share, By Countries, 2018 & 2025F |
| Figure 244: Mexico Elevator and Escalator Market Revenues, 2015-2025F ($ Million) |
| Figure 245: Mexico Elevator and Escalator Market Revenue Share, By Product Types, 2018 & 2025F |
| Figure 246: Mexico Elevator and Escalator Market Revenue Share, By Types, 2018 & 2025F |
| Figure 247: Mexico New Installation Elevator and Escalator Market Revenues & Volume, 2015-2025F ($ Million, ‘000 Units) |
| Figure 248: Mexico New Installation Elevator and Escalator Market Revenue Share, By Product Types, 2018 & 2025F |
| Figure 249: Mexico New Installation Elevator and Escalator Market Volume Share, By Product Types, 2018 & 2025F |
| Figure 250: Mexico New Installation Elevator Market Revenues & Volume, 2015-2025F ($ Million, ‘000 Units) |
| Figure 251: Mexico New Installation Escalator Market Revenues & Volume, 2015-2025F ($ Million, Units) |
| Figure 252: Mexico Elevator and Escalator Services Market Revenues, 2015-2025F ($ Million) |
| Figure 253: Mexico Elevator and Escalator Services Market Revenue Share, By Product Types, 2018 & 2025F |
| Figure 254: Mexico Elevator Services Market Revenues, 2015-2025F ($ Million) |
| Figure 255: Mexico Escalator Services Market Revenues, 2015-2025F ($ Million) |
| Figure 256: Mexico Elevator and Escalator Market Revenue Share, By Applications, 2018 & 2025F |
| Figure 257: Mexico Commercial Application Elevator and Escalator Market Revenues, 2015-2025F ($ Million) |
| Figure 258: Mexico Industrial Application Elevator and Escalator Market Revenues, 2015-2025F ($ Million) |
| Figure 259: Mexico Residential Application Elevator and Escalator Market Revenues, 2015-2025F ($ Million) |
| Figure 260: Mexico Actual Government Spending Vs Actual Government Revenues, 2015-2024F (Mexican Peso Trillion) |
| Figure 261: Mexico Elevator and Escalator Market Revenue Share, By Company, 2018 |
| Figure 262: Brazil Elevator and Escalator Market Revenues, 2015-2025F ($ Million) |
| Figure 263: Brazil Elevator and Escalator Market Revenue Share, By Product Types, 2018 & 2025F |
| Figure 264: Brazil Elevator and Escalator Market Revenue Share, By Types, 2018 & 2025F |
| Figure 265: Brazil New Installation Elevator and Escalator Market Revenues & Volume, 2015-2025F ($ Million, ‘000 Units) |
| Figure 266: Brazil New Installation Elevator and Escalator Market Revenue Share, By Product Types, 2018 & 2025F |
| Figure 267: Brazil New Installation Elevator and Escalator Market Volume Share, By Product Types, 2018 & 2025F |
| Figure 268: Brazil New Installation Elevator Market Revenues & Volume, 2015-2025F ($ Million, ‘000 Units) |
| Figure 269: Brazil New Installation Escalator Market Revenues & Volume, 2015-2025F ($ Million, Units) |
| Figure 270: Brazil Elevator and Escalator Services Market Revenues, 2015-2025F ($ Million) |
| Figure 271: Brazil Elevator and Escalator Services Market Revenue Share, By Product Types, 2018 & 2025F |
| Figure 272: Brazil Elevator Services Market Revenues, 2015-2025F ($ Million) |
| Figure 273: Brazil Escalator Services Market Revenues, 2015-2025F ($ Million) |
| Figure 274: Brazil Elevator and Escalator Market Revenue Share, By Applications, 2018 & 2025F |
| Figure 275: Brazil Commercial Application Elevator and Escalator Market Revenues, 2015-2025F ($ Million) |
| Figure 276: Brazil Industrial Application Elevator and Escalator Market Revenues, 2015-2025F ($ Million) |
| Figure 277: Brazil Residential Application Elevator and Escalator Market Revenues, 2015-2025F ($ Million) |
| Figure 278: Brazil Actual Government Spending Vs Actual Government Revenues, 2015-2024F (Brazilian Real Billion) |
| Figure 279: Brazil Elevator and Escalator Market Revenue Share, By Company, 2018 |
| Figure 280: Argentina Elevator and Escalator Market Revenues, 2015-2025F ($ Million) |
| Figure 281: Argentina Elevator and Escalator Market Revenue Share, By Product Types, 2018 & 2025F |
| Figure 282: Argentina Elevator and Escalator Market Revenue Share, By Types, 2018 & 2025F |
| Figure 283: Argentina New Installation Elevator and Escalator Market Revenues & Volume, 2015-2025F ($ Million, Units) |
| Figure 284: Argentina New Installation Elevator and Escalator Market Revenue Share, By Product Types, 2018 & 2025F |
| Figure 285: Argentina New Installation Elevator and Escalator Market Volume Share, By Product Types, 2018 & 2025F |
| Figure 286: Argentina New Installation Elevator Market Revenues & Volume, 2015-2025F ($ Million, Units) |
| Figure 287: Argentina New Installation Escalator Market Revenues & Volume, 2015-2025F ($ Million, Units) |
| Figure 288: Argentina Elevator and Escalator Services Market Revenues, 2015-2025F ($ Million) |
| Figure 289: Argentina Elevator and Escalator Services Market Revenue Share, By Product Types, 2018 & 2025F |
| Figure 290: Argentina Elevator Services Market Revenues, 2015-2025F ($ Million) |
| Figure 291: Argentina Escalator Services Market Revenues, 2015-2025F ($ Million) |
| Figure 292: Argentina Elevator and Escalator Market Revenue Share, By Applications, 2018 & 2025F |
| Figure 293: Argentina Commercial Application Elevator and Escalator Market Revenues, 2015-2025F ($ Million) |
| Figure 294: Argentina Industrial Application Elevator and Escalator Market Revenues, 2015-2025F ($ Million) |
| Figure 295: Argentina Residential Application Elevator and Escalator Market Revenues, 2015-2025F ($ Million) |
| Figure 296: Argentina Actual Government Spending Vs Actual Government Revenues, 2015-2024F (ARS Trillion) |
| Figure 297: Argentina Elevator and Escalator Market Revenue Share, By Company, 2018 |
| Figure 298: Rest of Latin America Elevator and Escalator Market Revenues, 2015-2025F ($ Million) |
| Figure 299: Europe Elevator and Escalator Market Revenues, 2015-2025F ($ Billion) |
| Figure 300: Europe Elevator and Escalator Market Revenue Share, By Countries, 2018 & 2025F |
| Figure 301: United Kingdom Elevator and Escalator Market Revenues, 2015-2025F ($ Million) |
| Figure 302: United Kingdom Elevator and Escalator Market Revenue Share, By Product Types, 2018 & 2025F |
| Figure 303: United Kingdom Elevator and Escalator Market Revenue Share, By Types, 2018 & 2025F |
| Figure 304: United Kingdom New Installation Elevator and Escalator Market Revenues & Volume, 2015-2025F ($ Million, Thousand Units) |
| Figure 305: United Kingdom New Installation Elevator and Escalator Market Revenue Share, By Product Types, 2018 & 2025F |
| Figure 306: United Kingdom New Installation Elevator and Escalator Market Volume Share, By Product Types, 2018 & 2025F |
| Figure 307: United Kingdom New Installation Elevator Market Revenues & Volume, 2015-2025F ($ Million, Thousand Units) |
| Figure 308: United Kingdom New Installation Escalator Market Revenues & Volume, 2015-2025F ($ Million, Units) |
| Figure 309: United Kingdom Elevator and Escalator Services Market Revenues, 2015-2025F ($ Million) |
| Figure 310: United Kingdom Elevator and Escalator Services Market Revenue Share, By Product Types, 2018 & 2025F |
| Figure 311: United Kingdom Elevator Services Market Revenues, 2015-2025F ($ Million) |
| Figure 312: United Kingdom Escalator Services Market Revenues, 2015-2025F ($ Million) |
| Figure 313: United Kingdom Elevator and Escalator Market Revenue Share, By Applications, 2018 & 2025F |
| Figure 314: United Kingdom Commercial Application Elevator and Escalator Market Revenues, 2015-2025F ($ Million) |
| Figure 315: United Kingdom Industrial Application Elevator and Escalator Market Revenues, 2015-2025F ($ Million) |
| Figure 316: United Kingdom Residential Application Elevator and Escalator Market Revenues, 2015-2025F ($ Million) |
| Figure 317: United Kingdom Actual Government Spending Vs Actual Government Revenues, 2015-2024F (GBP Trillion) |
| Figure 318: United Kingdom Elevator and Escalator Market Revenue Rankings, By Company, 2018 |
| Figure 319: Germany Elevator and Escalator Market Revenues, 2015-2025F ($ Million) |
| Figure 320: Germany Elevator and Escalator Market Revenue Share, By Product Types, 2018 & 2025F |
| Figure 321: Germany Elevator and Escalator Market Revenue Share, By Types, 2018 & 2025F |
| Figure 322: Germany New Installation Elevator and Escalator Market Revenues & Volume, 2015-2025F ($ Million, Units) |
| Figure 323: Germany New Installation Elevator and Escalator Market Revenue Share, By Product Types, 2018 & 2025F |
| Figure 324: Germany New Installation Elevator and Escalator Market Volume Share, By Product Types, 2018 & 2025F |
| Figure 325: Germany New Installation Elevator Market Revenues & Volume, 2015-2025F ($ Million, Units) |
| Figure 326: Germany New Installation Escalator Market Revenues & Volume, 2015-2025F ($ Million, Units) |
| Figure 327: Germany Elevator and Escalator Services Market Revenues, 2015-2025F ($ Million) |
| Figure 328: Germany Elevator and Escalator Services Market Revenue Share, By Product Types, 2018 & 2025F |
| Figure 329: Germany Elevator Services Market Revenues, 2015-2025F ($ Million) |
| Figure 330: Germany Escalator Services Market Revenues, 2015-2025F ($ Million) |
| Figure 331: Germany Elevator and Escalator Market Revenue Share, By Applications, 2018 & 2025F |
| Figure 332: Germany Commercial Application Elevator and Escalator Market Revenues, 2015-2025F ($ Million) |
| Figure 333: Germany Industrial Application Elevator and Escalator Market Revenues, 2015-2025F ($ Million) |
| Figure 334: Germany Residential Application Elevator and Escalator Market Revenues, 2015-2025F ($ Million) |
| Figure 335: Germany Actual Government Spending Vs Actual Government Revenues, 2015-2024F (Euro Trillion) |
| Figure 336: Italy Elevator and Escalator Market Revenues, 2015-2025F ($ Million) |
| Figure 337: Italy Elevator and Escalator Market Revenue Share, By Product Types, 2018 & 2025F |
| Figure 338: Italy Elevator and Escalator Market Revenue Share, By Types, 2018 & 2025F |
| Figure 339: Italy New Installation Elevator and Escalator Market Revenues & Volume, 2015-2025F ($ Million, Thousand Units) |
| Figure 340: Italy New Installation Elevator and Escalator Market Revenue Share, By Product Types, 2018 & 2025F |
| Figure 341: Italy New Installation Elevator and Escalator Market Volume Share, By Product Types, 2018 & 2025F |
| Figure 342: Italy New Installation Elevator Market Revenues & Volume, 2015-2025F ($ Million, Thousand Units) |
| Figure 343: Italy New Installation Escalator Market Revenues & Volume, 2015-2025F ($ Million, Units) |
| Figure 344: Italy Elevator and Escalator Services Market Revenues, 2015-2025F ($ Million) |
| Figure 345: Italy Elevator and Escalator Services Market Revenue Share, By Product Types, 2018 & 2025F |
| Figure 346: Italy Elevator Services Market Revenues, 2015-2025F ($ Million) |
| Figure 347: Italy Escalator Services Market Revenues, 2015-2025F ($ Million) |
| Figure 348: Italy Elevator and Escalator Market Revenue Share, By Applications, 2018 & 2025F |
| Figure 349: Italy Commercial Application Elevator and Escalator Market Revenues, 2015-2025F ($ Million) |
| Figure 350: Italy Industrial Application Elevator and Escalator Market Revenues, 2015-2025F ($ Million) |
| Figure 351: Italy Residential Application Elevator and Escalator Market Revenues, 2015-2025F ($ Million) |
| Figure 352: Italy Actual Government Spending Vs Actual Government Revenues, 2015-2024F (Euro Trillion) |
| Figure 353: Italy Elevator and Escalator Market Revenue Rankings, By Company, 2018 |
| Figure 354: France Elevator and Escalator Market Revenues, 2015-2025F ($ Million) |
| Figure 355: France Elevator and Escalator Market Revenue Share, By Product Types, 2018 & 2025F |
| Figure 356: France Elevator and Escalator Market Revenue Share, By Types, 2018 & 2025F |
| Figure 357: France New Installation Elevator and Escalator Market Revenues & Volume, 2015-2025F ($ Million, Units) |
| Figure 358: France New Installation Elevator and Escalator Market Revenue Share, By Product Types, 2018 & 2025F |
| Figure 359: France New Installation Elevator and Escalator Market Volume Share, By Product Types, 2018 & 2025F |
| Figure 360: France New Installation Elevator Market Revenues & Volume, 2015-2025F ($ Million, Units) |
| Figure 361: France New Installation Escalator Market Revenues & Volume, 2015-2025F ($ Million, Units) |
| Figure 362: France Elevator and Escalator Services Market Revenues, 2015-2025F ($ Million) |
| Figure 363: France Elevator and Escalator Services Market Revenue Share, By Product Types, 2018 & 2025F |
| Figure 364: France Elevator Services Market Revenues, 2015-2025F ($ Million) |
| Figure 365: France Escalator Services Market Revenues, 2015-2025F ($ Million) |
| Figure 366: France Elevator and Escalator Market Revenue Share, By Applications, 2018 & 2025F |
| Figure 367: France Commercial Application Elevator and Escalator Market Revenues, 2015-2025F ($ Million) |
| Figure 368: France Industrial Application Elevator and Escalator Market Revenues, 2015-2025F ($ Million) |
| Figure 369: France Residential Application Elevator and Escalator Market Revenues, 2015-2025F ($ Million) |
| Figure 370: France Actual Government Spending Vs Actual Government Revenues, 2015-2024F (Euro Trillion) |
| Figure 371: Spain Elevator and Escalator Market Revenues, 2015-2025F ($ Million) |
| Figure 372: Spain Elevator and Escalator Market Revenue Share, By Product Types, 2018 & 2025F |
| Figure 373: Spain Elevator and Escalator Market Revenue Share, By Types, 2018 & 2025F |
| Figure 374: Spain New Installation Elevator and Escalator Market Revenues & Volume, 2015-2025F ($ Million, Thousand Units) |
| Figure 375: Spain New Installation Elevator and Escalator Market Revenue Share, By Product Types, 2018 & 2025F |
| Figure 376: Spain New Installation Elevator and Escalator Market Volume Share, By Product Types, 2018 & 2025F |
| Figure 377: Spain New Installation Elevator Market Revenues & Volume, 2015-2025F ($ Million, Thousand Units) |
| Figure 378: Spain New Installation Escalator Market Revenues & Volume, 2015-2025F ($ Million, Units) |
| Figure 379: Spain Elevator and Escalator Services Market Revenues, 2015-2025F ($ Million) |
| Figure 380: Spain Elevator and Escalator Services Market Revenue Share, By Product Types, 2018 & 2025F |
| Figure 381: Spain Elevator Services Market Revenues, 2015-2025F ($ Million) |
| Figure 382: Spain Escalator Services Market Revenues, 2015-2025F ($ Million) |
| Figure 383: Spain Elevator and Escalator Market Revenue Share, By Applications, 2018 & 2025F |
| Figure 384: Spain Commercial Application Elevator and Escalator Market Revenues, 2015-2025F ($ Million) |
| Figure 385: Spain Industrial Application Elevator and Escalator Market Revenues, 2015-2025F ($ Million) |
| Figure 386: Spain Residential Application Elevator and Escalator Market Revenues, 2015-2025F ($ Million) |
| Figure 387: Spain Actual Government Spending Vs Actual Government Revenues, 2015-2024F (Euro Billion) |
| Figure 388: Spain Elevator and Escalator Market Revenue Share, By Company, 2018 |
| Figure 389: Eastern Europe Elevator and Escalator Market Revenues, 2015-2025F ($ Billion) |
| Figure 390: Eastern Europe Elevator and Escalator Market Revenue Share, By Product Types, 2018 & 2025F |
| Figure 391: Eastern Europe Elevator and Escalator Market Revenue Share, By Types, 2018 & 2025F |
| Figure 392: Eastern Europe New Installation Elevator and Escalator Market Revenues & Volume, 2015-2025F ($ Billion, Thousand Units) |
| Figure 393: Eastern Europe New Installation Elevator and Escalator Market Revenue Share, By Product Types, 2018 & 2025F |
| Figure 394: Eastern Europe New Installation Elevator and Escalator Market Volume Share, By Product Types, 2018 & 2025F |
| Figure 395: Eastern Europe New Installation Elevator Market Revenues & Volume, 2015-2025F ($ Million, Thousand Units) |
| Figure 396: Eastern Europe New Installation Escalator Market Revenues & Volume, 2015-2025F ($ Million, Thousand Units) |
| Figure 397: Eastern Europe Elevator and Escalator Services Market Revenues, 2015-2025F ($ Million) |
| Figure 398: Eastern Europe Elevator and Escalator Services Market Revenue Share, By Product Types, 2018 & 2025F |
| Figure 399: Eastern Europe Elevator Services Market Revenues, 2015-2025F ($ Million) |
| Figure 400: Eastern Europe Escalator Services Market Revenues, 2015-2025F ($ Million) |
| Figure 401: Eastern Europe Elevator and Escalator Market Revenue Share, By Applications, 2018 & 2025F |
| Figure 402: Eastern Europe Commercial Application Elevator and Escalator Market Revenues, 2015-2025F ($ Billion) |
| Figure 403: Eastern Europe Industrial Application Elevator and Escalator Market Revenues, 2015-2025F ($ Million) |
| Figure 404: Eastern Europe Residential Application Elevator and Escalator Market Revenues, 2015-2025F ($ Million) |
| Figure 405: Eastern Europe Regional Indicators |
| Figure 406: Rest of Europe Elevator and Escalator Market Revenues, 2015-2025F ($ Billion) |
| Figure 407: Africa Elevator and Escalator Market Revenues, 2015-2025F ($ Million) |
| Figure 408: Africa Elevator and Escalator Market Revenue Share, By Countries, 2018 & 2025F |
| Figure 409: Algeria Elevator and Escalator Market Revenues, 2015-2025F ($ Million) |
| Figure 410: Algeria Elevator and Escalator Market Revenue Share, By Product Types, 2018 & 2025F |
| Figure 411: Algeria Elevator and Escalator Market Revenue Share, By Types, 2018 & 2025F |
| Figure 412: Algeria New Installation Elevator and Escalator Market Revenues & Volume, 2015-2025F ($ Million, Units) |
| Figure 413: Algeria New Installation Elevator and Escalator Market Revenue Share, By Product Types, 2018 & 2025F |
| Figure 414: Algeria New Installation Elevator and Escalator Market Volume Share, By Product Types, 2018 & 2025F |
| Figure 415: Algeria New Installation Elevator Market Revenues & Volume, 2015-2025F ($ Million, Units) |
| Figure 416: Algeria New Installation Escalator Market Revenues & Volume, 2015-2025F ($ Million, Units) |
| Figure 417: Algeria Elevator and Escalator Services Market Revenues, 2015-2025F ($ Million) |
| Figure 418: Algeria Elevator and Escalator Services Market Revenue Share, By Product Types, 2018 & 2025F |
| Figure 419: Algeria Elevator Services Market Revenues, 2015-2025F ($ Million) |
| Figure 420: Algeria Escalator Services Market Revenues, 2015-2025F ($ Million) |
| Figure 421: Algeria Elevator and Escalator Market Revenue Share, By Applications, 2018 & 2025F |
| Figure 422: Algeria Commercial Application Elevator and Escalator Market Revenues, 2015-2025F ($ Million) |
| Figure 423: Algeria Industrial Application Elevator and Escalator Market Revenues, 2015-2025F ($ Million) |
| Figure 424: Algeria Residential Application Elevator and Escalator Market Revenues, 2015-2025F ($ Million) |
| Figure 425: Algeria Actual Government Spending Vs Actual Government Revenues, 2015-2024F (DZD Trillion) |
| Figure 426: Algeria Government Funded Commercial Projects |
| Figure 427: Algeria Travel and Tourism Direct Contribution to GDP, 2012-2018 (Algerian Dinar Billion) |
| Figure 428: Algeria Travel & Tourism Contribution To GDP, Business Vs Leisure, 2017 |
| Figure 429: Algeria Travel & Tourism Contribution To GDP, Domestic Vs Foreign, 2017 |
| Figure 430: Algeria Elevator and Escalator Market Revenue Rankings, By Company, 2018 |
| Figure 431: Egypt Elevator and Escalator Market Revenues, 2015-2025F ($ Million) |
| Figure 432: Egypt Elevator and Escalator Market Revenue Share, By Product Types, 2018 & 2025F |
| Figure 433: Egypt Elevator and Escalator Market Revenue Share, By Types, 2018 & 2025F |
| Figure 434: Egypt New Installation Elevator and Escalator Market Revenues & Volume, 2015-2025F ($ Million, Units) |
| Figure 435: Egypt New Installation Elevator and Escalator Market Revenue Share, By Product Types, 2018 & 2025F |
| Figure 436: Egypt New Installation Elevator and Escalator Market Volume Share, By Product Types, 2018 & 2025F |
| Figure 437: Egypt New Installation Elevator Market Revenues & Volume, 2015-2025F ($ Million, Units) |
| Figure 438: Egypt New Installation Escalator Market Revenues & Volume, 2015-2025F ($ Million, Units) |
| Figure 439: Egypt Elevator and Escalator Services Market Revenues, 2015-2025F ($ Million) |
| Figure 440: Egypt Elevator and Escalator Services Market Revenue Share, By Product Types, 2018 & 2025F |
| Figure 441: Egypt Elevator Services Market Revenues, 2015-2025F ($ Million) |
| Figure 442: Egypt Escalator Services Market Revenues, 2015-2025F ($ Million) |
| Figure 443: Egypt Elevator and Escalator Market Revenue Share, By Applications, 2018 & 2025F |
| Figure 444: Egypt Commercial Application Elevator and Escalator Market Revenues, 2015-2025F ($ Million) |
| Figure 445: Egypt Industrial Application Elevator and Escalator Market Revenues, 2015-2025F ($ Million) |
| Figure 446: Egypt Residential Application Elevator and Escalator Market Revenues, 2015-2025F ($ Million) |
| Figure 447: Egypt Actual Government Spending Vs Actual Government Revenues, 2015-2024F (EGP Trillion) |
| Figure 448: Egypt Tourism Industry Market Size, 2010-2019F ($ Billion) |
| Figure 449: Egypt Elevator and Escalator Market Revenue Share, By Company, 2018 |
| Figure 450: Nigeria Elevator and Escalator Market Revenues, 2015-2025F ($ Million) |
| Figure 451: Nigeria Elevator and Escalator Market Revenue Share, By Product Types, 2018 & 2025F |
| Figure 452: Nigeria Elevator and Escalator Market Revenue Share, By Types, 2018 & 2025F |
| Figure 453: Nigeria New Installation Elevator and Escalator Market Revenues & Volume, 2015-2025F ($ Million, Units) |
| Figure 454: Nigeria New Installation Elevator and Escalator Market Revenue Share, By Product Types, 2018 & 2025F |
| Figure 455: Nigeria New Installation Elevator and Escalator Market Volume Share, By Product Types, 2018 & 2025F |
| Figure 456: Nigeria New Installation Elevator Market Revenues & Volume, 2015-2025F ($ Million, Units) |
| Figure 457: Nigeria New Installation Escalator Market Revenues & Volume, 2015-2025F ($ Million, Units) |
| Figure 458: Nigeria Elevator and Escalator Services Market Revenues, 2015-2025F ($ Million) |
| Figure 459: Nigeria Elevator and Escalator Services Market Revenue Share, By Product Types, 2018 & 2025F |
| Figure 460: Nigeria Elevator Services Market Revenues, 2015-2025F ($ Million) |
| Figure 461: Nigeria Escalator Services Market Revenues, 2015-2025F ($ Million) |
| Figure 462: Nigeria Elevator and Escalator Market Revenue Share, By Applications, 2018 & 2025F |
| Figure 463: Nigeria Commercial Application Elevator and Escalator Market Revenues, 2015-2025F ($ Million) |
| Figure 464: Nigeria Industrial Application Elevator and Escalator Market Revenues, 2015-2025F ($ Million) |
| Figure 465: Nigeria Residential Application Elevator and Escalator Market Revenues, 2015-2025F ($ Million) |
| Figure 466: Nigeria Actual Government Spending Vs Actual Government Revenues, 2015-2023F (RAND Trillion) |
| Figure 467: Nigeria Elevator and Escalator Market Revenue Share, By Company, 2018 |
| Figure 468: South Africa Elevator and Escalator Market Revenues, 2015-2025F ($ Million) |
| Figure 469: South Africa Elevator and Escalator Market Revenue Share, By Product Types, 2018 & 2025F |
| Figure 470: South Africa Elevator and Escalator Market Revenue Share, By Types, 2018 & 2025F |
| Figure 471: South Africa New Installation Elevator and Escalator Market Revenues & Volume, 2015-2025F ($ Million, Units) |
| Figure 472: South Africa New Installation Elevator and Escalator Market Revenue Share, By Product Types, 2018 & 2025F |
| Figure 473: South Africa New Installation Elevator and Escalator Market Volume Share, By Product Types, 2018 & 2025F |
| Figure 474: South Africa New Installation Elevator Market Revenues & Volume, 2015-2025F ($ Million, Units) |
| Figure 475: South Africa New Installation Escalator Market Revenues & Volume, 2015-2025F ($ Million, Units) |
| Figure 476: South Africa Elevator and Escalator Services Market Revenues, 2015-2025F ($ Million) |
| Figure 477: South Africa Elevator and Escalator Services Market Revenue Share, By Product Types, 2018 & 2025F |
| Figure 478: South Africa Elevator Services Market Revenues, 2015-2025F ($ Million) |
| Figure 479: South Africa Escalator Services Market Revenues, 2015-2025F ($ Million) |
| Figure 480: South Africa Elevator and Escalator Market Revenue Share, By Applications, 2018 & 2025F |
| Figure 481: South Africa Commercial Application Elevator and Escalator Market Revenues, 2015-2025F ($ Million) |
| Figure 482: South Africa Industrial Application Elevator and Escalator Market Revenues, 2015-2025F ($ Million) |
| Figure 483: South Africa Residential Application Elevator and Escalator Market Revenues, 2015-2025F ($ Million) |
| Figure 484: South Africa Actual Government Spending Vs Actual Government Revenues, 2015-2023F (RAND Trillion) |
| Figure 485: South Africa Government Budget Spending Outlook, 2018 ($ Billion) |
| Figure 486: South Africa Total Hotel Room Revenues, 2015-2022F (RAND Million) |
| Figure 487: South Africa Public Sector Infrastructure Expenditure, FY2015-2021 (Billion Rand) |
| Figure 488: South Africa Elevator and Escalator Market Revenue Share, By Company, 2018 |
| Figure 489: Kenya Elevator and Escalator Market Revenues, 2015-2025F ($ Million) |
| Figure 490: Kenya Elevator and Escalator Market Revenue Share, By Product Types, 2018 & 2025F |
| Figure 491: Kenya Elevator and Escalator Market Revenue Share, By Types, 2018 & 2025F |
| Figure 492: Kenya New Installation Elevator and Escalator Market Revenues & Volume, 2015-2025F ($ Million, Units) |
| Figure 493: Kenya New Installation Elevator and Escalator Market Revenue Share, By Product Types, 2018 & 2025F |
| Figure 494: Kenya New Installation Elevator and Escalator Market Volume Share, By Product Types, 2018 & 2025F |
| Figure 495: Kenya New Installation Elevator Market Revenues & Volume, 2015-2025F ($ Million, Units) |
| Figure 496: Kenya New Installation Escalator Market Revenues & Volume, 2015-2025F ($ Million, Units) |
| Figure 497: Kenya Elevator and Escalator Services Market Revenues, 2015-2025F ($ Million) |
| Figure 498: Kenya Elevator and Escalator Services Market Revenue Share, By Product Types, 2018 & 2025F |
| Figure 499: Kenya Elevator Services Market Revenues, 2015-2025F ($ Million) |
| Figure 500: Kenya Escalator Services Market Revenues, 2015-2025F ($ Million) |
| Figure 501: Kenya Elevator and Escalator Market Revenue Share, By Applications, 2018 & 2025F |
| Figure 502: Kenya Commercial Application Elevator and Escalator Market Revenues, 2015-2025F ($ Million) |
| Figure 503: Kenya Industrial Application Elevator and Escalator Market Revenues, 2015-2025F ($ Million) |
| Figure 504: Kenya Residential Application Elevator and Escalator Market Revenues, 2015-2025F ($ Million) |
| Figure 505: Kenya Actual Government Spending Vs Actual Government Revenues, 2015-2023F (Kenyan Shilling Trillion) |
| Figure 506: Kenya Total Contribution of Travel and Tourism to GDP, 2010-2018 (Kenyan Shilling Billion) |
| Figure 507: Kenya Tourism Sector Leisure Spending vs Business Spending, 2017 |
| Figure 508: Kenya Tourism Sector Foreign Visitor Spending vs Domestic Spending, 2017 |
| Figure 509: Kenya Urban Population As Percentage of Total Population, 2008-2017 |
| Figure 510: Kenya Elevator and Escalator Market Revenue Share, By Company, 2018 |
| Figure 511: Ghana Elevator and Escalator Market Revenues, 2015-2025F ($ Million) |
| Figure 512: Ghana Elevator and Escalator Market Revenue Share, By Product Types, 2018 & 2025F |
| Figure 513: Ghana Elevator and Escalator Market Revenue Share, By Types, 2018 & 2025F |
| Figure 514: Ghana New Installation Elevator and Escalator Market Revenues & Volume, 2015-2025F ($ Million, Units) |
| Figure 515: Ghana New Installation Elevator and Escalator Market Revenue Share, By Product Types, 2018 & 2025F |
| Figure 516: Ghana New Installation Elevator and Escalator Market Volume Share, By Product Types, 2018 & 2025F |
| Figure 517: Ghana New Installation Elevator Market Revenues & Volume, 2015-2025F ($ Million, Units) |
| Figure 518: Ghana New Installation Escalator Market Revenues & Volume, 2015-2025F ($ Million, Units) |
| Figure 519: Ghana Elevator and Escalator Services Market Revenues, 2015-2025F ($ Million) |
| Figure 520: Ghana Elevator and Escalator Services Market Revenue Share, By Product Types, 2018 & 2025F |
| Figure 521: Ghana Elevator Services Market Revenues, 2015-2025F ($ Million) |
| Figure 522: Ghana Escalator Services Market Revenues, 2015-2025F ($ Million) |
| Figure 523: Ghana Elevator and Escalator Market Revenue Share, By Applications, 2018 & 2025F |
| Figure 524: Ghana Commercial Application Elevator and Escalator Market Revenues, 2015-2025F ($ Million) |
| Figure 525: Ghana Industrial Application Elevator and Escalator Market Revenues, 2015-2025F ($ Million) |
| Figure 526: Ghana Residential Application Elevator and Escalator Market Revenues, 2015-2025F ($ Million) |
| Figure 527: Ghana Actual Government Spending Vs Actual Government Revenues, 2015-2023F (GHS Billion) |
| Figure 528: Ghana Sectoral Expenditure Allocation, 2017-2019 (GHS Million) |
| Figure 529: Ghana Sectoral Structure of Economy, 2012-2017 |
| Figure 530: Ghana Economy Sectoral Growth Rate, 2013-2017 |
| Figure 531: Ghana International Tourist Arrivals, 2012-2017 (Thousands) |
| Figure 532: Ghana Travel & Tourism Contribution To GDP, Business Vs Leisure, 2017 |
| Figure 533: Ghana Travel & Tourism Contribution To GDP, Domestic Vs Foreign, 2017 |
| Figure 534: Ghana Elevator and Escalator Market Revenue Share, By Company, 2018 |
| Figure 535: Tanzania Elevator and Escalator Market Revenues, 2015-2025F ($ Million) |
| Figure 536: Tanzania Elevator and Escalator Market Revenue Share, By Product Types, 2018 & 2025F |
| Figure 537: Tanzania Elevator and Escalator Market Revenue Share, By Types, 2018 & 2025F |
| Figure 538: Tanzania New Installation Elevator and Escalator Market Revenues & Volume, 2015-2025F ($ Million, Units) |
| Figure 539: Tanzania New Installation Elevator and Escalator Market Revenue Share, By Product Types, 2018 & 2025F |
| Figure 540: Tanzania New Installation Elevator and Escalator Market Volume Share, By Product Types, 2018 & 2025F |
| Figure 541: Tanzania New Installation Elevator Market Revenues & Volume, 2015-2025F ($ Million, Units) |
| Figure 542: Tanzania New Installation Escalator Market Revenues & Volume, 2015-2025F ($ Million, Units) |
| Figure 543: Tanzania Elevator and Escalator Services Market Revenues, 2015-2025F ($ Million) |
| Figure 544: Tanzania Elevator and Escalator Services Market Revenue Share, By Product Types, 2018 & 2025F |
| Figure 545: Tanzania Elevator Services Market Revenues, 2015-2025F ($ Million) |
| Figure 546: Tanzania Escalator Services Market Revenues, 2015-2025F ($ Million) |
| Figure 547: Tanzania Elevator and Escalator Market Revenue Share, By Applications, 2018 & 2025F |
| Figure 548: Tanzania Commercial Application Elevator and Escalator Market Revenues, 2015-2025F ($ Million) |
| Figure 549: Tanzania Industrial Application Elevator and Escalator Market Revenues, 2015-2025F ($ Million) |
| Figure 550: Tanzania Residential Application Elevator and Escalator Market Revenues, 2015-2025F ($ Million) |
| Figure 551: Tanzania Actual Government Spending Vs Actual Government Revenues, 2015-2023F (TZS Trillion) |
| Figure 552: Tanzania Total Room Revenue, 2014-2021 ($ Millions) |
| Figure 553: Tanzania Travel & Tourism Contribution To GDP, Business Vs Leisure, 2017 |
| Figure 554: Tanzania Travel & Tourism Contribution To GDP, Domestic Vs Foreign, 2017 |
| Figure 555: Tanzania Elevator and Escalator Market Revenue Rankings, By Company, 2018 |
| Figure 556: Morocco Elevator and Escalator Market Revenues, 2015-2025F ($ Million) |
| Figure 557: Morocco Elevator and Escalator Market Revenue Share, By Product Types, 2018 & 2025F |
| Figure 558: Morocco Elevator and Escalator Market Revenue Share, By Types, 2018 & 2025F |
| Figure 559: Morocco New Installation Elevator and Escalator Market Revenues & Volume, 2015-2025F ($ Million, Units) |
| Figure 560: Morocco New Installation Elevator and Escalator Market Revenue Share, By Product Types, 2018 & 2025F |
| Figure 561: Morocco New Installation Elevator and Escalator Market Volume Share, By Product Types, 2018 & 2025F |
| Figure 562: Morocco New Installation Elevator Market Revenues & Volume, 2015-2025F ($ Million, Units) |
| Figure 563: Morocco New Installation Escalator Market Revenues & Volume, 2015-2025F ($ Million, Units) |
| Figure 564: Morocco Elevator and Escalator Services Market Revenues, 2015-2025F ($ Million) |
| Figure 565: Morocco Elevator and Escalator Services Market Revenue Share, By Product Types, 2018 & 2025F |
| Figure 566: Morocco Elevator Services Market Revenues, 2015-2025F ($ Million) |
| Figure 567: Morocco Escalator Services Market Revenues, 2015-2025F ($ Million) |
| Figure 568: Morocco Elevator and Escalator Market Revenue Share, By Applications, 2018 & 2025F |
| Figure 569: Morocco Commercial Application Elevator and Escalator Market Revenues, 2015-2025F ($ Million) |
| Figure 570: Morocco Industrial Application Elevator and Escalator Market Revenues, 2015-2025F ($ Million) |
| Figure 571: Morocco Residential Application Elevator and Escalator Market Revenues, 2015-2025F ($ Million) |
| Figure 572: Morocco Actual Government Spending Vs Actual Government Revenues, 2015-2024F (MAD Billion) |
| Figure 573: Morocco Upcoming Construction Projects |
| Figure 574: Morocco Travel and Tourism Direct Contribution to GDP, 2014-2021F ($ Billion) |
| Figure 575: Morocco Travel & Tourism Contribution To GDP, Business Vs Leisure, 2018 |
| Figure 576: Morocco Travel & Tourism Contribution To GDP, Domestic Vs Foreign, 2018 |
| Figure 577: Morocco Elevator and Escalator Market Revenue Share, By Company, 2018 |
| Figure 578: Sudan Elevator and Escalator Market Revenues, 2015-2025F ($ Million) |
| Figure 579: Sudan Elevator and Escalator Market Revenue Share, By Product Types, 2018 & 2025F |
| Figure 580: Sudan Elevator and Escalator Market Revenue Share, By Types, 2018 & 2025F |
| Figure 581: Sudan New Installation Elevator and Escalator Market Revenues & Volume, 2015-2025F ($ Million, Units) |
| Figure 582: Sudan New Installation Elevator and Escalator Market Revenue Share, By Product Types, 2018 & 2025F |
| Figure 583: Sudan New Installation Elevator and Escalator Market Volume Share, By Product Types, 2018 & 2025F |
| Figure 584: Sudan New Installation Elevator Market Revenues & Volume, 2015-2025F ($ Million, Units) |
| Figure 585: Sudan New Installation Escalator Market Revenues & Volume, 2015-2025F ($ Million, Units) |
| Figure 586: Sudan Elevator and Escalator Services Market Revenues, 2015-2025F ($ Million) |
| Figure 587: Sudan Elevator and Escalator Services Market Revenue Share, By Product Types, 2018 & 2025F |
| Figure 588: Sudan Elevator Services Market Revenues, 2015-2025F ($ Million) |
| Figure 589: Sudan Escalator Services Market Revenues, 2015-2025F ($ Million) |
| Figure 590: Sudan Elevator and Escalator Market Revenue Share, By Applications, 2018 & 2025F |
| Figure 591: Sudan Commercial Application Elevator and Escalator Market Revenues, 2015-2025F ($ Million) |
| Figure 592: Sudan Industrial Application Elevator and Escalator Market Revenues, 2015-2025F ($ Million) |
| Figure 593: Sudan Residential Application Elevator and Escalator Market Revenues, 2015-2025F ($ Million) |
| Figure 594: Sudan Actual Government Spending Vs Actual Government Revenues, 2015-2024F (SDG Billion) |
| Figure 595: Sudan Elevator and Escalator Market Revenue Rankings, By Company, 2018 |
| Figure 596: Tunisia Elevator and Escalator Market Revenues, 2015-2025F ($ Million) |
| Figure 597: Tunisia Elevator and Escalator Market Revenue Share, By Product Types, 2018 & 2025F |
| Figure 598: Tunisia Elevator and Escalator Market Revenue Share, By Types, 2018 & 2025F |
| Figure 599: Tunisia New Installation Elevator and Escalator Market Revenues & Volume, 2015-2025F ($ Million, Units) |
| Figure 600: Tunisia New Installation Elevator and Escalator Market Revenue Share, By Product Types, 2018 & 2025F |
| Figure 601: Tunisia New Installation Elevator and Escalator Market Volume Share, By Product Types, 2018 & 2025F |
| Figure 602: Tunisia New Installation Elevator Market Revenues & Volume, 2015-2025F ($ Million, Units) |
| Figure 603: Tunisia New Installation Escalator Market Revenues & Volume, 2015-2025F ($ Million, Units) |
| Figure 604: Tunisia Elevator and Escalator Services Market Revenues, 2015-2025F ($ Million) |
| Figure 605: Tunisia Elevator and Escalator Services Market Revenue Share, By Product Types, 2018 & 2025F |
| Figure 606: Tunisia Elevator Services Market Revenues, 2015-2025F ($ Million) |
| Figure 607: Tunisia Escalator Services Market Revenues, 2015-2025F ($ Million) |
| Figure 608: Tunisia Elevator and Escalator Market Revenue Share, By Applications, 2018 & 2025F |
| Figure 609: Tunisia Commercial Application Elevator and Escalator Market Revenues, 2015-2025F ($ Million) |
| Figure 610: Tunisia Industrial Application Elevator and Escalator Market Revenues, 2015-2025F ($ Million) |
| Figure 611: Tunisia Residential Application Elevator and Escalator Market Revenues, 2015-2025F ($ Million) |
| Figure 612: Tunisia Actual Government Spending Vs Actual Government Revenues, 2015-2024F (TND Billion) |
| Figure 613: Tunisia Elevator and Escalator Market Revenue Ranking, By Company, 2018 |
| Figure 614: Ethiopia Elevator and Escalator Market Revenues, 2015-2025F ($ Million) |
| Figure 615: Ethiopia Elevator and Escalator Market Revenue Share, By Product Types, 2018 & 2025F |
| Figure 616: Ethiopia Elevator and Escalator Market Revenue Share, By Types, 2018 & 2025F |
| Figure 617: Ethiopia New Installation Elevator and Escalator Market Revenues & Volume, 2015-2025F ($ Million, Units) |
| Figure 618: Ethiopia New Installation Elevator and Escalator Market Revenue Share, By Product Types, 2018 & 2025F |
| Figure 619: Ethiopia New Installation Elevator and Escalator Market Volume Share, By Product Types, 2018 & 2025F |
| Figure 620: Ethiopia New Installation Elevator Market Revenues & Volume, 2015-2025F ($ Million, Units) |
| Figure 621: Ethiopia New Installation Escalator Market Revenues & Volume, 2015-2025F ($ Million, Units) |
| Figure 622: Ethiopia Elevator and Escalator Services Market Revenues, 2015-2025F ($ Million) |
| Figure 623: Ethiopia Elevator and Escalator Services Market Revenue Share, By Product Types, 2018 & 2025F |
| Figure 624: Ethiopia Elevator Services Market Revenues, 2015-2025F ($ Million) |
| Figure 625: Ethiopia Escalator Services Market Revenues, 2015-2025F ($ Million) |
| Figure 626: Ethiopia Elevator and Escalator Market Revenue Share, By Applications, 2018 & 2025F |
| Figure 627: Ethiopia Commercial Application Elevator and Escalator Market Revenues, 2015-2025F ($ Million) |
| Figure 628: Ethiopia Industrial Application Elevator and Escalator Market Revenues, 2015-2025F ($ Million) |
| Figure 629: Ethiopia Residential Application Elevator and Escalator Market Revenues, 2015-2025F ($ Million) |
| Figure 630: Ethiopia Actual Government Spending Vs Actual Government Revenues, 2015-2024F (ETB Billion) |
| Figure 631: Ethiopia Elevator and Escalator Market Revenue Ranking, By Company, 2018 |
| Figure 632: Rest of Africa Elevator and Escalator Market Revenues, 2015-2025F ($ Million) |
| Figure 633: Asia Pacific Elevator and Escalator Market Revenues, 2015-2025F ($ Billion) |
| Figure 634: Asia Pacific Elevator and Escalator Market Revenue Share, By Countries, 2018 & 2025F |
| Figure 635: China Elevator and Escalator Market Revenues, 2015-2025F ($ Billion) |
| Figure 636: China Elevator and Escalator Market Revenue Share, By Product Types, 2018 & 2025F |
| Figure 637: China Elevator and Escalator Market Revenue Share, By Types, 2018 & 2025F |
| Figure 638: China New Installation Elevator and Escalator Market Revenues & Volume, 2015-2025F ($ Billion, ‘000 Units) |
| Figure 639: China New Installation Elevator and Escalator Market Revenue Share, By Product Types, 2018 & 2025F |
| Figure 640: China New Installation Elevator and Escalator Market Volume Share, By Product Types, 2018 & 2025F |
| Figure 641: China New Installation Elevator Market Revenues & Volume, 2015-2025F ($ Billion, ‘000 Units) |
| Figure 642: China New Installation Escalator Market Revenues & Volume, 2015-2025F ($ Billion, ‘000 Units) |
| Figure 643: China Elevator and Escalator Services Market Revenues, 2015-2025F ($ Million) |
| Figure 644: China Elevator and Escalator Services Market Revenue Share, By Product Types, 2018 & 2025F |
| Figure 645: China Elevator Services Market Revenues, 2015-2025F ($ Million) |
| Figure 646: China Escalator Services Market Revenues, 2015-2025F ($ Million) |
| Figure 647: China Elevator and Escalator Market Revenue Share, By Applications, 2018 & 2025F |
| Figure 648: China Commercial Application Elevator and Escalator Market Revenues, 2015-2025F ($ Million) |
| Figure 649: China Industrial Application Elevator and Escalator Market Revenues, 2015-2025F ($ Million) |
| Figure 650: China Residential Application Elevator and Escalator Market Revenues, 2015-2025F ($ Million) |
| Figure 651: China Actual Government Spending Vs Actual Government Revenues, 2015-2024F (Yuan Trillion) |
| Figure 652: China Actual Government Spending, 2015-2024F (Yuan Trillion) |
| Figure 653: China Elevator and Escalator Market Revenue Share, By Company, 2018 |
| Figure 654: New Zealand Elevator and Escalator Market Revenues, 2015-2025F ($ Million) |
| Figure 655: New Zealand Elevator and Escalator Market Revenue Share, By Product Types, 2018 & 2025F |
| Figure 656: New Zealand Elevator and Escalator Market Revenue Share, By Types, 2018 & 2025F |
| Figure 657: New Zealand New Installation Elevator and Escalator Market Revenues & Volume, 2015-2025F ($ Million, Thousand Units) |
| Figure 658: New Zealand New Installation Elevator and Escalator Market Revenue Share, By Product Types, 2018 & 2025F |
| Figure 659: New Zealand New Installation Elevator and Escalator Market Volume Share, By Product Types, 2018 & 2025F |
| Figure 660: New Zealand New Installation Elevator Market Revenues & Volume, 2015-2025F ($ Million, Thousand Units) |
| Figure 661: New Zealand New Installation Escalator Market Revenues & Volume, 2015-2025F ($ Million, Units) |
| Figure 662: New Zealand Elevator and Escalator Services Market Revenues, 2015-2025F ($ Million) |
| Figure 663: New Zealand Elevator and Escalator Services Market Revenue Share, By Product Types, 2018 & 2025F |
| Figure 664: New Zealand Elevator Services Market Revenues, 2015-2025F ($ Million) |
| Figure 665: New Zealand Escalator Services Market Revenues, 2015-2025F ($ Million) |
| Figure 666: New Zealand Elevator and Escalator Market Revenue Share, By Applications, 2018 & 2025F |
| Figure 667: New Zealand Commercial Application Elevator and Escalator Market Revenues, 2015-2025F ($ Million) |
| Figure 668: New Zealand Industrial Application Elevator and Escalator Market Revenues, 2015-2025F ($ Million) |
| Figure 669: New Zealand Residential Application Elevator and Escalator Market Revenues, 2015-2025F ($ Million) |
| Figure 670: New Zealand Actual Government Spending Vs Actual Government Revenues, 2015-2024F (NZD Billion) |
| Figure 671: South Korea Elevator and Escalator Market Revenues, 2015-2025F ($ Million) |
| Figure 672: South Korea Elevator and Escalator Market Revenue Share, By Product Types, 2018 & 2025F |
| Figure 673: South Korea Elevator and Escalator Market Revenue Share, By Types, 2018 & 2025F |
| Figure 674: South Korea New Installation Elevator and Escalator Market Revenues & Volume, 2015-2025F ($ Million, Thousand Units) |
| Figure 675: South Korea New Installation Elevator and Escalator Market Revenue Share, By Product Types, 2018 & 2025F |
| Figure 676: South Korea New Installation Elevator and Escalator Market Volume Share, By Product Types, 2018 & 2025F |
| Figure 677: South Korea New Installation Elevator Market Revenues & Volume, 2015-2025F ($ Million, Thousand Units) |
| Figure 678: South Korea New Installation Escalator Market Revenues & Volume, 2015-2025F ($ Million, Units) |
| Figure 679: South Korea Elevator and Escalator Services Market Revenues, 2015-2025F ($ Million) |
| Figure 680: South Korea Elevator and Escalator Services Market Revenue Share, By Product Types, 2018 & 2025F |
| Figure 681: South Korea Elevator Services Market Revenues, 2015-2025F ($ Million) |
| Figure 682: South Korea Escalator Services Market Revenues, 2015-2025F ($ Million) |
| Figure 683: South Korea Elevator and Escalator Market Revenue Share, By Applications, 2018 & 2025F |
| Figure 684: South Korea Commercial Application Elevator and Escalator Market Revenues, 2015-2025F ($ Million) |
| Figure 685: South Korea Industrial Application Elevator and Escalator Market Revenues, 2015-2025F ($ Million) |
| Figure 686: South Korea Residential Application Elevator and Escalator Market Revenues, 2015-2025F ($ Million) |
| Figure 687: South Korea Actual Government Spending Vs Actual Government Revenues, 2015-2024F (KRW Trillion) |
| Figure 688: South Korea Elevator and Escalator Market Revenue Share, By Company, 2018 |
| Figure 689: Australia Elevator and Escalator Market Revenues, 2015-2025F ($ Million) |
| Figure 690: Australia Elevator and Escalator Market Revenue Share, By Product Types, 2018 & 2025F |
| Figure 691: Australia Elevator and Escalator Market Revenue Share, By Types, 2018 & 2025F |
| Figure 692: Australia New Installation Elevator and Escalator Market Revenues & Volume, 2015-2025F ($ Million, Thousand Units) |
| Figure 693: Australia New Installation Elevator and Escalator Market Revenue Share, By Product Types, 2018 & 2025F |
| Figure 694: Australia New Installation Elevator and Escalator Market Volume Share, By Product Types, 2018 & 2025F |
| Figure 695: Australia New Installation Elevator Market Revenues & Volume, 2015-2025F ($ Million, Thousand Units) |
| Figure 696: Australia New Installation Escalator Market Revenues & Volume, 2015-2025F ($ Million, Thousand Units) |
| Figure 697: Australia Elevator and Escalator Services Market Revenues, 2015-2025F ($ Million) |
| Figure 698: Australia Elevator and Escalator Services Market Revenue Share, By Product Types, 2018 & 2025F |
| Figure 699: Australia Elevator Services Market Revenues, 2015-2025F ($ Million) |
| Figure 700: Australia Escalator Services Market Revenues, 2015-2025F ($ Million) |
| Figure 701: Australia Elevator and Escalator Market Revenue Share, By Applications, 2018 & 2025F |
| Figure 702: Australia Commercial Application Elevator and Escalator Market Revenues, 2015-2025F ($ Million) |
| Figure 703: Australia Industrial Application Elevator and Escalator Market Revenues, 2015-2025F ($ Million) |
| Figure 704: Australia Residential Application Elevator and Escalator Market Revenues, 2015-2025F ($ Million) |
| Figure 705: Australia Actual Government Spending Vs Actual Government Revenues, 2015-2024F (AUD Billion) |
| Figure 706: Thailand Elevator and Escalator Market Revenues, 2015-2025F ($ Million) |
| Figure 707: Thailand Elevator and Escalator Market Revenue Share, By Product Types, 2018 & 2025F |
| Figure 708: Thailand Elevator and Escalator Market Revenue Share, By Types, 2018 & 2025F |
| Figure 709: Thailand New Installation Elevator and Escalator Market Revenues & Volume, 2015-2025F ($ Million, Thousand Units) |
| Figure 710: Thailand New Installation Elevator and Escalator Market Revenue Share, By Product Types, 2018 & 2025F |
| Figure 711: Thailand New Installation Elevator and Escalator Market Volume Share, By Product Types, 2018 & 2025F |
| Figure 712: Thailand New Installation Elevator Market Revenues & Volume, 2015-2025F ($ Million, Thousand Units) |
| Figure 713: Thailand New Installation Escalator Market Revenues & Volume, 2015-2025F ($ Million, Thousand Units) |
| Figure 714: Thailand Elevator and Escalator Services Market Revenues, 2015-2025F ($ Million) |
| Figure 715: Thailand Elevator and Escalator Services Market Revenue Share, By Product Types, 2018 & 2025F |
| Figure 716: Thailand Elevator Services Market Revenues, 2015-2025F ($ Million) |
| Figure 717: Thailand Escalator Services Market Revenues, 2015-2025F ($ Million) |
| Figure 718: Thailand Elevator and Escalator Market Revenue Share, By Applications, 2018 & 2025F |
| Figure 719: Thailand Commercial Application Elevator and Escalator Market Revenues, 2015-2025F ($ Million) |
| Figure 720: Thailand Industrial Application Elevator and Escalator Market Revenues, 2015-2025F ($ Million) |
| Figure 721: Thailand Residential Application Elevator and Escalator Market Revenues, 2015-2025F ($ Million) |
| Figure 722: Thailand Actual Government Spending Vs Actual Government Revenues, 2015-2024F (THB Trillion) |
| Figure 723: Bangkok New and Existing Condominium Supply |
| Figure 724: Thailand New Supply Of Residential Units, By Locations |
| Figure 725: Bangkok Condominium Market Supply and Demand |
| Figure 726: Bangkok Condominium Average Price Trends |
| Figure 727: Thailand Industrial Estate Current Market Supply |
| Figure 728: Thailand Industrial Estate Market Additional Supply |
| Figure 729: Thailand Elevator and Escalator Market Revenue Rankings, By Company, 2018 |
| Figure 730: Vietnam Elevator and Escalator Market Revenues, 2015-2025F ($ Million) |
| Figure 731: Vietnam Elevator and Escalator Market Revenue Share, By Product Types, 2018 & 2025F |
| Figure 732: Vietnam Elevator and Escalator Market Revenue Share, By Types, 2018 & 2025F |
| Figure 733: Vietnam New Installation Elevator and Escalator Market Revenues & Volume, 2015-2025F ($ Million, Units) |
| Figure 734: Vietnam New Installation Elevator and Escalator Market Revenue Share, By Product Types, 2018 & 2025F |
| Figure 735: Vietnam New Installation Elevator and Escalator Market Volume Share, By Product Types, 2018 & 2025F |
| Figure 736: Vietnam New Installation Elevator Market Revenues & Volume, 2015-2025F ($ Million, Units) |
| Figure 737: Vietnam New Installation Escalator Market Revenues & Volume, 2015-2025F ($ Million, Units) |
| Figure 738: Vietnam Elevator and Escalator Services Market Revenues, 2015-2025F ($ Million) |
| Figure 739: Vietnam Elevator and Escalator Services Market Revenue Share, By Product Types, 2018 & 2025F |
| Figure 740: Vietnam Elevator Services Market Revenues, 2015-2025F ($ Million) |
| Figure 741: Vietnam Escalator Services Market Revenues, 2015-2025F ($ Million) |
| Figure 742: Vietnam Elevator and Escalator Market Revenue Share, By Applications, 2018 & 2025F |
| Figure 743: Vietnam Commercial Application Elevator and Escalator Market Revenues, 2015-2025F ($ Million) |
| Figure 744: Vietnam Industrial Application Elevator and Escalator Market Revenues, 2015-2025F ($ Million) |
| Figure 745: Vietnam Residential Application Elevator and Escalator Market Revenues, 2015-2025F ($ Million) |
| Figure 746: Vietnam Actual Government Spending Vs Actual Government Revenues, 2015-2024F (VND Trillion) |
| Figure 747: Hanoi Office Supply NLA, 2016-2019F (Sq. M.) |
| Figure 748: Vietnam Elevator and Escalator Market Revenue Share, By Company, 2018 |
| Figure 749: Indonesia Elevator and Escalator Market Revenues, 2015-2025F ($ Million) |
| Figure 750: Indonesia Elevator and Escalator Market Revenue Share, By Product Types, 2018 & 2025F |
| Figure 751: Indonesia Elevator and Escalator Market Revenue Share, By Types, 2018 & 2025F |
| Figure 752: Indonesia New Installation Elevator and Escalator Market Revenues & Volume, 2015-2025F ($ Million, Units) |
| Figure 753: Indonesia New Installation Elevator and Escalator Market Revenue Share, By Product Types, 2018 & 2025F |
| Figure 754: Indonesia New Installation Elevator and Escalator Market Volume Share, By Product Types, 2018 & 2025F |
| Figure 755: Indonesia New Installation Elevator Market Revenues & Volume, 2015-2025F ($ Million, Units) |
| Figure 756: Indonesia New Installation Escalator Market Revenues & Volume, 2015-2025F ($ Million, Units) |
| Figure 757: Indonesia Elevator and Escalator Services Market Revenues, 2015-2025F ($ Million) |
| Figure 758: Indonesia Elevator and Escalator Services Market Revenue Share, By Product Types, 2018 & 2025F |
| Figure 759: Indonesia Elevator Services Market Revenues, 2015-2025F ($ Million) |
| Figure 760: Indonesia Escalator Services Market Revenues, 2015-2025F ($ Million) |
| Figure 761: Indonesia Elevator and Escalator Market Revenue Share, By Applications, 2018 & 2025F |
| Figure 762: Indonesia Commercial Application Elevator and Escalator Market Revenues, 2015-2025F ($ Million) |
| Figure 763: Indonesia Industrial Application Elevator and Escalator Market Revenues, 2015-2025F ($ Million) |
| Figure 764: Indonesia Residential Application Elevator and Escalator Market Revenues, 2015-2025F ($ Million) |
| Figure 765: Indonesia Actual Government Spending Vs Actual Government Revenues, 2015-2024F (IDR Quadrillion) |
| Figure 766: Indonesia DDI and FDI Investment Realization, By Regions |
| Figure 767: Indonesia DDI Investment Realization, By Regions |
| Figure 768: Indonesia FDI Investment Realization, By Regions |
| Figure 769: Share of Active Industries in Jakarta |
| Figure 770: Indonesia Industrial Production Index Growth |
| Figure 771: Indonesia Elevator and Escalator Market Revenue Share, By Company, 2018 |
| Figure 772: Malaysia Elevator and Escalator Market Revenues, 2015-2025F ($ Million) |
| Figure 773: Malaysia Elevator and Escalator Market Revenue Share, By Product Types, 2018 & 2025F |
| Figure 774: Malaysia Elevator and Escalator Market Revenue Share, By Types, 2018 & 2025F |
| Figure 775: Malaysia New Installation Elevator and Escalator Market Revenues & Volume, 2015-2025F ($ Million, Units) |
| Figure 776: Malaysia New Installation Elevator and Escalator Market Revenue Share, By Product Types, 2018 & 2025F |
| Figure 777: Malaysia New Installation Elevator and Escalator Market Volume Share, By Product Types, 2018 & 2025F |
| Figure 778: Malaysia New Installation Elevator Market Revenues & Volume, 2015-2025F ($ Million, Units) |
| Figure 779: Malaysia New Installation Escalator Market Revenues & Volume, 2015-2025F ($ Million, Units) |
| Figure 780: Malaysia Elevator and Escalator Services Market Revenues, 2015-2025F ($ Million) |
| Figure 781: Malaysia Elevator and Escalator Services Market Revenue Share, By Product Types, 2018 & 2025F |
| Figure 782: Malaysia Elevator Services Market Revenues, 2015-2025F ($ Million) |
| Figure 783: Malaysia Escalator Services Market Revenues, 2015-2025F ($ Million) |
| Figure 784: Malaysia Elevator and Escalator Market Revenue Share, By Applications, 2018 & 2025F |
| Figure 785: Malaysia Commercial Application Elevator and Escalator Market Revenues, 2015-2025F ($ Million) |
| Figure 786: Malaysia Industrial Application Elevator and Escalator Market Revenues, 2015-2025F ($ Million) |
| Figure 787: Malaysia Residential Application Elevator and Escalator Market Revenues, 2015-2025F ($ Million) |
| Figure 788: Malaysia Actual Government Spending Vs Actual Government Revenues, 2016-2024F (RM Billion) |
| Figure 789: Malaysia Construction Budget |
| Figure 790: Malaysia Manufacturing Sector Approved Investment |
| Figure 791: Malaysia Elevator and Escalator Market Revenue Share, By Company, 2018 |
| Figure 792: Philippines Elevator and Escalator Market Revenues, 2015-2025F ($ Million) |
| Figure 793: Philippines Elevator and Escalator Market Revenue Share, By Product Types, 2018 & 2025F |
| Figure 794: Philippines Elevator and Escalator Market Revenue Share, By Types, 2018 & 2025F |
| Figure 795: Philippines New Installation Elevator and Escalator Market Revenues & Volume, 2015-2025F ($ Million, Units) |
| Figure 796: Philippines New Installation Elevator and Escalator Market Revenue Share, By Product Types, 2018 & 2025F |
| Figure 797: Philippines New Installation Elevator and Escalator Market Volume Share, By Product Types, 2018 & 2025F |
| Figure 798: Philippines New Installation Elevator Market Revenues & Volume, 2015-2025F ($ Million, Units) |
| Figure 799: Philippines New Installation Escalator Market Revenues & Volume, 2015-2025F ($ Million, Units) |
| Figure 800: Philippines Elevator and Escalator Services Market Revenues, 2015-2025F ($ Million) |
| Figure 801: Philippines Elevator and Escalator Services Market Revenue Share, By Product Types, 2018 & 2025F |
| Figure 802: Philippines Elevator Services Market Revenues, 2015-2025F ($ Million) |
| Figure 803: Philippines Escalator Services Market Revenues, 2015-2025F ($ Million) |
| Figure 804: Philippines Elevator and Escalator Market Revenue Share, By Applications, 2018 & 2025F |
| Figure 805: Philippines Commercial Application Elevator and Escalator Market Revenues, 2015-2025F ($ Million) |
| Figure 806: Philippines Industrial Application Elevator and Escalator Market Revenues, 2015-2025F ($ Million) |
| Figure 807: Philippines Residential Application Elevator and Escalator Market Revenues, 2015-2025F ($ Million) |
| Figure 808: Philippines Actual Government Spending Vs Actual Government Revenues, 2015-2024F (PHP Billion) |
| Figure 809: Philippines Elevator and Escalator Market Revenue Share, By Company, 2018 |
| Figure 810: Cambodia Elevator and Escalator Market Revenues, 2015-2025F ($ Million) |
| Figure 811: Cambodia Elevator and Escalator Market Revenue Share, By Product Types, 2018 & 2025F |
| Figure 812: Cambodia Elevator and Escalator Market Revenue Share, By Types, 2018 & 2025F |
| Figure 813: Cambodia New Installation Elevator and Escalator Market Revenues & Volume, 2015-2025F ($ Million, Units) |
| Figure 814: Cambodia New Installation Elevator and Escalator Market Revenue Share, By Product Types, 2018 & 2025F |
| Figure 815: Cambodia New Installation Elevator and Escalator Market Volume Share, By Product Types, 2018 & 2025F |
| Figure 816: Cambodia New Installation Elevator Market Revenues & Volume, 2015-2025F ($ Million, Units) |
| Figure 817: Cambodia New Installation Escalator Market Revenues & Volume, 2015-2025F ($ Million, Units) |
| Figure 818: Cambodia Elevator and Escalator Services Market Revenues, 2015-2025F ($ Million) |
| Figure 819: Cambodia Elevator and Escalator Services Market Revenue Share, By Product Types, 2018 & 2025F |
| Figure 820: Cambodia Elevator Services Market Revenues, 2015-2025F ($ Million) |
| Figure 821: Cambodia Escalator Services Market Revenues, 2015-2025F ($ Million) |
| Figure 822: Cambodia Elevator and Escalator Market Revenue Share, By Applications, 2018 & 2025F |
| Figure 823: Cambodia Commercial Application Elevator and Escalator Market Revenues, 2015-2025F ($ Million) |
| Figure 824: Cambodia Industrial Application Elevator and Escalator Market Revenues, 2015-2025F ($ Million) |
| Figure 825: Cambodia Residential Application Elevator and Escalator Market Revenues, 2015-2025F ($ Million) |
| Figure 826: Cambodia Actual Government Spending Vs Actual Government Revenues, 2015-2024F (KHR Tillion) |
| Figure 827: Cumulative Phnom Penh Office Supply, 2015-2021 (Sq m) |
| Figure 828: Phnom Penh Supply of Retail Space, 2015-2021 (Sq m) |
| Figure 829: Cambodia Existing and Future Hotel Supply, By Types, 2018 & 2020F |
| Figure 830: Cambodia Existing Office Supply, By District, 2018 |
| Figure 831: India Elevator and Escalator Market Revenues, 2015-2025F ($ Million) |
| Figure 832: India Elevator and Escalator Market Revenue Share, By Product Types, 2018 & 2025F |
| Figure 833: India Elevator and Escalator Market Revenue Share, By Types, 2018 & 2025F |
| Figure 834: India New Installation Elevator and Escalator Market Revenues & Volume, 2015-2025F ($ Million, Units) |
| Figure 835: India New Installation Elevator and Escalator Market Revenue Share, By Product Types, 2018 & 2025F |
| Figure 836: India New Installation Elevator and Escalator Market Volume Share, By Product Types, 2018 & 2025F |
| Figure 837: India New Installation Elevator Market Revenues & Volume, 2015-2025F ($ Million, Units) |
| Figure 838: India New Installation Escalator Market Revenues & Volume, 2015-2025F ($ Million, Units) |
| Figure 839: India Elevator and Escalator Services Market Revenues, 2015-2025F ($ Million) |
| Figure 840: India Elevator and Escalator Services Market Revenue Share, By Product Types, 2018 & 2025F |
| Figure 841: India Elevator Services Market Revenues, 2015-2025F ($ Million) |
| Figure 842: India Escalator Services Market Revenues, 2015-2025F ($ Million) |
| Figure 843: India Elevator and Escalator Market Revenue Share, By Applications, 2018 & 2025F |
| Figure 844: India Commercial Application Elevator and Escalator Market Revenues, 2015-2025F ($ Million) |
| Figure 845: India Industrial Application Elevator and Escalator Market Revenues, 2015-2025F ($ Million) |
| Figure 846: India Residential Application Elevator and Escalator Market Revenues, 2015-2025F ($ Million) |
| Figure 847: India Actual Government Spending Vs Actual Government Revenues, 2015-2024F (INR Trillion) |
| Figure 848: India Expected Government Budget Outlook, FY2020 |
| Figure 849: Growth of Hotel Rooms Supply in India, FY2018 & FY2023 (No. of Rooms) |
| Figure 850: New Office Supply in Major Indian Cities, 2019–20F (Million sq. ft.) |
| Figure 851: India Elevator and Escalator Market Revenue Share, By Company, 2018 |
| Figure 852: Myanmar Elevator and Escalator Market Revenues, 2015-2025F ($ Million) |
| Figure 853: Myanmar Elevator and Escalator Market Revenue Share, By Product Types, 2018 & 2025F |
| Figure 854: Myanmar Elevator and Escalator Market Revenue Share, By Types, 2018 & 2025F |
| Figure 855: Myanmar New Installation Elevator and Escalator Market Revenues & Volume, 2015-2025F ($ Million, Units) |
| Figure 856: Myanmar New Installation Elevator and Escalator Market Revenue Share, By Product Types, 2018 & 2025F |
| Figure 857: Myanmar New Installation Elevator and Escalator Market Volume Share, By Product Types, 2018 & 2025F |
| Figure 858: Myanmar New Installation Elevator Market Revenues & Volume, 2015-2025F ($ Million, Units) |
| Figure 859: Myanmar New Installation Escalator Market Revenues & Volume, 2015-2025F ($ Million, Units) |
| Figure 860: Myanmar Elevator and Escalator Services Market Revenues, 2015-2025F ($ Million) |
| Figure 861: Myanmar Elevator and Escalator Services Market Revenue Share, By Product Types, 2018 & 2025F |
| Figure 862: Myanmar Elevator Services Market Revenues, 2015-2025F ($ Million) |
| Figure 863: Myanmar Escalator Services Market Revenues, 2015-2025F ($ Million) |
| Figure 864: Myanmar Elevator and Escalator Market Revenue Share, By Applications, 2018 & 2025F |
| Figure 865: Myanmar Commercial Application Elevator and Escalator Market Revenues, 2015-2025F ($ Million) |
| Figure 866: Myanmar Industrial Application Elevator and Escalator Market Revenues, 2015-2025F ($ Million) |
| Figure 867: Myanmar Residential Application Elevator and Escalator Market Revenues, 2015-2025F ($ Million) |
| Figure 868: Myanmar Actual Government Spending Vs Actual Government Revenues, 2015-2024F (PHP Billion) |
| Figure 869: Myanmar Elevator and Escalator Market Revenue Share, By Company, 2018 |
| Figure 870: Singapore Elevator and Escalator Market Revenues, 2015-2025F ($ Million) |
| Figure 871: Singapore Elevator and Escalator Market Revenue Share, By Product Types, 2018 & 2025F |
| Figure 872: Singapore Elevator and Escalator Market Revenue Share, By Types, 2018 & 2025F |
| Figure 873: Singapore New Installation Elevator and Escalator Market Revenues & Volume, 2015-2025F ($ Million, Units) |
| Figure 874: Singapore New Installation Elevator and Escalator Market Revenue Share, By Product Types, 2018 & 2025F |
| Figure 875: Singapore New Installation Elevator and Escalator Market Volume Share, By Product Types, 2018 & 2025F |
| Figure 876: Singapore New Installation Elevator Market Revenues & Volume, 2015-2025F ($ Million, Units) |
| Figure 877: Singapore New Installation Escalator Market Revenues & Volume, 2015-2025F ($ Million, Units) |
| Figure 878: Singapore Elevator and Escalator Services Market Revenues, 2015-2025F ($ Million) |
| Figure 879: Singapore Elevator and Escalator Services Market Revenue Share, By Product Types, 2018 & 2025F |
| Figure 880: Singapore Elevator Services Market Revenues, 2015-2025F ($ Million) |
| Figure 881: Singapore Escalator Services Market Revenues, 2015-2025F ($ Million) |
| Figure 882: Singapore Elevator and Escalator Market Revenue Share, By Applications, 2018 & 2025F |
| Figure 883: Singapore Commercial Application Elevator and Escalator Market Revenues, 2015-2025F ($ Million) |
| Figure 884: Singapore Industrial Application Elevator and Escalator Market Revenues, 2015-2025F ($ Million) |
| Figure 885: Singapore Residential Application Elevator and Escalator Market Revenues, 2015-2025F ($ Million) |
| Figure 886: Singapore Projected Government Budget Expenditure |
| Figure 887: Singapore Actual Government Spending Vs Actual Government Revenues (S$ Billion) |
| Figure 888: Singapore Number of Hotel Room Supply |
| Figure 889: Singapore Total Pipeline of Rooms, By Positioning |
| Figure 890: Singapore Elevator and Escalator Market Revenue Share, By Company, 2018 |
| Figure 891: Japan Elevator and Escalator Market Revenues, 2015-2025F ($ Million) |
| Figure 892: Japan Elevator and Escalator Market Revenue Share, By Product Types, 2018 & 2025F |
| Figure 893: Japan Elevator and Escalator Market Revenue Share, By Types, 2018 & 2025F |
| Figure 894: Japan New Installation Elevator and Escalator Market Revenues & Volume, 2015-2025F ($ Million, Units) |
| Figure 895: Japan New Installation Elevator and Escalator Market Revenue Share, By Product Types, 2018 & 2025F |
| Figure 896: Japan New Installation Elevator and Escalator Market Volume Share, By Product Types, 2018 & 2025F |
| Figure 897: Japan New Installation Elevator Market Revenues & Volume, 2015-2025F ($ Million, Units) |
| Figure 898: Japan New Installation Escalator Market Revenues & Volume, 2015-2025F ($ Million, Units) |
| Figure 899: Japan Elevator and Escalator Services Market Revenues, 2015-2025F ($ Million) |
| Figure 900: Japan Elevator and Escalator Services Market Revenue Share, By Product Types, 2018 & 2025F |
| Figure 901: Japan Elevator Services Market Revenues, 2015-2025F ($ Million) |
| Figure 902: Japan Escalator Services Market Revenues, 2015-2025F ($ Million) |
| Figure 903: Japan Elevator and Escalator Market Revenue Share, By Applications, 2018 & 2025F |
| Figure 904: Japan Commercial Application Elevator and Escalator Market Revenues, 2015-2025F ($ Million) |
| Figure 905: Japan Industrial Application Elevator and Escalator Market Revenues, 2015-2025F ($ Million) |
| Figure 906: Japan Residential Application Elevator and Escalator Market Revenues, 2015-2025F ($ Million) |
| Figure 907: Japan Actual Government Spending Vs Actual Government Revenues, 2015-2024F (JPY Trillion) |
| Figure 908: Japan Expected Government Budget Outlook, FY2020 |
| Figure 909: Upcoming Power Plant Projects in Japan |
| Figure 910: Japan Elevator and Escalator Market Revenue Share, By Company, 2018 |
| Figure 911: Laos Elevator and Escalator Market Revenues, 2015-2025F ($ Million) |
| Figure 912: Laos Elevator and Escalator Market Revenue Share, By Product Types, 2018 & 2025F |
| Figure 913: Laos Elevator and Escalator Market Revenue Share, By Types, 2018 & 2025F |
| Figure 914: Laos New Installation Elevator and Escalator Market Revenues & Volume, 2015-2025F ($ Million, Units) |
| Figure 915: Laos New Installation Elevator and Escalator Market Revenue Share, By Product Types, 2018 & 2025F |
| Figure 916: Laos New Installation Elevator and Escalator Market Volume Share, By Product Types, 2018 & 2025F |
| Figure 917: Laos New Installation Elevator Market Revenues & Volume, 2015-2025F ($ Million, Units) |
| Figure 918: Laos New Installation Escalator Market Revenues & Volume, 2015-2025F ($ Million, Units) |
| Figure 919: Laos Elevator and Escalator Services Market Revenues, 2015-2025F ($ Million) |
| Figure 920: Laos Elevator and Escalator Services Market Revenue Share, By Product Types, 2018 & 2025F |
| Figure 921: Laos Elevator Services Market Revenues, 2015-2025F ($ Million) |
| Figure 922: Laos Escalator Services Market Revenues, 2015-2025F ($ Million) |
| Figure 923: Laos Elevator and Escalator Market Revenue Share, By Applications, 2018 & 2025F |
| Figure 924: Laos Commercial Application Elevator and Escalator Market Revenues, 2015-2025F ($ Million) |
| Figure 925: Laos Industrial Application Elevator and Escalator Market Revenues, 2015-2025F ($ Million) |
| Figure 926: Laos Residential Application Elevator and Escalator Market Revenues, 2015-2025F ($ Million) |
| Figure 927: Laos Actual Government Spending Vs Actual Government Revenues, 2015-2024F (LAK Trillion) |
| Figure 928: Laos Elevator and Escalator Market Revenue Rankings, By Company, 2018 |
| Figure 929: Rest of Asia Pacific Elevator and Escalator Market Revenues, 2015-2025F ($ Million) |
| Figure 930: Global Elevator and Escalator Market Opportunity Assessment, By Regions, 2025F |
| List of Tables |
| Table 1: Global Upcoming Skyscraper Projects |
| Table 2: Upcoming Residential Projects in Saudi Arabia |
| Table 3: List of Major Elevator & Escalator Projects Announced in Saudi Arabia |
| Table 4: List of Major Infrastructure Projects in Saudi Arabia |
| Table 5: Saudi Arabia Upcoming Petrochemical Projects |
| Table 6: Upcoming Malls in UAE |
| Table 7: Upcoming Construction Projects in Dubai |
| Table 8: Upcoming Hospitality Projects in UAE |
| Table 9: UAE Under Construction Residential Projects |
| Table 10: Qatar Upcoming Residential Projects |
| Table 11: Upcoming Commercial Building Projects in Qatar |
| Table 12: List of Major Projects Announced in Qatar |
| Table 13: Upcoming Public Infrastructure Projects in Qatar |
| Table 14: Qatar Ongoing and Planned Projects Value Estimation |
| Table 15: Qatar Upcoming Power Projects |
| Table 16: Qatar Upcoming Solar Power Projects |
| Table 17: Upcoming Industrial Projects In Kuwait |
| Table 18: Kuwait Upcoming Residential Projects |
| Table 19: Oman Upcoming Residential Projects |
| Table 20: Bahrain Power Generation Per Station, 2017 (GWh) |
| Table 21: Bahrain Upcoming Power & Energy Sector Projects |
| Table 22: Turkey Upcoming Residential Projects |
| Table 23: Argentina Transport Infrastructure Investment, 2016-19 ( $ Million) |
| Table 24: Argentina Upcoming Residential Projects |
| Table 25: Algeria Major Commercial Projects |
| Table 26: Upcoming Oil & Gas Projects In Algeria |
| Table 27: South Africa Upcoming Major Commercial Projects |
| Table 28: South Africa Upcoming Residential Projects |
| Table 29: Kenya Priority Industrial Sectors Under The Big 4 Agenda |
| Table 30: Objectives under Ghana One District One Factory Plan |
| Table 31: Hotel Chain Development Pipelines in Africa, 2018 |
| Table 32: China Upcoming Commercial Projects |
| Table 33: Upcoming Residential Projects in Vietnam |
| Table 34: Upcoming Hotel Projects in Vietnam |
| Table 35: Indonesia Upcoming Commercial Projects |
| Table 36: Malaysia Expected Government Budget Outlook, FY2020 |
| Table 37: List of Proposed Upcoming Skyscrapers in Malaysia |
| Table 38: Upcoming infrastructure projects in Philippines (As on July 2018) |
| Table 39: Philippines Programs and Projects Investments Targets, By Islands, 2017-2022 (Peso Million) |
| Table 40: India Upcoming Airport Projects |
| Table 41: List of Residential High-Rise Building Construction Projects in India (As on Sep 2018) |
| Table 42: Myanmar Upcoming Residential Projects |
| Table 43: Myanmar Upcoming Commercial Projects |
| Table 44: Singapore Budget Comparison for Total Expenditure, FY 2017-FY2018 |
| Table 45: Singapore Tourism Sector Contribution, 2017-2028 |
| Table 46: Major Construction Projects Related to Tokyo Olympics |
Global Go To Market Strategy - 2030
Export potential enables firms to identify high-growth global markets with greater confidence by combining advanced trade intelligence with a structured quantitative methodology. The framework analyzes emerging demand trends and country-level import patterns while integrating macroeconomic and trade datasets such as GDP and population forecasts, bilateral import–export flows, tariff structures, elasticity differentials between developed and developing economies, geographic distance, and import demand projections. Using weighted trade values from 2020–2024 as the base period to project country-to-country export potential for 2030, these inputs are operationalized through calculated drivers such as gravity model parameters, tariff impact factors, and projected GDP per-capita growth. Through an analysis of hidden potentials, demand hotspots, and market conditions that are most favorable to success, this method enables firms to focus on target countries, maximize returns, and global expansion with data, backed by accuracy.
By factoring in the projected importer demand gap that is currently unmet and could be potential opportunity, it identifies the potential for the Exporter (Country) among 190 countries, against the general trade analysis, which identifies the biggest importer or exporter.
To discover high-growth global markets and optimize your business strategy:
Click Here
Pricing
- Single User License$ 4,560
- Department License$ 5,055
- Site License$ 5,595
- Global License$ 6,000

Leadership Perspectives from Industry Events
Search
Thought Leadership and Analyst Meet


Our Clients
6WResearch In News
- Doha a strategic location for EV manufacturing hub: IPA Qatar
- Demand for luxury TVs surging in the GCC, says Samsung
- Empowering Growth: The Thriving Journey of Bangladesh’s Cable Industry
- Demand for luxury TVs surging in the GCC, says Samsung
- Video call with a traditional healer? Once unthinkable, it’s now common in South Africa
- Intelligent Buildings To Smooth GCC’s Path To Net Zero
Latest Reports
- New Zealand Aseptic Manufacturing Market (2026-2032)
- Netherlands Aseptic Manufacturing Market (2026-2032)
- Nauru Aseptic Manufacturing Market (2026-2032)
- Namibia Aseptic Manufacturing Market (2026-2032)
- Mozambique Aseptic Manufacturing Market (2026-2032)
- Montenegro Aseptic Manufacturing Market (2026-2032)
- Mongolia Aseptic Manufacturing Market (2026-2032)
- Monaco Aseptic Manufacturing Market (2026-2032)
- Micronesia Aseptic Manufacturing Market (2026-2032)
- Mauritius Aseptic Manufacturing Market (2026-2032)
Industry Events and Analyst Meet

HIMTEX 2026

India Refining Summit 2026

India EV Show 2026

EV tech India Expo 2026

Auto Tech Asia 2026
Whitepaper
- Middle East & Africa Commercial Security Market Click here to view more.
- Middle East & Africa Fire Safety Systems & Equipment Market Click here to view more.
- GCC Drone Market Click here to view more.
- Middle East Lighting Fixture Market Click here to view more.
- GCC Physical & Perimeter Security Market Click here to view more.