Greece Black Phosphorus Market (2026-2032) | Share, Analysis, Industry, Segmentation, Trends, Size, Forecast, Growth, Value, Outlook, Companies & Revenue
Market Forecast By Form (Crystal, Powder), By Application (Electronic Devices, Energy Storage, Sensors) And Competitive Landscape
| Product Code: ETC5637091 | Publication Date: Nov 2023 | Updated Date: Apr 2026 | Product Type: Market Research Report | |
| Publisher: 6Wresearch | Author: Ravi Bhandari | No. of Pages: 60 | No. of Figures: 30 | No. of Tables: 5 |
Greece Black Phosphorus Market Size (2020-2030)
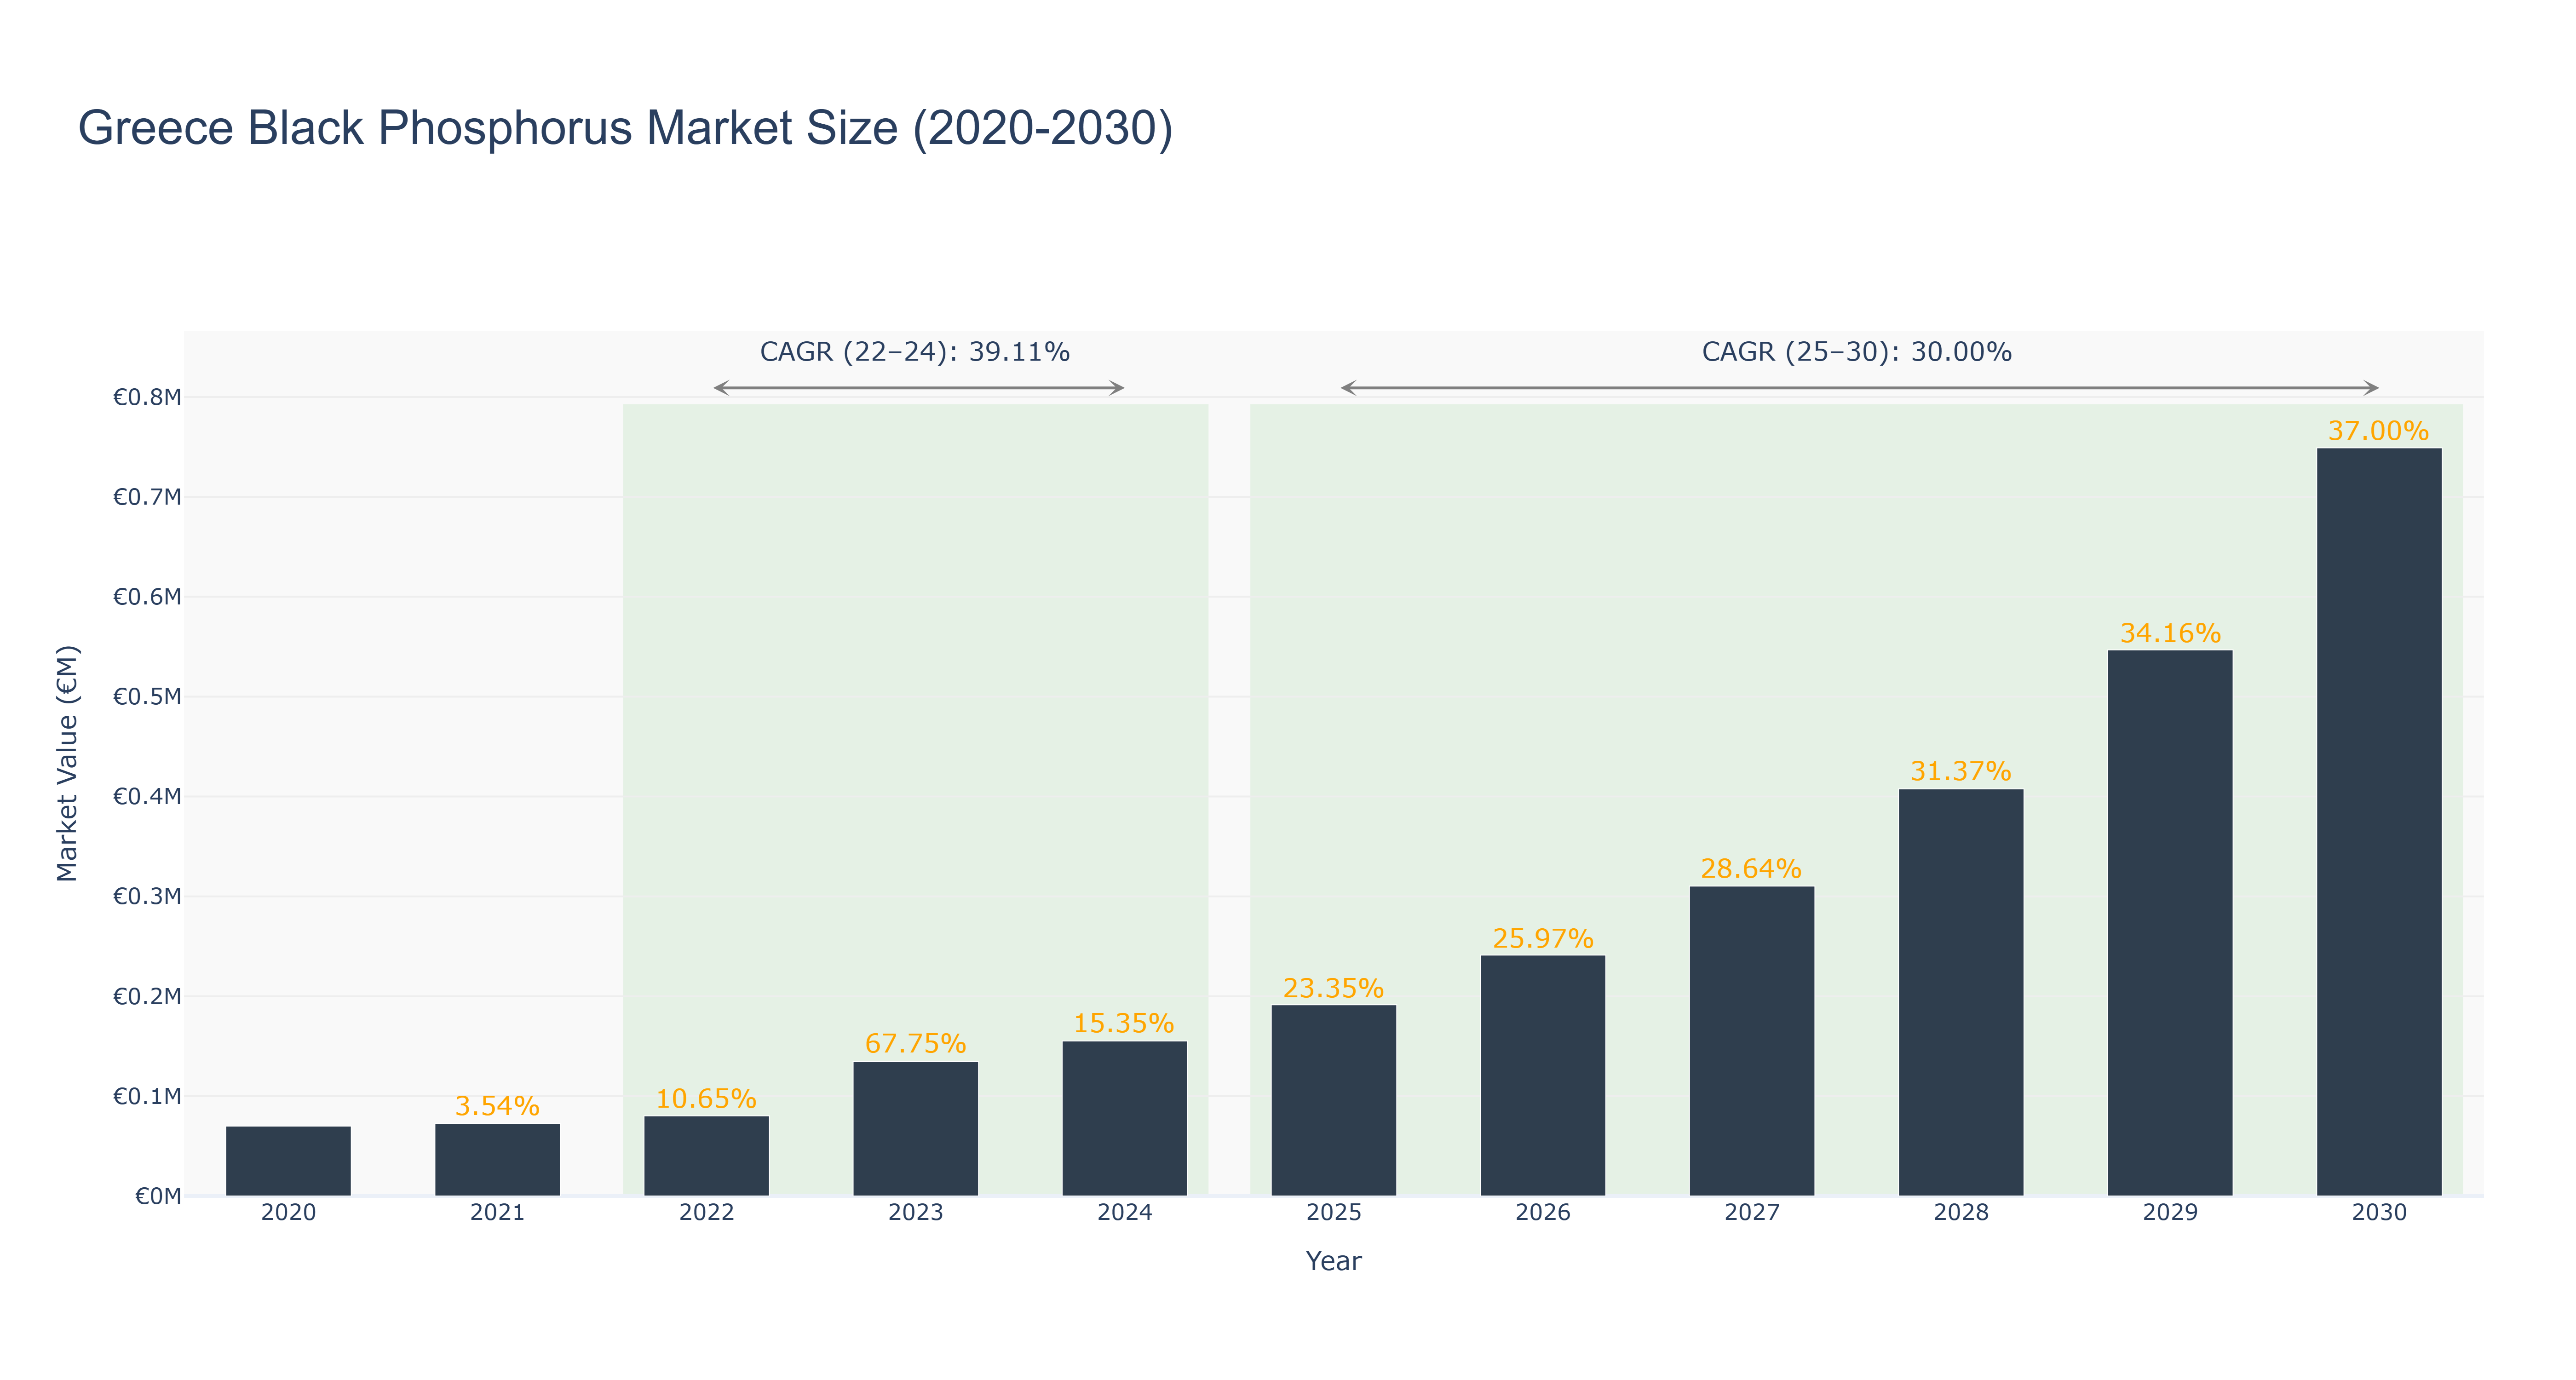
The Greece Black Phosphorus Market has shown a significant upward trend in recent years. The peak market size of €0.75 million is forecasted for 2030, with a steady growth trajectory. Actual market sizes from 2020 to 2024 have seen consistent increases, reaching €0.16 million in 2024. The forecasted market sizes from 2025 to 2030 indicate continued growth, with a CAGR of 39.11% from 2022 to 2024 and 30.0% from 2025 to 2030. The market's growth can be attributed to factors such as increasing demand for black phosphorus in various industries and ongoing technological advancements. Looking ahead, Greece is set to launch a new research initiative in collaboration with leading universities to further enhance the applications of black phosphorus in the semiconductor industry, promising continued growth and innovation in the market.
Greece Black Phosphorus Market: Production & Trade Performance (2019-2025)
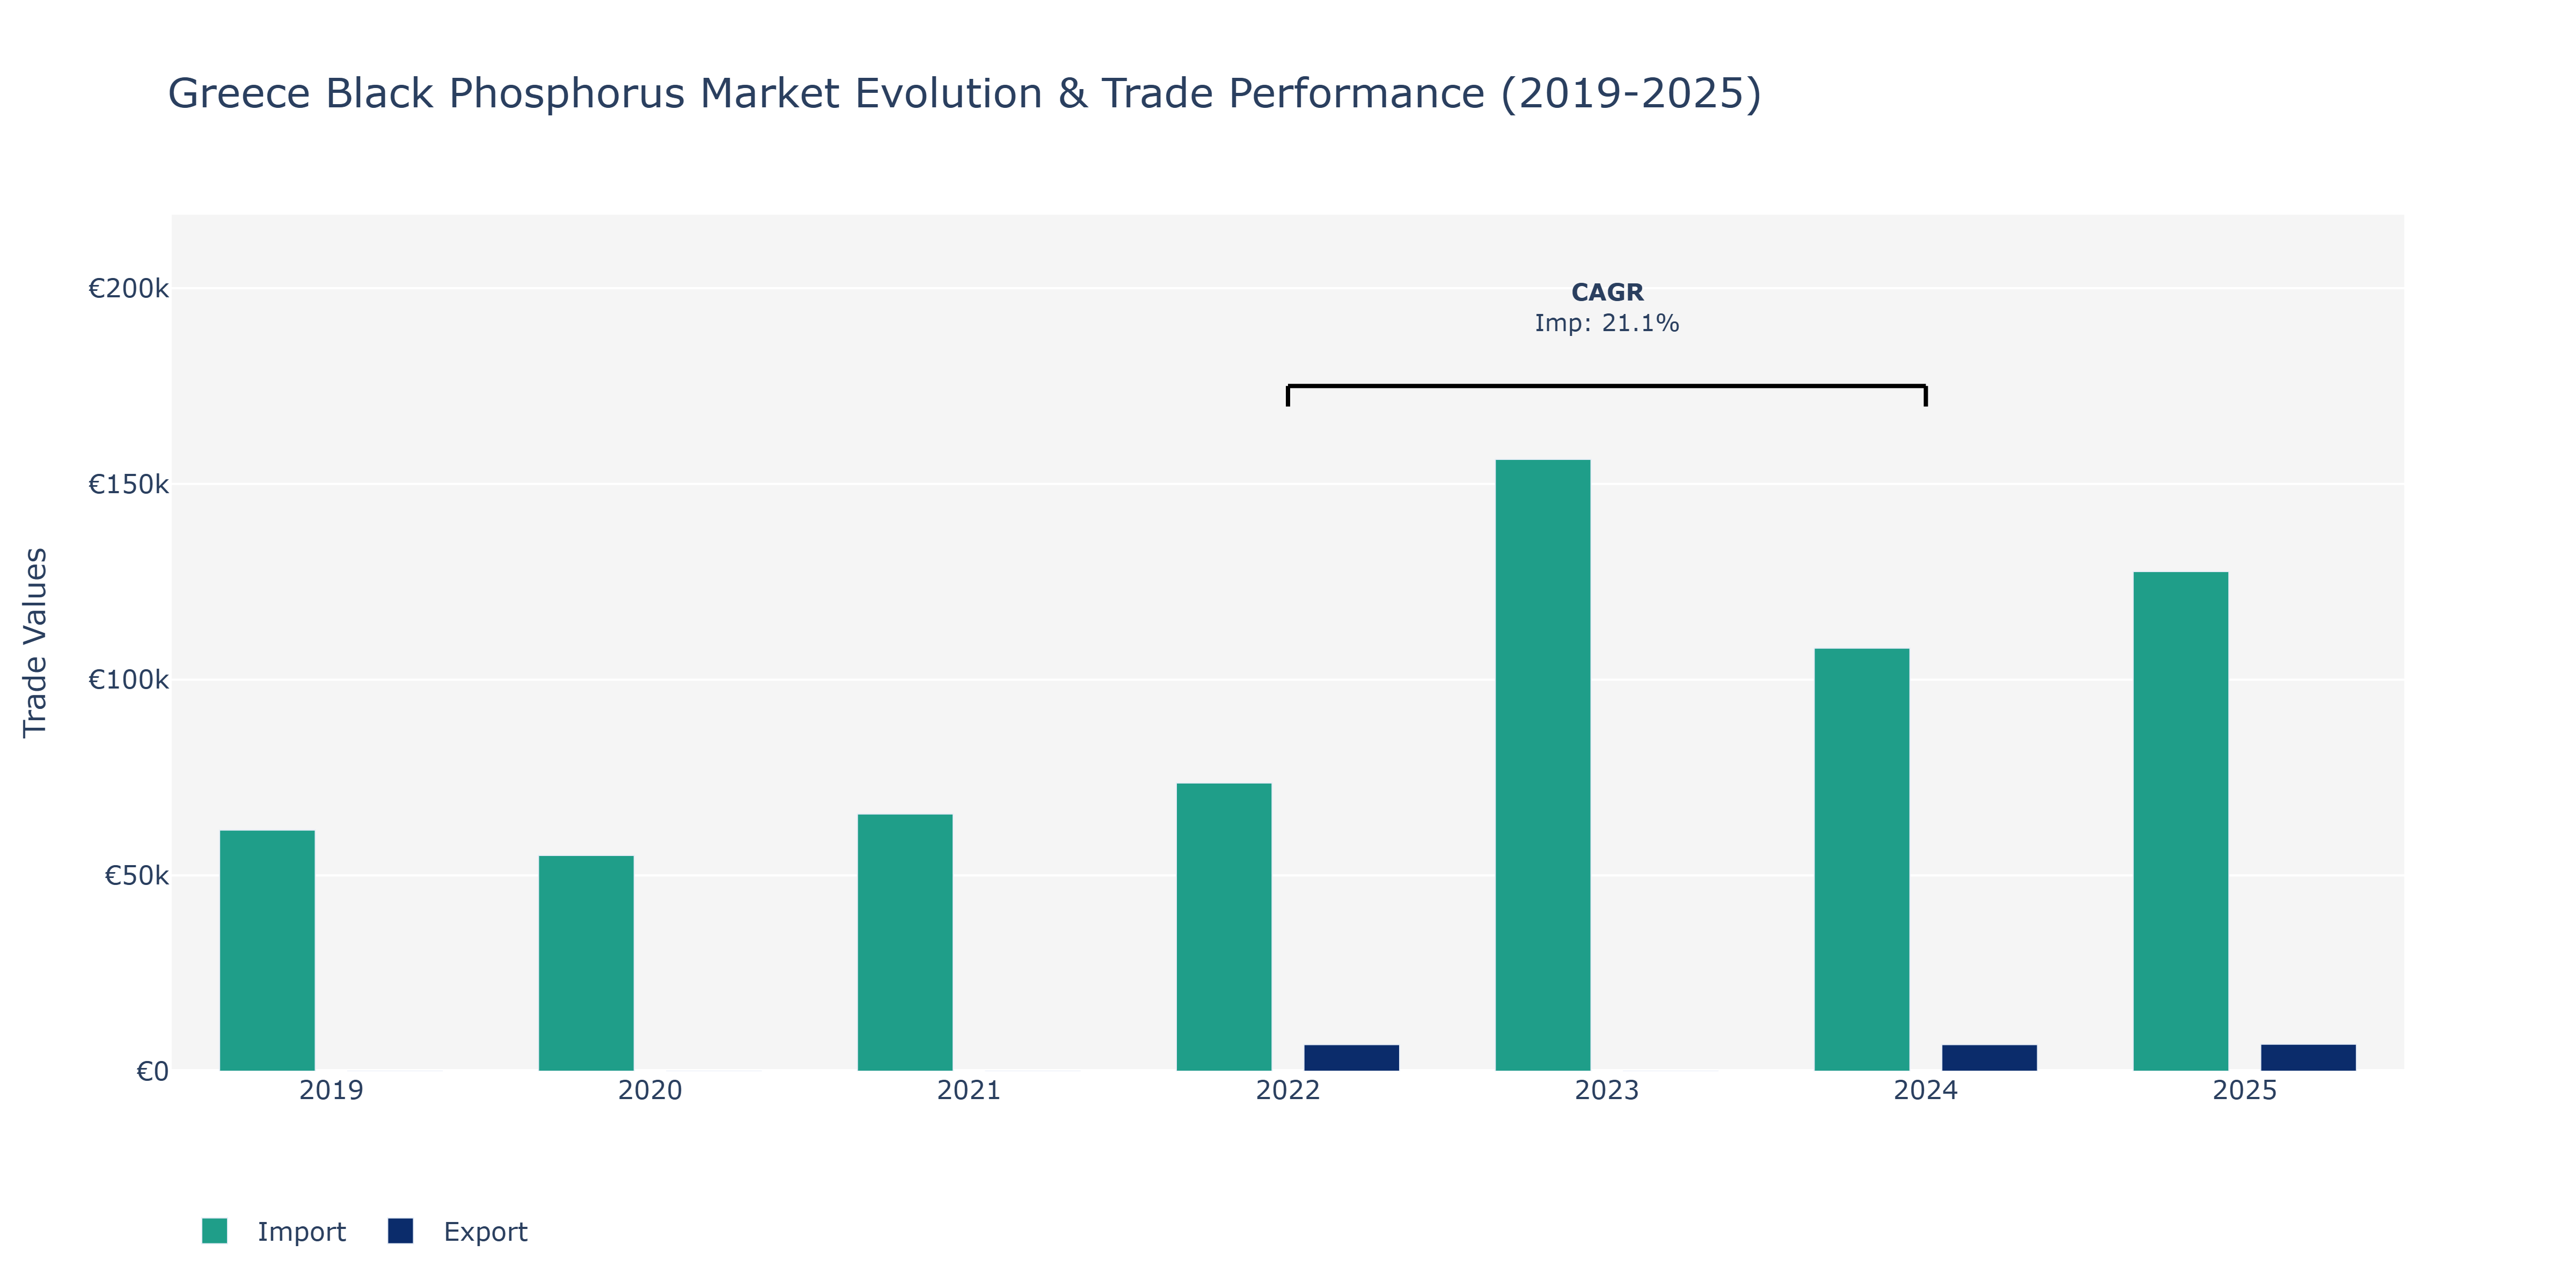
In the Greece Black Phosphorus Market, imports experienced varying trends over the years. In 2019, imports stood at €61.58 thousand, dipping slightly to €55.11 thousand in 2020 before rebounding to €65.71 thousand in 2021. The year 2022 marked a notable upturn with imports reaching €73.62 thousand. Subsequently, there was a substantial surge in 2023 to €156.28 thousand. This surge continued into 2024, reaching €108.05 thousand. In contrast, exports remained relatively stable at around €6.78 thousand in both 2022 and 2024, with a slight uptick to approximately €6.89 thousand in 2025. The import fluctuations can be attributed to various factors such as changes in demand from key industries using black phosphorus, global market dynamics, and shifts in domestic production capacities. The consistent exports indicate a balanced market with stable overseas demand. To sustain growth in imports, market players could focus on enhancing supply chain efficiency and optimizing procurement strategies in response to evolving market conditions.
Key Highlights of the Report:
- Greece Black Phosphorus Market Outlook
- Market Size of Greece Black Phosphorus Market, 2025
- Forecast of Greece Black Phosphorus Market, 2032
- Historical Data and Forecast of Greece Black Phosphorus Revenues & Volume for the Period 2022-2032F
- Greece Black Phosphorus Market Trend Evolution
- Greece Black Phosphorus Market Drivers and Challenges
- Greece Black Phosphorus Price Trends
- Greece Black Phosphorus Porter`s Five Forces
- Greece Black Phosphorus Industry Life Cycle
- Historical Data and Forecast of Greece Black Phosphorus Market Revenues & Volume By Form for the Period 2022-2032F
- Historical Data and Forecast of Greece Black Phosphorus Market Revenues & Volume By Crystal for the Period 2022-2032F
- Historical Data and Forecast of Greece Black Phosphorus Market Revenues & Volume By Powder for the Period 2022-2032F
- Historical Data and Forecast of Greece Black Phosphorus Market Revenues & Volume By Application for the Period 2022-2032F
- Historical Data and Forecast of Greece Black Phosphorus Market Revenues & Volume By Electronic Devices for the Period 2022-2032F
- Historical Data and Forecast of Greece Black Phosphorus Market Revenues & Volume By Energy Storage for the Period 2022-2032F
- Historical Data and Forecast of Greece Black Phosphorus Market Revenues & Volume By Sensors for the Period 2022-2032F
- Greece Black Phosphorus Import Export Trade Statistics
- Market Opportunity Assessment By Form
- Market Opportunity Assessment By Application
- Greece Black Phosphorus Top Companies Market Share
- Greece Black Phosphorus Competitive Benchmarking By Technical and Operational Parameters
- Greece Black Phosphorus Company Profiles
- Greece Black Phosphorus Key Strategic Recommendations
Frequently Asked Questions About the Market Study (FAQs):
6Wresearch actively monitors the Greece Black Phosphorus Market and publishes its comprehensive annual report, highlighting emerging trends, growth drivers, revenue analysis, and forecast outlook. Our insights help businesses to make data-backed strategic decisions with ongoing market dynamics. Our analysts track relevent industries related to the Greece Black Phosphorus Market, allowing our clients with actionable intelligence and reliable forecasts tailored to emerging regional needs.
Yes, we provide customisation as per your requirements. To learn more, feel free to contact us on sales@6wresearch.com
1 Executive Summary |
2 Introduction |
2.1 Key Highlights of the Report |
2.2 Report Description |
2.3 Market Scope & Segmentation |
2.4 Research Methodology |
2.5 Assumptions |
3 Greece Black Phosphorus Market Overview |
3.1 Greece Country Macro Economic Indicators |
3.2 Greece Black Phosphorus Market Revenues & Volume, 2022 & 2032F |
3.3 Greece Black Phosphorus Market - Industry Life Cycle |
3.4 Greece Black Phosphorus Market - Porter's Five Forces |
3.5 Greece Black Phosphorus Market Revenues & Volume Share, By Form, 2022 & 2032F |
3.6 Greece Black Phosphorus Market Revenues & Volume Share, By Application, 2022 & 2032F |
4 Greece Black Phosphorus Market Dynamics |
4.1 Impact Analysis |
4.2 Market Drivers |
4.2.1 Increasing demand for black phosphorus in the electronics industry for applications such as batteries, sensors, and semiconductor devices. |
4.2.2 Growing awareness about the unique properties of black phosphorus, such as high carrier mobility and tunable bandgap, driving research and development activities. |
4.2.3 Government initiatives and investments to promote the development of the semiconductor industry in Greece. |
4.3 Market Restraints |
4.3.1 High production costs associated with the synthesis of high-quality black phosphorus material. |
4.3.2 Limited availability of raw materials for black phosphorus production in Greece, leading to supply chain challenges. |
4.3.3 Technological challenges in scaling up the production of black phosphorus to meet market demand. |
5 Greece Black Phosphorus Market Trends |
6 Greece Black Phosphorus Market Segmentations |
6.1 Greece Black Phosphorus Market, By Form |
6.1.1 Overview and Analysis |
6.1.2 Greece Black Phosphorus Market Revenues & Volume, By Crystal, 2022-2032F |
6.1.3 Greece Black Phosphorus Market Revenues & Volume, By Powder, 2022-2032F |
6.2 Greece Black Phosphorus Market, By Application |
6.2.1 Overview and Analysis |
6.2.2 Greece Black Phosphorus Market Revenues & Volume, By Electronic Devices, 2022-2032F |
6.2.3 Greece Black Phosphorus Market Revenues & Volume, By Energy Storage, 2022-2032F |
6.2.4 Greece Black Phosphorus Market Revenues & Volume, By Sensors, 2022-2032F |
7 Greece Black Phosphorus Market Import-Export Trade Statistics |
7.1 Greece Black Phosphorus Market Export to Major Countries |
7.2 Greece Black Phosphorus Market Imports from Major Countries |
8 Greece Black Phosphorus Market Key Performance Indicators |
8.1 Research and development investments in black phosphorus technologies. |
8.2 Number of patents filed for black phosphorus applications. |
8.3 Adoption rate of black phosphorus-based products in key industries such as electronics and energy storage. |
9 Greece Black Phosphorus Market - Opportunity Assessment |
9.1 Greece Black Phosphorus Market Opportunity Assessment, By Form, 2022 & 2032F |
9.2 Greece Black Phosphorus Market Opportunity Assessment, By Application, 2022 & 2032F |
10 Greece Black Phosphorus Market - Competitive Landscape |
10.1 Greece Black Phosphorus Market Revenue Share, By Companies, 2025 |
10.2 Greece Black Phosphorus Market Competitive Benchmarking, By Operating and Technical Parameters |
11 Company Profiles |
12 Recommendations | 13 Disclaimer |
Export potential assessment - trade Analytics for 2030
Export potential enables firms to identify high-growth global markets with greater confidence by combining advanced trade intelligence with a structured quantitative methodology. The framework analyzes emerging demand trends and country-level import patterns while integrating macroeconomic and trade datasets such as GDP and population forecasts, bilateral import–export flows, tariff structures, elasticity differentials between developed and developing economies, geographic distance, and import demand projections. Using weighted trade values from 2020–2024 as the base period to project country-to-country export potential for 2030, these inputs are operationalized through calculated drivers such as gravity model parameters, tariff impact factors, and projected GDP per-capita growth. Through an analysis of hidden potentials, demand hotspots, and market conditions that are most favorable to success, this method enables firms to focus on target countries, maximize returns, and global expansion with data, backed by accuracy.
By factoring in the projected importer demand gap that is currently unmet and could be potential opportunity, it identifies the potential for the Exporter (Country) among 190 countries, against the general trade analysis, which identifies the biggest importer or exporter.
To discover high-growth global markets and optimize your business strategy:
Click Here
Pricing
- Single User License$ 1,995
- Department License$ 2,400
- Site License$ 3,120
- Global License$ 3,795

Thought Leadership
Search
Thought Leadership and Analyst Meet


Our Clients
Latest Reports
- New Zealand Aseptic Manufacturing Market (2026-2032)
- Netherlands Aseptic Manufacturing Market (2026-2032)
- Nauru Aseptic Manufacturing Market (2026-2032)
- Namibia Aseptic Manufacturing Market (2026-2032)
- Mozambique Aseptic Manufacturing Market (2026-2032)
- Montenegro Aseptic Manufacturing Market (2026-2032)
- Mongolia Aseptic Manufacturing Market (2026-2032)
- Monaco Aseptic Manufacturing Market (2026-2032)
- Micronesia Aseptic Manufacturing Market (2026-2032)
- Mauritius Aseptic Manufacturing Market (2026-2032)
Industry Events and Analyst Meet

HIMTEX 2026

India Refining Summit 2026

India EV Show 2026

EV tech India Expo 2026

Auto Tech Asia 2026
Whitepaper
- Middle East & Africa Commercial Security Market Click here to view more.
- Middle East & Africa Fire Safety Systems & Equipment Market Click here to view more.
- GCC Drone Market Click here to view more.
- Middle East Lighting Fixture Market Click here to view more.
- GCC Physical & Perimeter Security Market Click here to view more.
6WResearch In News
- Doha a strategic location for EV manufacturing hub: IPA Qatar
- Demand for luxury TVs surging in the GCC, says Samsung
- Empowering Growth: The Thriving Journey of Bangladesh’s Cable Industry
- Demand for luxury TVs surging in the GCC, says Samsung
- Video call with a traditional healer? Once unthinkable, it’s now common in South Africa
- Intelligent Buildings To Smooth GCC’s Path To Net Zero