Grenada Interactive Tables Market (2026-2032) | Revenue, Forecast, Outlook, Segmentation, Size, Trends, Share, Value, Analysis, Industry, Growth & Companies
Market Forecast By Technology (LCD, LED, Capacitive, Others), By Screen Size (32-65 Inch, 65 Inch & Above), By Application (Exhibition & Trade Shows, Education, Retail, Control Room, Hospitality, Transportation, Others) And Competitive Landscape
| Product Code: ETC5147006 | Publication Date: Nov 2023 | Updated Date: Apr 2026 | Product Type: Market Research Report | |
| Publisher: 6Wresearch | Author: Bhawna Singh | No. of Pages: 60 | No. of Figures: 30 | No. of Tables: 5 |
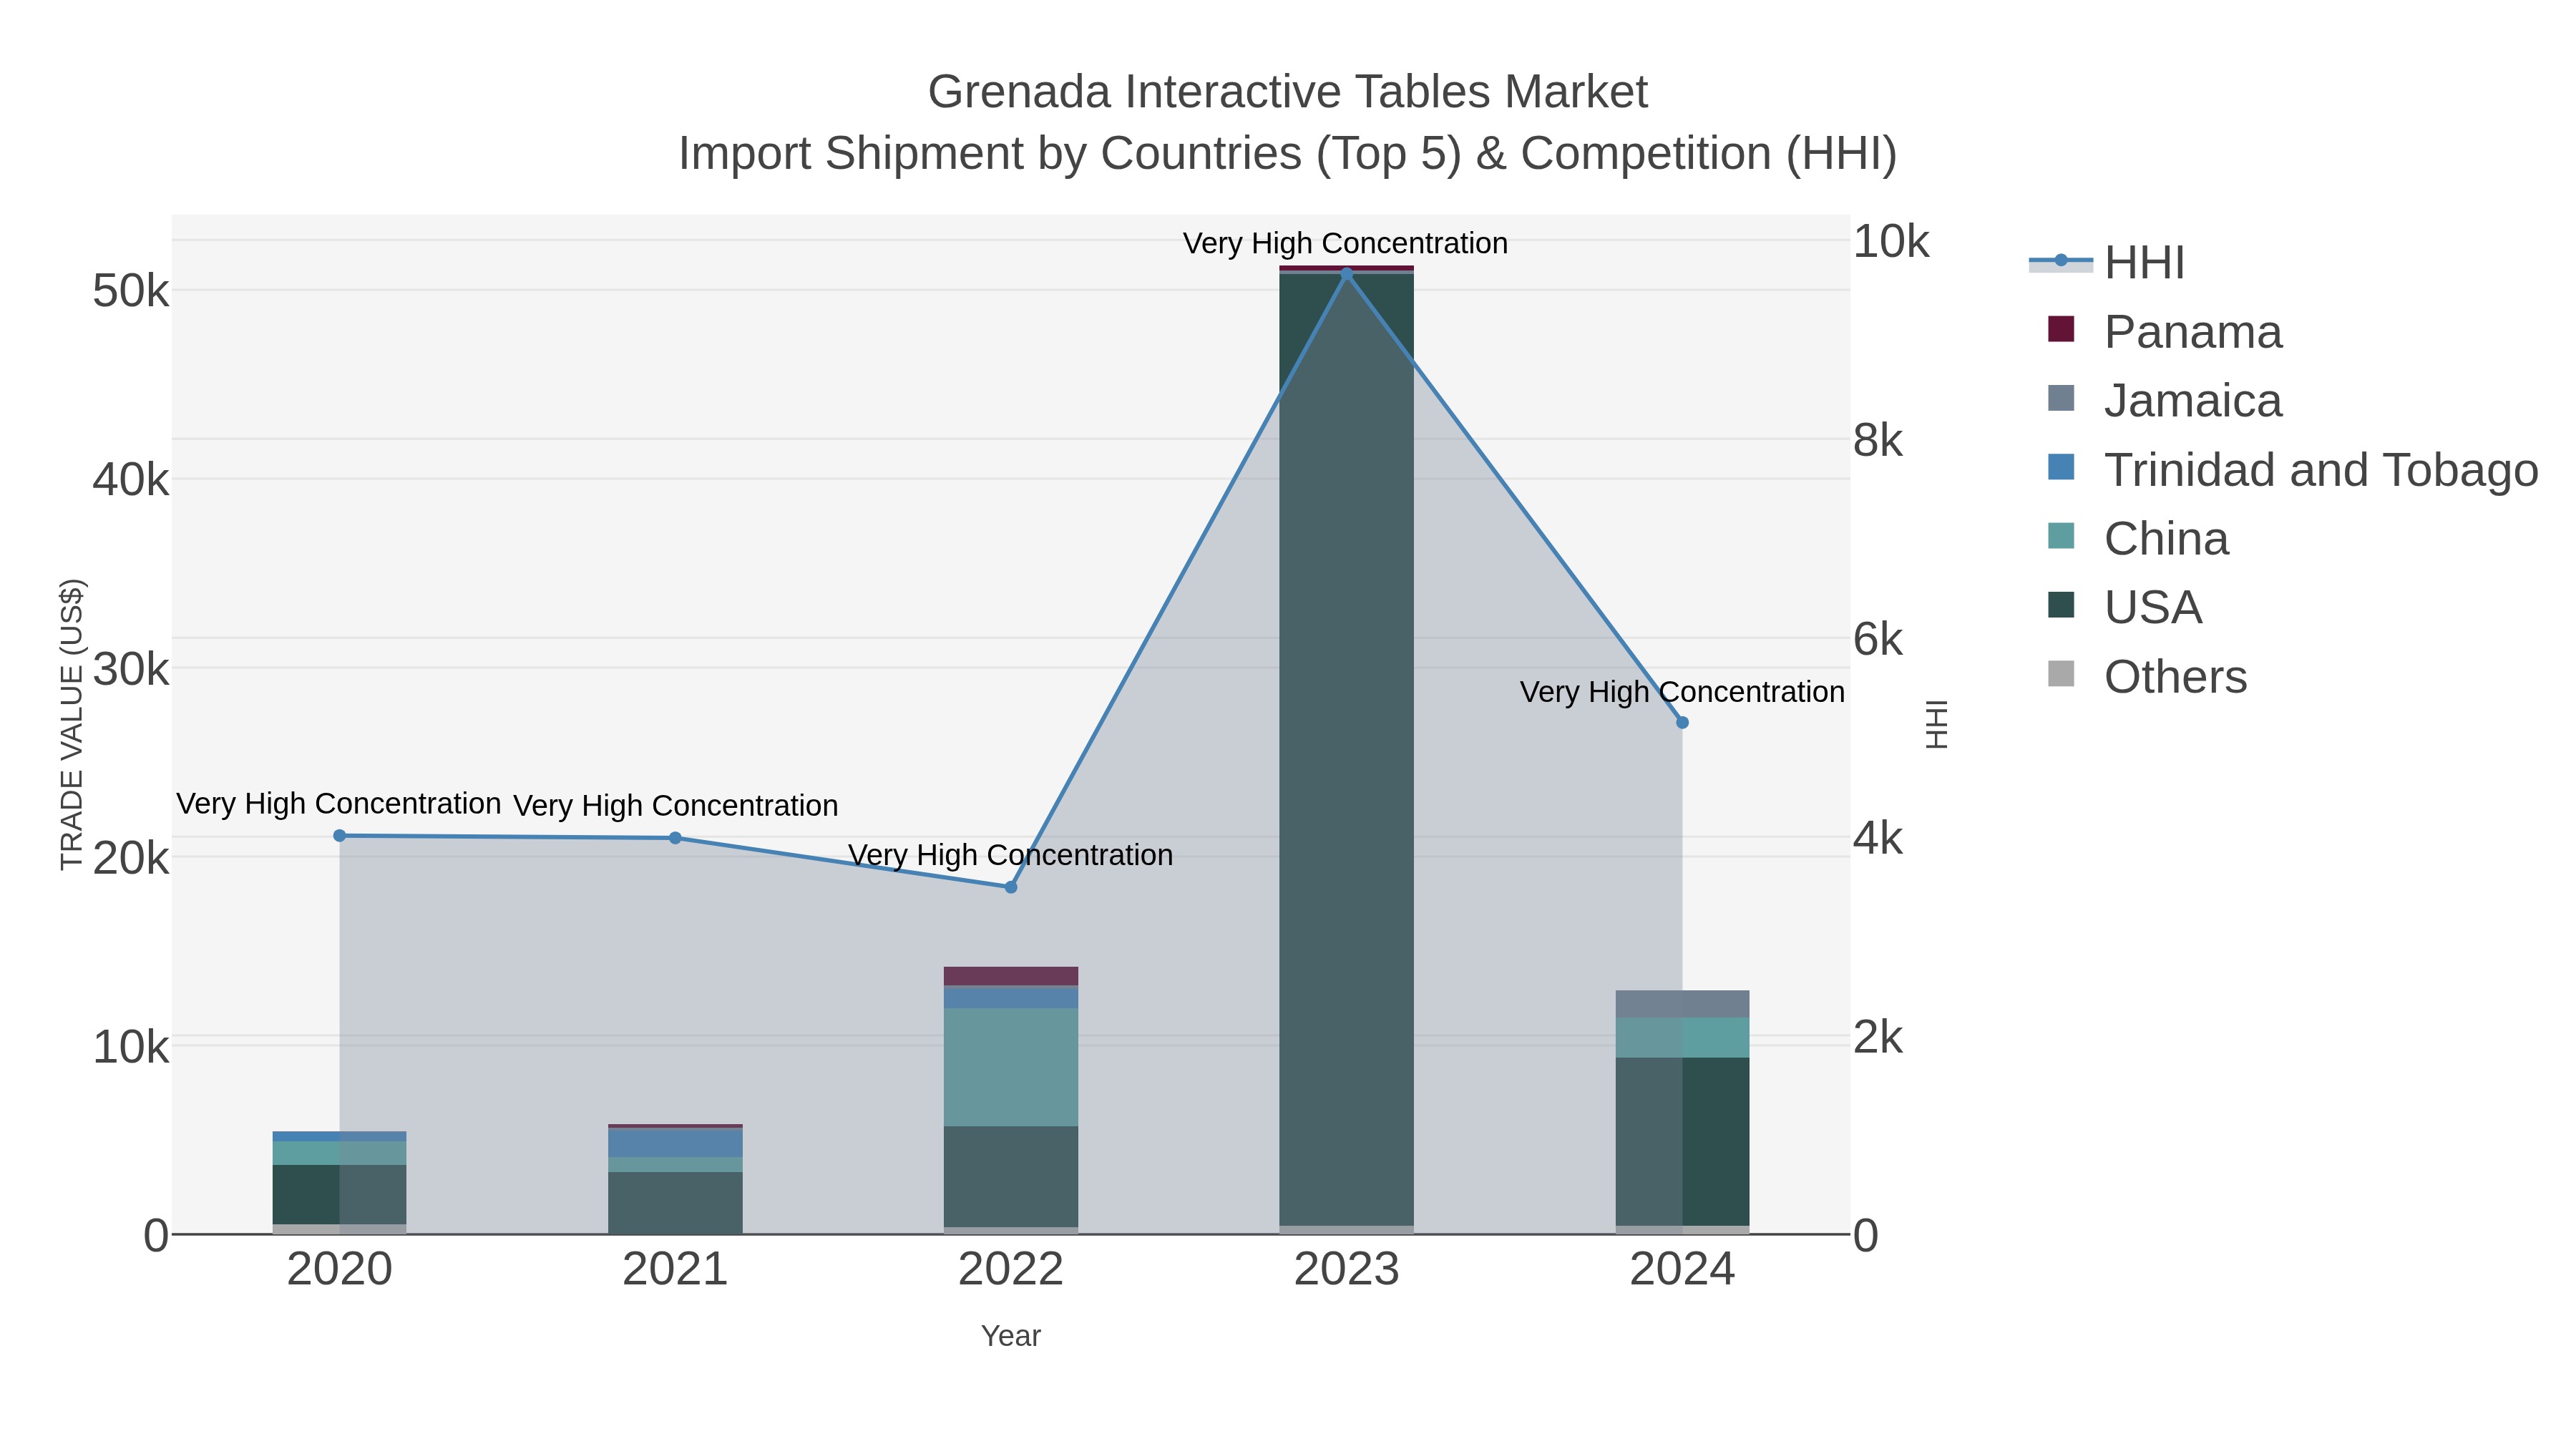
Grenada Interactive Tables Market Top 5 Importing Countries and Market Competition (HHI) Analysis
Grenada`s interactive tables import market in 2024 continued to see a significant influx of shipments from top exporting countries such as the USA, China, Jamaica, UK, and Canada. Despite the high concentration of market share indicated by the Herfindahl-Hirschman Index (HHI), the industry demonstrated a remarkable compound annual growth rate (CAGR) of 24.01% from 2020 to 2024. However, there was a sharp decline in growth rate from 2023 to 2024, with a decrease of -74.81%. This fluctuation highlights the dynamic nature of the market and the need for strategic adaptation to changing trends.
Grenada Interactive Tables Market Overview
The interactive tables market in Grenada is growing, driven by demand from education, retail, and entertainment sectors. Interactive tables provide an engaging platform for users to interact with digital content through touch. As Grenada continues to modernize its educational and commercial environments, the use of interactive tables is becoming more prevalent in classrooms, malls, and exhibition spaces, creating a dynamic and immersive user experience.
Drivers of the market
The interactive table market in Grenada is driven by the increasing adoption of interactive and collaborative technologies in education and business. Interactive tables offer a hands-on approach to learning and meetings, making them popular in schools, universities, and corporate environments.
Challenges of the market
The interactive tables market in Grenada faces challenges related to technological adoption and the need for infrastructure. Interactive tables, which enable touch-based interaction and collaborative activities, are gaining popularity in sectors like education, hospitality, and retail. However, the high initial investment required for these technologies limits their accessibility to larger organizations with sufficient budgets. Smaller businesses, particularly those in industries that are less dependent on interactive technologies, are less likely to invest in these solutions. Furthermore, Grenadas relatively small market size means that the demand for interactive tables is limited, and businesses may struggle to see a clear return on investment.
Government Policy of the market
The government is promoting interactive tables as part of the broader strategy to modernize educational tools and public service engagement. These technologies are being used in classrooms, museums, and public exhibitions to create engaging and interactive environments.
Key Highlights of the Report:
- Grenada Interactive Tables Market Outlook
- Market Size of Grenada Interactive Tables Market, 2025
- Forecast of Grenada Interactive Tables Market, 2032
- Historical Data and Forecast of Grenada Interactive Tables Revenues & Volume for the Period 2022 - 2032
- Grenada Interactive Tables Market Trend Evolution
- Grenada Interactive Tables Market Drivers and Challenges
- Grenada Interactive Tables Price Trends
- Grenada Interactive Tables Porter`s Five Forces
- Grenada Interactive Tables Industry Life Cycle
- Historical Data and Forecast of Grenada Interactive Tables Market Revenues & Volume By Technology for the Period 2022 - 2032
- Historical Data and Forecast of Grenada Interactive Tables Market Revenues & Volume By LCD for the Period 2022 - 2032
- Historical Data and Forecast of Grenada Interactive Tables Market Revenues & Volume By LED for the Period 2022 - 2032
- Historical Data and Forecast of Grenada Interactive Tables Market Revenues & Volume By Capacitive for the Period 2022 - 2032
- Historical Data and Forecast of Grenada Interactive Tables Market Revenues & Volume By Others for the Period 2022 - 2032
- Historical Data and Forecast of Grenada Interactive Tables Market Revenues & Volume By Screen Size for the Period 2022 - 2032
- Historical Data and Forecast of Grenada Interactive Tables Market Revenues & Volume By 32-65 Inch for the Period 2022 - 2032
- Historical Data and Forecast of Grenada Interactive Tables Market Revenues & Volume By 65 Inch & Above for the Period 2022 - 2032
- Historical Data and Forecast of Grenada Interactive Tables Market Revenues & Volume By Application for the Period 2022 - 2032
- Historical Data and Forecast of Grenada Interactive Tables Market Revenues & Volume By Exhibition & Trade Shows for the Period 2022 - 2032
- Historical Data and Forecast of Grenada Interactive Tables Market Revenues & Volume By Education for the Period 2022 - 2032
- Historical Data and Forecast of Grenada Interactive Tables Market Revenues & Volume By Retail for the Period 2022 - 2032
- Historical Data and Forecast of Grenada Interactive Tables Market Revenues & Volume By Control Room for the Period 2022 - 2032
- Historical Data and Forecast of Grenada Interactive Tables Market Revenues & Volume By Hospitality for the Period 2022 - 2032
- Historical Data and Forecast of Grenada Interactive Tables Market Revenues & Volume By Transportation for the Period 2022 - 2032
- Historical Data and Forecast of Grenada Interactive Tables Market Revenues & Volume By Others for the Period 2022 - 2032
- Grenada Interactive Tables Import Export Trade Statistics
- Market Opportunity Assessment By Technology
- Market Opportunity Assessment By Screen Size
- Market Opportunity Assessment By Application
- Grenada Interactive Tables Top Companies Market Share
- Grenada Interactive Tables Competitive Benchmarking By Technical and Operational Parameters
- Grenada Interactive Tables Company Profiles
- Grenada Interactive Tables Key Strategic Recommendations
Frequently Asked Questions About the Market Study (FAQs):
6Wresearch actively monitors the Grenada Interactive Tables Market and publishes its comprehensive annual report, highlighting emerging trends, growth drivers, revenue analysis, and forecast outlook. Our insights help businesses to make data-backed strategic decisions with ongoing market dynamics. Our analysts track relevent industries related to the Grenada Interactive Tables Market, allowing our clients with actionable intelligence and reliable forecasts tailored to emerging regional needs.
Yes, we provide customisation as per your requirements. To learn more, feel free to contact us on sales@6wresearch.com
1 Executive Summary |
2 Introduction |
2.1 Key Highlights of the Report |
2.2 Report Description |
2.3 Market Scope & Segmentation |
2.4 Research Methodology |
2.5 Assumptions |
3 Grenada Interactive Tables Market Overview |
3.1 Grenada Country Macro Economic Indicators |
3.2 Grenada Interactive Tables Market Revenues & Volume, 2022 & 2032F |
3.3 Grenada Interactive Tables Market - Industry Life Cycle |
3.4 Grenada Interactive Tables Market - Porter's Five Forces |
3.5 Grenada Interactive Tables Market Revenues & Volume Share, By Technology, 2022 & 2032F |
3.6 Grenada Interactive Tables Market Revenues & Volume Share, By Screen Size, 2022 & 2032F |
3.7 Grenada Interactive Tables Market Revenues & Volume Share, By Application, 2022 & 2032F |
4 Grenada Interactive Tables Market Dynamics |
4.1 Impact Analysis |
4.2 Market Drivers |
4.2.1 Increasing demand for interactive and engaging technology solutions in educational institutions and corporate settings |
4.2.2 Growing trend of digitalization and adoption of technology in various industries |
4.2.3 Rising focus on enhancing customer experience and engagement in the hospitality sector |
4.3 Market Restraints |
4.3.1 High initial investment and maintenance costs associated with interactive tables |
4.3.2 Limited awareness and understanding of the benefits of interactive tables among potential customers |
4.3.3 Concerns regarding data privacy and security issues related to interactive technology |
5 Grenada Interactive Tables Market Trends |
6 Grenada Interactive Tables Market Segmentations |
6.1 Grenada Interactive Tables Market, By Technology |
6.1.1 Overview and Analysis |
6.1.2 Grenada Interactive Tables Market Revenues & Volume, By LCD, 2022-2032F |
6.1.3 Grenada Interactive Tables Market Revenues & Volume, By LED, 2022-2032F |
6.1.4 Grenada Interactive Tables Market Revenues & Volume, By Capacitive, 2022-2032F |
6.1.5 Grenada Interactive Tables Market Revenues & Volume, By Others, 2022-2032F |
6.2 Grenada Interactive Tables Market, By Screen Size |
6.2.1 Overview and Analysis |
6.2.2 Grenada Interactive Tables Market Revenues & Volume, By 32-65 Inch, 2022-2032F |
6.2.3 Grenada Interactive Tables Market Revenues & Volume, By 65 Inch & Above, 2022-2032F |
6.3 Grenada Interactive Tables Market, By Application |
6.3.1 Overview and Analysis |
6.3.2 Grenada Interactive Tables Market Revenues & Volume, By Exhibition & Trade Shows, 2022-2032F |
6.3.3 Grenada Interactive Tables Market Revenues & Volume, By Education, 2022-2032F |
6.3.4 Grenada Interactive Tables Market Revenues & Volume, By Retail, 2022-2032F |
6.3.5 Grenada Interactive Tables Market Revenues & Volume, By Control Room, 2022-2032F |
6.3.6 Grenada Interactive Tables Market Revenues & Volume, By Hospitality, 2022-2032F |
6.3.7 Grenada Interactive Tables Market Revenues & Volume, By Transportation, 2022-2032F |
7 Grenada Interactive Tables Market Import-Export Trade Statistics |
7.1 Grenada Interactive Tables Market Export to Major Countries |
7.2 Grenada Interactive Tables Market Imports from Major Countries |
8 Grenada Interactive Tables Market Key Performance Indicators |
8.1 Average time spent on interactive tables per user/session |
8.2 Rate of adoption of interactive tables in new markets/industries |
8.3 Customer satisfaction scores related to the use of interactive tables |
8.4 Percentage increase in repeat business or customer retention rates through the use of interactive tables |
8.5 Number of partnerships or collaborations with technology providers for enhancing interactive table features and capabilities. |
9 Grenada Interactive Tables Market - Opportunity Assessment |
9.1 Grenada Interactive Tables Market Opportunity Assessment, By Technology, 2022 & 2032F |
9.2 Grenada Interactive Tables Market Opportunity Assessment, By Screen Size, 2022 & 2032F |
9.3 Grenada Interactive Tables Market Opportunity Assessment, By Application, 2022 & 2032F |
10 Grenada Interactive Tables Market - Competitive Landscape |
10.1 Grenada Interactive Tables Market Revenue Share, By Companies, 2025 |
10.2 Grenada Interactive Tables Market Competitive Benchmarking, By Operating and Technical Parameters |
11 Company Profiles |
12 Recommendations | 13 Disclaimer |
Global Go To Market Strategy - 2030
Export potential enables firms to identify high-growth global markets with greater confidence by combining advanced trade intelligence with a structured quantitative methodology. The framework analyzes emerging demand trends and country-level import patterns while integrating macroeconomic and trade datasets such as GDP and population forecasts, bilateral import–export flows, tariff structures, elasticity differentials between developed and developing economies, geographic distance, and import demand projections. Using weighted trade values from 2020–2024 as the base period to project country-to-country export potential for 2030, these inputs are operationalized through calculated drivers such as gravity model parameters, tariff impact factors, and projected GDP per-capita growth. Through an analysis of hidden potentials, demand hotspots, and market conditions that are most favorable to success, this method enables firms to focus on target countries, maximize returns, and global expansion with data, backed by accuracy.
By factoring in the projected importer demand gap that is currently unmet and could be potential opportunity, it identifies the potential for the Exporter (Country) among 190 countries, against the general trade analysis, which identifies the biggest importer or exporter.
To discover high-growth global markets and optimize your business strategy:
Click Here
Pricing
- Single User License$ 1,995
- Department License$ 2,400
- Site License$ 3,120
- Global License$ 3,795

Leadership Perspectives from Industry Events
Search
Thought Leadership and Analyst Meet


Our Clients
6WResearch In News
- India Export Attractiveness Tracker 2026
- India Air Conditioner Market Set for Strong Rebound in 2026 After Weather-Led Correction and GST-Driven Recovery: 6Wresearch
- ADAS in India: How Automatic Emergency Braking, Blind Spot Detection & Driver Monitoring are Transforming Road Safety
- Doha a strategic location for EV manufacturing hub: IPA Qatar
- Demand for luxury TVs surging in the GCC, says Samsung
- Empowering Growth: The Thriving Journey of Bangladesh’s Cable Industry
Latest Reports
- Nicaragua RPG Gaming Market (2026-2032)
- New Zealand RPG Gaming Market (2026-2032)
- Netherlands RPG Gaming Market (2026-2032)
- Nauru RPG Gaming Market (2026-2032)
- Namibia RPG Gaming Market (2026-2032)
- Mozambique RPG Gaming Market (2026-2032)
- Montenegro RPG Gaming Market (2026-2032)
- Mongolia RPG Gaming Market (2026-2032)
- Monaco RPG Gaming Market (2026-2032)
- Micronesia RPG Gaming Market (2026-2032)
Industry Events and Analyst Meet

EV India Expo 2026

HIMTEX 2026

India Refining Summit 2026

India EV Show 2026

EV tech India Expo 2026
Whitepaper
- Middle East & Africa Commercial Security Market Click here to view more.
- Middle East & Africa Fire Safety Systems & Equipment Market Click here to view more.
- GCC Drone Market Click here to view more.
- Middle East Lighting Fixture Market Click here to view more.
- GCC Physical & Perimeter Security Market Click here to view more.