Grenada Solid Beverages Market (2026-2032) | Industry, Consumer Insights, Forecast, Strategy, Supply, Growth, Drivers, Outlook, Opportunities, Competitive, Strategic Insights, Segmentation, Investment Trends, Competition, Demand, Trends, Pricing Analysis, Revenue, Analysis, Companies, Restraints, Size, Value, Segments, Share, Challenges
Market Forecast By Type (Instant Coffee, Powdered Juice, Herbal Drinks, Energy Mixes, Others), By Ingredients (Dairy based, Plant based, Protein based, Vitamins & Minerals, Others), By Packaging (Sachets, Jars, Bottles, Cans, Others), By Distribution Channel (Supermarkets & Hypermarkets, Online Retail, Convenience Stores, Specialty Stores, Others) And Competitive Landscape
| Product Code: ETC10288486 | Publication Date: Apr 2025 | Updated Date: Apr 2026 | Product Type: Market Research Report | |
| Publisher: 6Wresearch | Author: Bhawna Singh | No. of Pages: 65 | No. of Figures: 34 | No. of Tables: 19 |
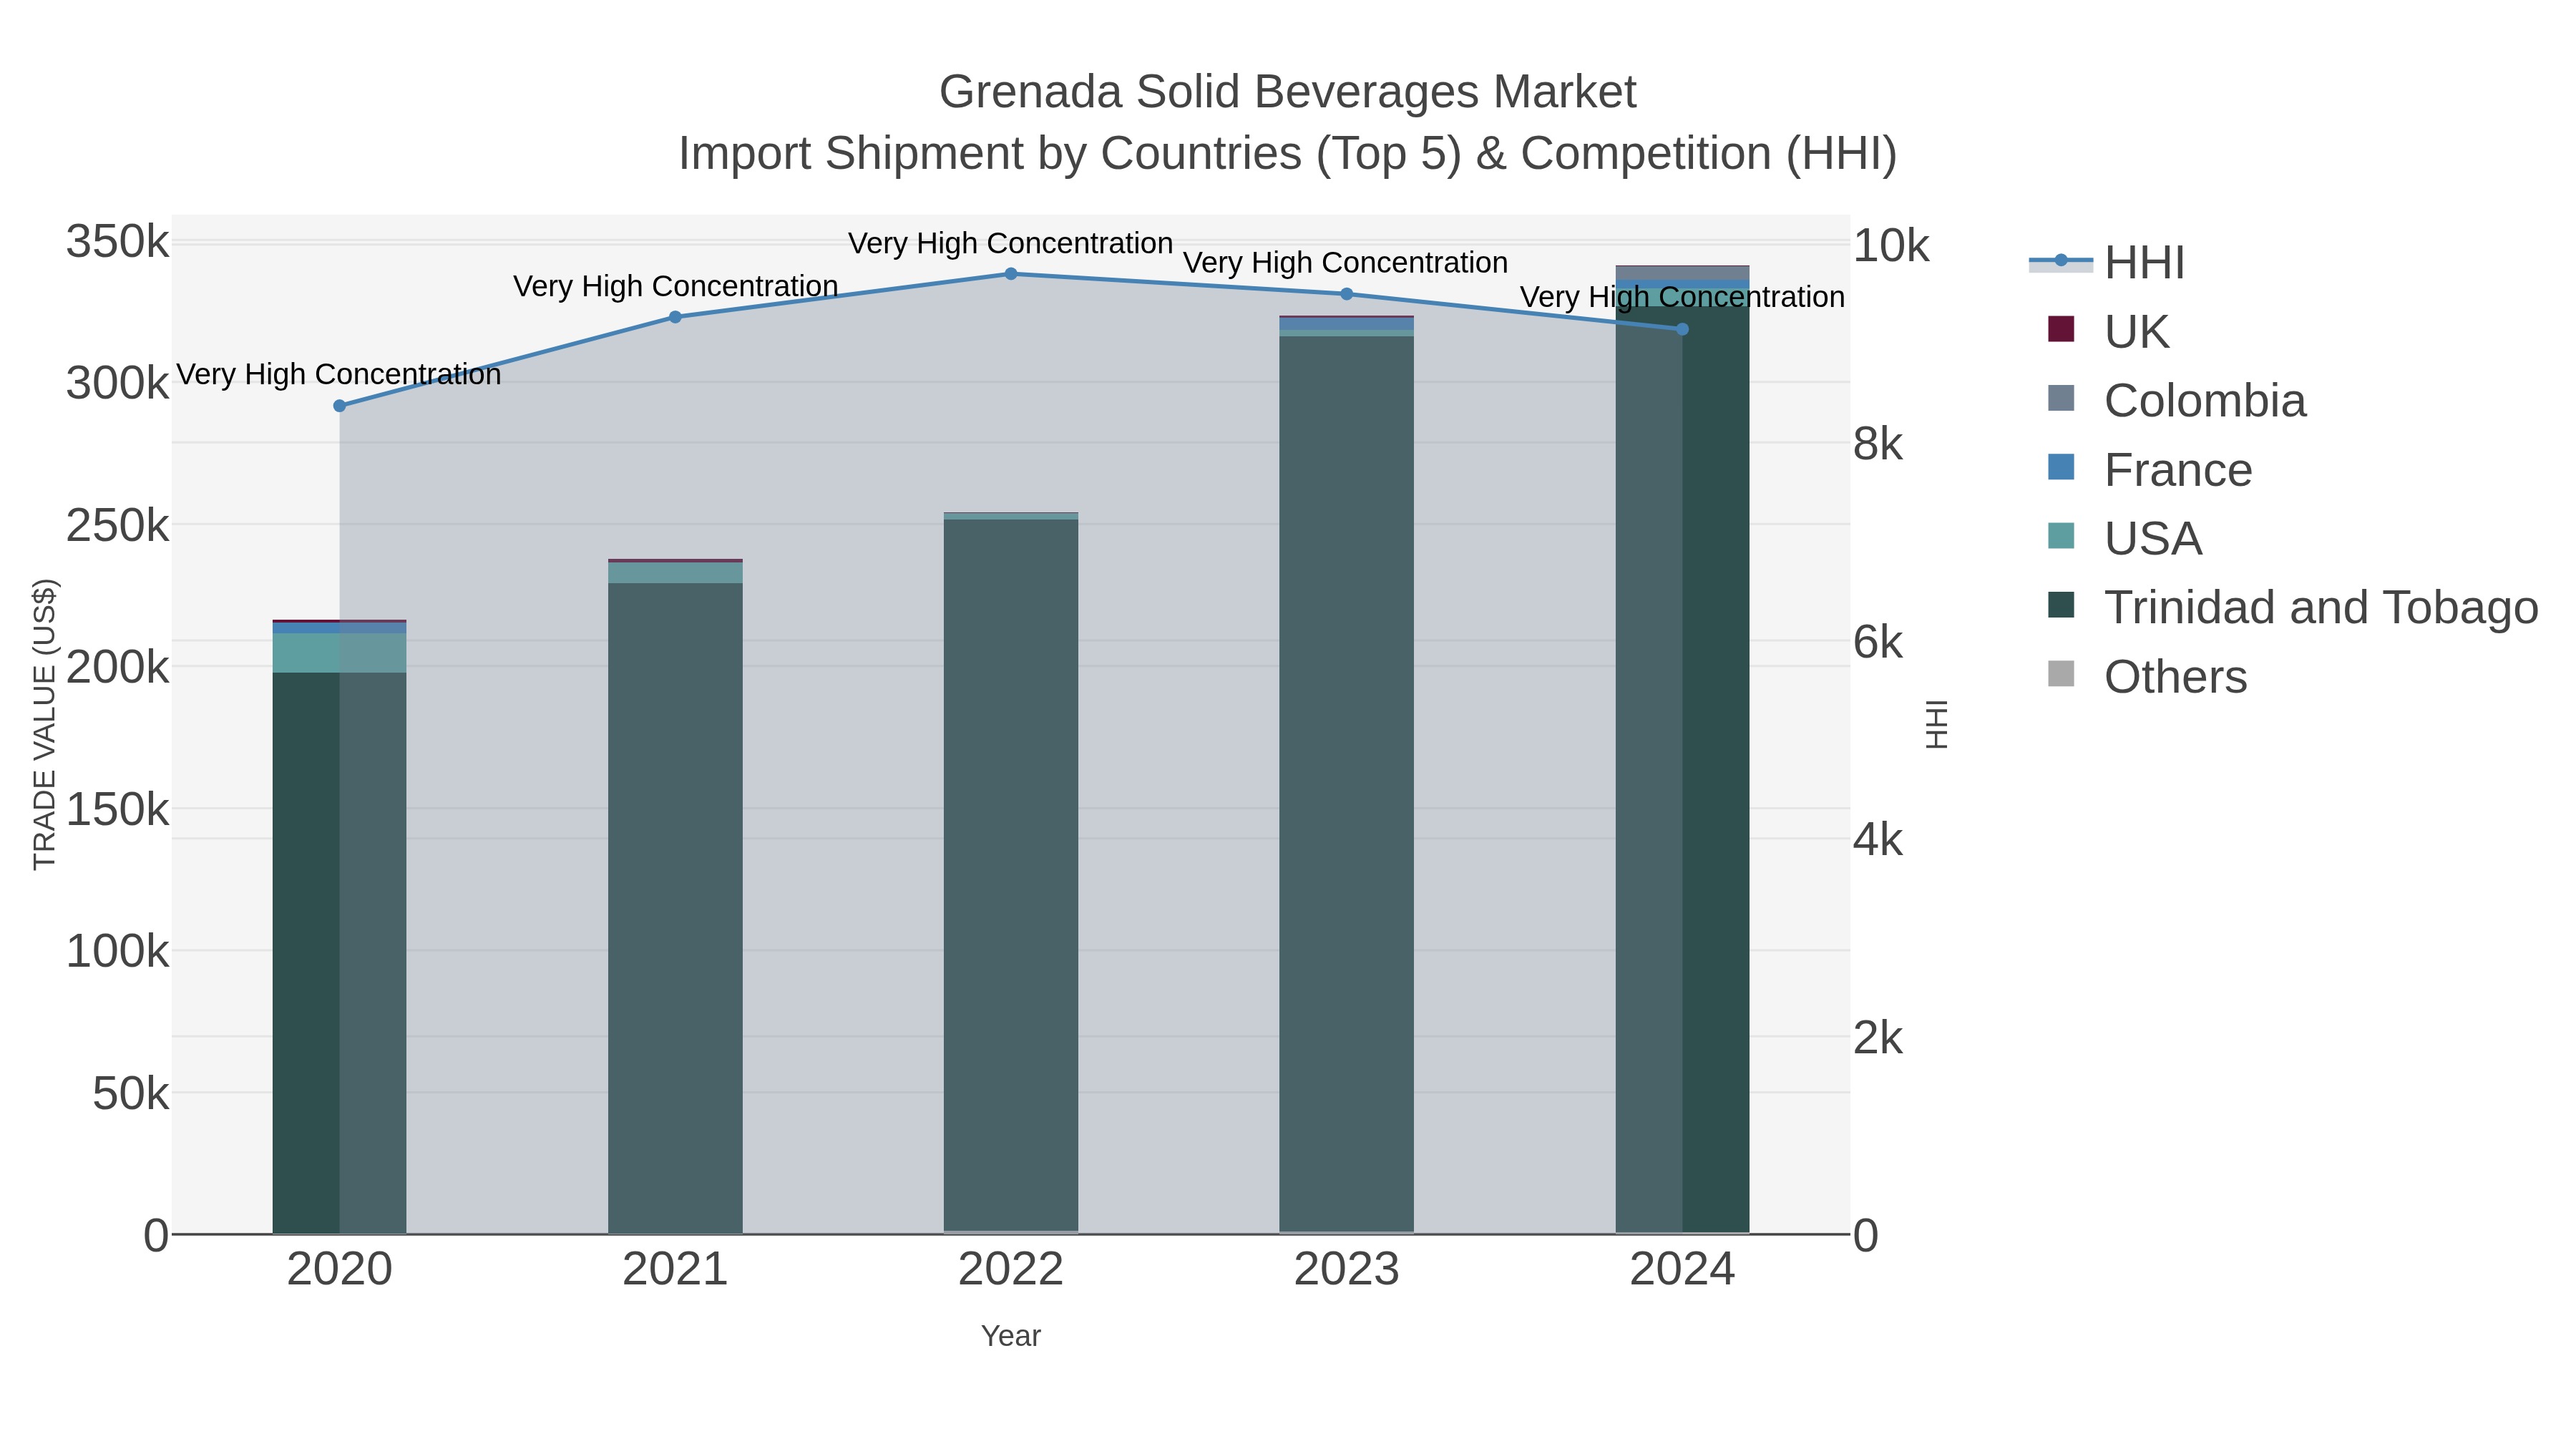
Grenada Solid Beverages Market Top 5 Importing Countries and Market Competition (HHI) Analysis
Grenada`s solid beverages import market continued to show strong growth in 2024, with key exporting countries such as Trinidad and Tobago, USA, Colombia, France, and Turkey dominating the market. The high Herfindahl-Hirschman Index (HHI) indicates a concentration of import shipments among these top countries. With a notable Compound Annual Growth Rate (CAGR) of 12.05% from 2020 to 2024 and a steady growth rate of 5.45% in 2023-24, the solid beverages market in Grenada is poised for further expansion and opportunities in the coming years.
Key Highlights of the Report:
- Grenada Solid Beverages Market Outlook
- Market Size of Grenada Solid Beverages Market, 2025
- Forecast of Grenada Solid Beverages Market, 2032
- Historical Data and Forecast of Grenada Solid Beverages Revenues & Volume for the Period 2022 - 2032F
- Grenada Solid Beverages Market Trend Evolution
- Grenada Solid Beverages Market Drivers and Challenges
- Grenada Solid Beverages Price Trends
- Grenada Solid Beverages Porter's Five Forces
- Grenada Solid Beverages Industry Life Cycle
- Historical Data and Forecast of Grenada Solid Beverages Market Revenues & Volume By Type for the Period 2022 - 2032F
- Historical Data and Forecast of Grenada Solid Beverages Market Revenues & Volume By Instant Coffee for the Period 2022 - 2032F
- Historical Data and Forecast of Grenada Solid Beverages Market Revenues & Volume By Powdered Juice for the Period 2022 - 2032F
- Historical Data and Forecast of Grenada Solid Beverages Market Revenues & Volume By Herbal Drinks for the Period 2022 - 2032F
- Historical Data and Forecast of Grenada Solid Beverages Market Revenues & Volume By Energy Mixes for the Period 2022 - 2032F
- Historical Data and Forecast of Grenada Solid Beverages Market Revenues & Volume By Others for the Period 2022 - 2032F
- Historical Data and Forecast of Grenada Solid Beverages Market Revenues & Volume By Ingredients for the Period 2022 - 2032F
- Historical Data and Forecast of Grenada Solid Beverages Market Revenues & Volume By Dairy based for the Period 2022 - 2032F
- Historical Data and Forecast of Grenada Solid Beverages Market Revenues & Volume By Plant based for the Period 2022 - 2032F
- Historical Data and Forecast of Grenada Solid Beverages Market Revenues & Volume By Protein based for the Period 2022 - 2032F
- Historical Data and Forecast of Grenada Solid Beverages Market Revenues & Volume By Vitamins & Minerals for the Period 2022 - 2032F
- Historical Data and Forecast of Grenada Solid Beverages Market Revenues & Volume By Others for the Period 2022 - 2032F
- Historical Data and Forecast of Grenada Solid Beverages Market Revenues & Volume By Packaging for the Period 2022 - 2032F
- Historical Data and Forecast of Grenada Solid Beverages Market Revenues & Volume By Sachets for the Period 2022 - 2032F
- Historical Data and Forecast of Grenada Solid Beverages Market Revenues & Volume By Jars for the Period 2022 - 2032F
- Historical Data and Forecast of Grenada Solid Beverages Market Revenues & Volume By Bottles for the Period 2022 - 2032F
- Historical Data and Forecast of Grenada Solid Beverages Market Revenues & Volume By Cans for the Period 2022 - 2032F
- Historical Data and Forecast of Grenada Solid Beverages Market Revenues & Volume By Others for the Period 2022 - 2032F
- Historical Data and Forecast of Grenada Solid Beverages Market Revenues & Volume By Distribution Channel for the Period 2022 - 2032F
- Historical Data and Forecast of Grenada Solid Beverages Market Revenues & Volume By Supermarkets & Hypermarkets for the Period 2022 - 2032F
- Historical Data and Forecast of Grenada Solid Beverages Market Revenues & Volume By Online Retail for the Period 2022 - 2032F
- Historical Data and Forecast of Grenada Solid Beverages Market Revenues & Volume By Convenience Stores for the Period 2022 - 2032F
- Historical Data and Forecast of Grenada Solid Beverages Market Revenues & Volume By Specialty Stores for the Period 2022 - 2032F
- Historical Data and Forecast of Grenada Solid Beverages Market Revenues & Volume By Others for the Period 2022 - 2032F
- Grenada Solid Beverages Import Export Trade Statistics
- Market Opportunity Assessment By Type
- Market Opportunity Assessment By Ingredients
- Market Opportunity Assessment By Packaging
- Market Opportunity Assessment By Distribution Channel
- Grenada Solid Beverages Top Companies Market Share
- Grenada Solid Beverages Competitive Benchmarking By Technical and Operational Parameters
- Grenada Solid Beverages Company Profiles
- Grenada Solid Beverages Key Strategic Recommendations
Frequently Asked Questions About the Market Study (FAQs):
6Wresearch actively monitors the Grenada Solid Beverages Market and publishes its comprehensive annual report, highlighting emerging trends, growth drivers, revenue analysis, and forecast outlook. Our insights help businesses to make data-backed strategic decisions with ongoing market dynamics. Our analysts track relevent industries related to the Grenada Solid Beverages Market, allowing our clients with actionable intelligence and reliable forecasts tailored to emerging regional needs.
Yes, we provide customisation as per your requirements. To learn more, feel free to contact us on sales@6wresearch.com
1 Executive Summary |
2 Introduction |
2.1 Key Highlights of the Report |
2.2 Report Description |
2.3 Market Scope & Segmentation |
2.4 Research Methodology |
2.5 Assumptions |
3 Grenada Solid Beverages Market Overview |
3.1 Grenada Country Macro Economic Indicators |
3.2 Grenada Solid Beverages Market Revenues & Volume, 2022 & 2032F |
3.3 Grenada Solid Beverages Market - Industry Life Cycle |
3.4 Grenada Solid Beverages Market - Porter's Five Forces |
3.5 Grenada Solid Beverages Market Revenues & Volume Share, By Type, 2022 & 2032F |
3.6 Grenada Solid Beverages Market Revenues & Volume Share, By Ingredients, 2022 & 2032F |
3.7 Grenada Solid Beverages Market Revenues & Volume Share, By Packaging, 2022 & 2032F |
3.8 Grenada Solid Beverages Market Revenues & Volume Share, By Distribution Channel, 2022 & 2032F |
4 Grenada Solid Beverages Market Dynamics |
4.1 Impact Analysis |
4.2 Market Drivers |
4.2.1 Increasing consumer awareness and demand for natural and healthy beverage options |
4.2.2 Growing popularity of convenience products among busy urban populations |
4.2.3 Rising disposable incomes leading to higher spending on premium beverage products |
4.3 Market Restraints |
4.3.1 Fluctuating prices of raw materials such as cocoa and sugar impacting production costs |
4.3.2 Intense competition from other beverage categories like ready-to-drink beverages |
4.3.3 Challenges in distribution and logistics, especially in reaching remote or rural areas |
5 Grenada Solid Beverages Market Trends |
6 Grenada Solid Beverages Market, By Types |
6.1 Grenada Solid Beverages Market, By Type |
6.1.1 Overview and Analysis |
6.1.2 Grenada Solid Beverages Market Revenues & Volume, By Type, 2022 - 2032F |
6.1.3 Grenada Solid Beverages Market Revenues & Volume, By Instant Coffee, 2022 - 2032F |
6.1.4 Grenada Solid Beverages Market Revenues & Volume, By Powdered Juice, 2022 - 2032F |
6.1.5 Grenada Solid Beverages Market Revenues & Volume, By Herbal Drinks, 2022 - 2032F |
6.1.6 Grenada Solid Beverages Market Revenues & Volume, By Energy Mixes, 2022 - 2032F |
6.1.7 Grenada Solid Beverages Market Revenues & Volume, By Others, 2022 - 2032F |
6.2 Grenada Solid Beverages Market, By Ingredients |
6.2.1 Overview and Analysis |
6.2.2 Grenada Solid Beverages Market Revenues & Volume, By Dairy based, 2022 - 2032F |
6.2.3 Grenada Solid Beverages Market Revenues & Volume, By Plant based, 2022 - 2032F |
6.2.4 Grenada Solid Beverages Market Revenues & Volume, By Protein based, 2022 - 2032F |
6.2.5 Grenada Solid Beverages Market Revenues & Volume, By Vitamins & Minerals, 2022 - 2032F |
6.2.6 Grenada Solid Beverages Market Revenues & Volume, By Others, 2022 - 2032F |
6.3 Grenada Solid Beverages Market, By Packaging |
6.3.1 Overview and Analysis |
6.3.2 Grenada Solid Beverages Market Revenues & Volume, By Sachets, 2022 - 2032F |
6.3.3 Grenada Solid Beverages Market Revenues & Volume, By Jars, 2022 - 2032F |
6.3.4 Grenada Solid Beverages Market Revenues & Volume, By Bottles, 2022 - 2032F |
6.3.5 Grenada Solid Beverages Market Revenues & Volume, By Cans, 2022 - 2032F |
6.3.6 Grenada Solid Beverages Market Revenues & Volume, By Others, 2022 - 2032F |
6.4 Grenada Solid Beverages Market, By Distribution Channel |
6.4.1 Overview and Analysis |
6.4.2 Grenada Solid Beverages Market Revenues & Volume, By Supermarkets & Hypermarkets, 2022 - 2032F |
6.4.3 Grenada Solid Beverages Market Revenues & Volume, By Online Retail, 2022 - 2032F |
6.4.4 Grenada Solid Beverages Market Revenues & Volume, By Convenience Stores, 2022 - 2032F |
6.4.5 Grenada Solid Beverages Market Revenues & Volume, By Specialty Stores, 2022 - 2032F |
6.4.6 Grenada Solid Beverages Market Revenues & Volume, By Others, 2022 - 2032F |
7 Grenada Solid Beverages Market Import-Export Trade Statistics |
7.1 Grenada Solid Beverages Market Export to Major Countries |
7.2 Grenada Solid Beverages Market Imports from Major Countries |
8 Grenada Solid Beverages Market Key Performance Indicators |
8.1 Percentage of repeat customers indicating brand loyalty and satisfaction |
8.2 Customer engagement metrics on social media platforms showing growing interest and interaction |
8.3 Rate of new product innovation and launch frequency demonstrating market responsiveness and adaptability |
9 Grenada Solid Beverages Market - Opportunity Assessment |
9.1 Grenada Solid Beverages Market Opportunity Assessment, By Type, 2022 & 2032F |
9.2 Grenada Solid Beverages Market Opportunity Assessment, By Ingredients, 2022 & 2032F |
9.3 Grenada Solid Beverages Market Opportunity Assessment, By Packaging, 2022 & 2032F |
9.4 Grenada Solid Beverages Market Opportunity Assessment, By Distribution Channel, 2022 & 2032F |
10 Grenada Solid Beverages Market - Competitive Landscape |
10.1 Grenada Solid Beverages Market Revenue Share, By Companies, 2025 |
10.2 Grenada Solid Beverages Market Competitive Benchmarking, By Operating and Technical Parameters |
11 Company Profiles |
12 Recommendations |
13 Disclaimer |
Export potential assessment - trade Analytics for 2030
Export potential enables firms to identify high-growth global markets with greater confidence by combining advanced trade intelligence with a structured quantitative methodology. The framework analyzes emerging demand trends and country-level import patterns while integrating macroeconomic and trade datasets such as GDP and population forecasts, bilateral import–export flows, tariff structures, elasticity differentials between developed and developing economies, geographic distance, and import demand projections. Using weighted trade values from 2020–2024 as the base period to project country-to-country export potential for 2030, these inputs are operationalized through calculated drivers such as gravity model parameters, tariff impact factors, and projected GDP per-capita growth. Through an analysis of hidden potentials, demand hotspots, and market conditions that are most favorable to success, this method enables firms to focus on target countries, maximize returns, and global expansion with data, backed by accuracy.
By factoring in the projected importer demand gap that is currently unmet and could be potential opportunity, it identifies the potential for the Exporter (Country) among 190 countries, against the general trade analysis, which identifies the biggest importer or exporter.
To discover high-growth global markets and optimize your business strategy:
Click Here
Pricing
- Single User License$ 1,995
- Department License$ 2,400
- Site License$ 3,120
- Global License$ 3,795

Search
Thought Leadership and Analyst Meet


Our Clients
Latest Reports
- Canada Cloud CFD Market (2026-2032) | Size & Revenue, Industry, Growth, Competitive Landscape, Forecast, Segmentation, Value, Outlook, Trends, Share, Analysis, Companies
- Taiwan Food Delivery Platform Market (2026-2032) | Companies, Outlook, Analysis, Trends, Value, Revenue, Segmentation, Share, Forecast, Competitive Landscape, Growth, Size & Forecast
- United Kingdom (UK) Long-term Care Insurance Market (2026-2032) | Growth, Share, Consumer Insights, Drivers, Opportunities, Competition, Pricing Analysis, Segments, Restraints, Companies, Competitive, Value, Outlook, Size, Demand, Analysis, Challenges, Strategic Insights, Investment Trends, Revenue, Trends, Supply, Forecast
- United Kingdom (UK) Long Term Care Market (2026-2032) | Companies, Outlook, Analysis, Trends, Value, Revenue, Segmentation, Share, Forecast, Competitive Landscape, Growth, Size & Forecast
- Iraq Insulation and Waterproofing Market (2026-2032) | Outlook, Drivers, Growth, Size, Share, Industry, Revenue, Trends, Demand, Competitive, Strategic Insights, Opportunities, Segments, Companies, Challenges, Strategy, Consumer Insights, Analysis, Investment Trends, Value, Segmentation, Forecast, Restraints
- India Switchgear Market Outlook (2026-2032) | Size, Share, Trends, Growth, Revenue, Forecast, Analysis, Value, Outlook
- Pakistan Contraceptive Implants Market (2025-2031) | Demand, Growth, Size, Share, Industry, Pricing Analysis, Competitive, Strategic Insights, Strategy, Consumer Insights, Analysis, Investment Trends, Opportunities, Revenue, Segments, Value, Segmentation, Supply, Forecast, Restraints, Outlook, Competition, Drivers, Trends, Companies, Challenges
- Sri Lanka Packaging Market (2026-2032) | Outlook, Competition, Drivers, Trends, Demand, Pricing Analysis, Competitive, Strategic Insights, Companies, Challenges, Strategy, Consumer Insights, Analysis, Investment Trends, Opportunities, Growth, Size, Share, Industry, Revenue, Segments, Value, Segmentation, Supply, Forecast, Restraints
- India Kids Watches Market (2026-2032) | Strategy, Consumer Insights, Analysis, Investment Trends, Opportunities, Growth, Size, Share, Industry, Revenue, Segments, Value, Segmentation, Supply, Forecast, Restraints, Outlook, Competition, Drivers, Trends, Demand, Pricing Analysis, Competitive, Strategic Insights, Companies, Challenges
- Saudi Arabia Core Assurance Service Market (2025-2031) | Strategy, Consumer Insights, Analysis, Investment Trends, Opportunities, Growth, Size, Share, Industry, Revenue, Segments, Value, Segmentation, Supply, Forecast, Restraints, Outlook, Competition, Drivers, Trends, Demand, Pricing Analysis, Competitive, Strategic Insights, Companies, Challenges
Industry Events and Analyst Meet

India EV Show 2026

EV tech India Expo 2026

Auto Tech Asia 2026

Battery Tech India 2026

Smart Production Solutions Guangzhou 2026
Whitepaper
- Middle East & Africa Commercial Security Market Click here to view more.
- Middle East & Africa Fire Safety Systems & Equipment Market Click here to view more.
- GCC Drone Market Click here to view more.
- Middle East Lighting Fixture Market Click here to view more.
- GCC Physical & Perimeter Security Market Click here to view more.
6WResearch In News
- Doha a strategic location for EV manufacturing hub: IPA Qatar
- Demand for luxury TVs surging in the GCC, says Samsung
- Empowering Growth: The Thriving Journey of Bangladesh’s Cable Industry
- Demand for luxury TVs surging in the GCC, says Samsung
- Video call with a traditional healer? Once unthinkable, it’s now common in South Africa
- Intelligent Buildings To Smooth GCC’s Path To Net Zero