Guatemala Proteasome Inhibitors Market (2026-2032) | Companies, Competitive Landscape, Industry, Value, Share, Forecast, Outlook, Size & Revenue, Trends, Growth, Analysis, Segmentation
Market Forecast By Product (Velcade, Kyprolis, Ninlaro), By Drugs (Bortezomib, Carfilzomib, Ixazomib), By Indication (Lymphoma, Mantle Cell Lymphoma, Multiple Myeloma), By Distribution Channel (Hospital Pharmacy, Online Pharmacy, Retail Pharmacy), By End-Users (Hospitals, Specialty Clinics) And Competitive Landscape
| Product Code: ETC7400700 | Publication Date: Sep 2024 | Updated Date: Apr 2026 | Product Type: Market Research Report | |
| Publisher: 6Wresearch | Author: Dhaval Chaurasia | No. of Pages: 75 | No. of Figures: 35 | No. of Tables: 20 |
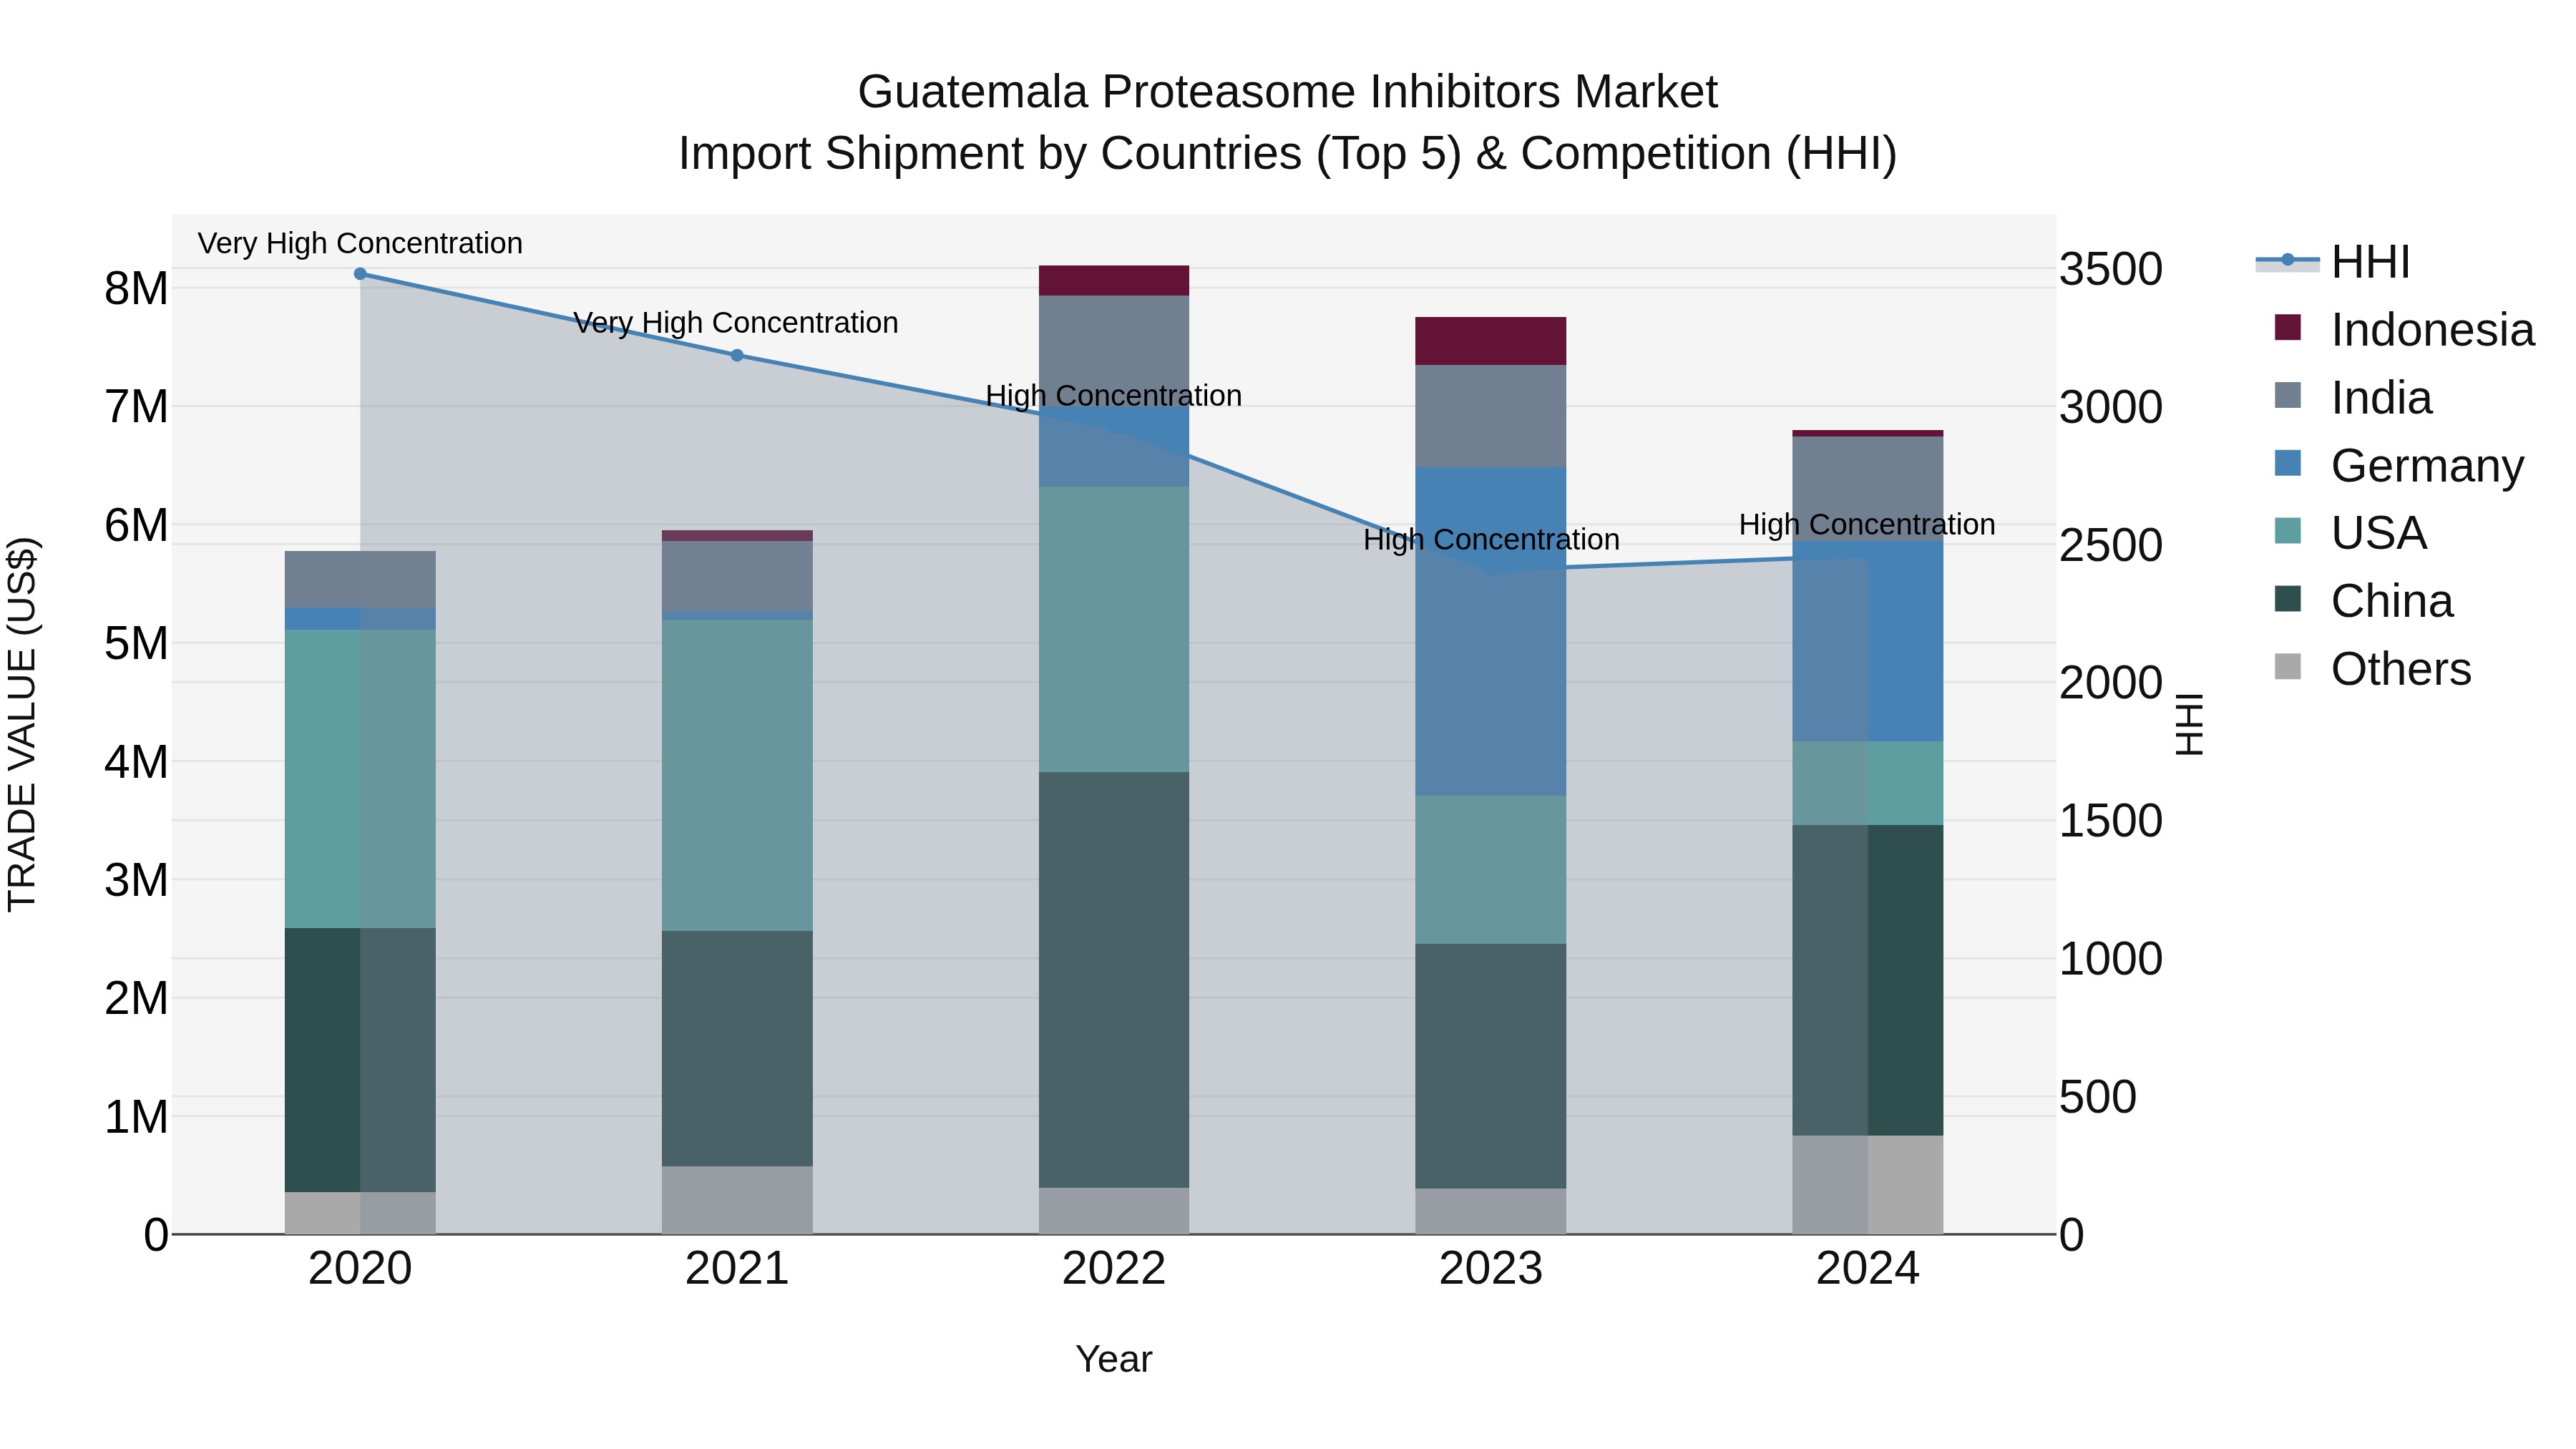
Guatemala Proteasome Inhibitors Market Top 5 Importing Countries and Market Competition (HHI) Analysis
Guatemala`s import shipments of proteasome inhibitors in 2024 were primarily sourced from key exporting countries like China, Germany, India, USA, and Brazil. Despite a slightly negative growth rate from 2023 to 2024, the compound annual growth rate (CAGR) for 2020-24 stood at a healthy 4.14%. The high Herfindahl-Hirschman Index (HHI) indicates a concentrated market, potentially offering both opportunities and challenges for market players in the proteasome inhibitors sector in Guatemala.
Key Highlights of the Report:
- Guatemala Proteasome Inhibitors Market Outlook
- Market Size of Guatemala Proteasome Inhibitors Market, 2025
- Forecast of Guatemala Proteasome Inhibitors Market, 2032
- Historical Data and Forecast of Guatemala Proteasome Inhibitors Revenues & Volume for the Period 2022 - 2032
- Guatemala Proteasome Inhibitors Market Trend Evolution
- Guatemala Proteasome Inhibitors Market Drivers and Challenges
- Guatemala Proteasome Inhibitors Price Trends
- Guatemala Proteasome Inhibitors Porter's Five Forces
- Guatemala Proteasome Inhibitors Industry Life Cycle
- Historical Data and Forecast of Guatemala Proteasome Inhibitors Market Revenues & Volume By Product for the Period 2022 - 2032
- Historical Data and Forecast of Guatemala Proteasome Inhibitors Market Revenues & Volume By Velcade for the Period 2022 - 2032
- Historical Data and Forecast of Guatemala Proteasome Inhibitors Market Revenues & Volume By Kyprolis for the Period 2022 - 2032
- Historical Data and Forecast of Guatemala Proteasome Inhibitors Market Revenues & Volume By Ninlaro for the Period 2022 - 2032
- Historical Data and Forecast of Guatemala Proteasome Inhibitors Market Revenues & Volume By Drugs for the Period 2022 - 2032
- Historical Data and Forecast of Guatemala Proteasome Inhibitors Market Revenues & Volume By Bortezomib for the Period 2022 - 2032
- Historical Data and Forecast of Guatemala Proteasome Inhibitors Market Revenues & Volume By Carfilzomib for the Period 2022 - 2032
- Historical Data and Forecast of Guatemala Proteasome Inhibitors Market Revenues & Volume By Ixazomib for the Period 2022 - 2032
- Historical Data and Forecast of Guatemala Proteasome Inhibitors Market Revenues & Volume By Indication for the Period 2022 - 2032
- Historical Data and Forecast of Guatemala Proteasome Inhibitors Market Revenues & Volume By Lymphoma for the Period 2022 - 2032
- Historical Data and Forecast of Guatemala Proteasome Inhibitors Market Revenues & Volume By Mantle Cell Lymphoma for the Period 2022 - 2032
- Historical Data and Forecast of Guatemala Proteasome Inhibitors Market Revenues & Volume By Multiple Myeloma for the Period 2022 - 2032
- Historical Data and Forecast of Guatemala Proteasome Inhibitors Market Revenues & Volume By Distribution Channel for the Period 2022 - 2032
- Historical Data and Forecast of Guatemala Proteasome Inhibitors Market Revenues & Volume By Hospital Pharmacy for the Period 2022 - 2032
- Historical Data and Forecast of Guatemala Proteasome Inhibitors Market Revenues & Volume By Online Pharmacy for the Period 2022 - 2032
- Historical Data and Forecast of Guatemala Proteasome Inhibitors Market Revenues & Volume By Retail Pharmacy for the Period 2022 - 2032
- Historical Data and Forecast of Guatemala Proteasome Inhibitors Market Revenues & Volume By End-Users for the Period 2022 - 2032
- Historical Data and Forecast of Guatemala Proteasome Inhibitors Market Revenues & Volume By Hospitals for the Period 2022 - 2032
- Historical Data and Forecast of Guatemala Proteasome Inhibitors Market Revenues & Volume By Specialty Clinics for the Period 2022 - 2032
- Guatemala Proteasome Inhibitors Import Export Trade Statistics
- Market Opportunity Assessment By Product
- Market Opportunity Assessment By Drugs
- Market Opportunity Assessment By Indication
- Market Opportunity Assessment By Distribution Channel
- Market Opportunity Assessment By End-Users
- Guatemala Proteasome Inhibitors Top Companies Market Share
- Guatemala Proteasome Inhibitors Competitive Benchmarking By Technical and Operational Parameters
- Guatemala Proteasome Inhibitors Company Profiles
- Guatemala Proteasome Inhibitors Key Strategic Recommendations
Frequently Asked Questions About the Market Study (FAQs):
6Wresearch actively monitors the Guatemala Proteasome Inhibitors Market and publishes its comprehensive annual report, highlighting emerging trends, growth drivers, revenue analysis, and forecast outlook. Our insights help businesses to make data-backed strategic decisions with ongoing market dynamics. Our analysts track relevent industries related to the Guatemala Proteasome Inhibitors Market, allowing our clients with actionable intelligence and reliable forecasts tailored to emerging regional needs.
Yes, we provide customisation as per your requirements. To learn more, feel free to contact us on sales@6wresearch.com
1 Executive Summary |
2 Introduction |
2.1 Key Highlights of the Report |
2.2 Report Description |
2.3 Market Scope & Segmentation |
2.4 Research Methodology |
2.5 Assumptions |
3 Guatemala Proteasome Inhibitors Market Overview |
3.1 Guatemala Country Macro Economic Indicators |
3.2 Guatemala Proteasome Inhibitors Market Revenues & Volume, 2022 & 2032F |
3.3 Guatemala Proteasome Inhibitors Market - Industry Life Cycle |
3.4 Guatemala Proteasome Inhibitors Market - Porter's Five Forces |
3.5 Guatemala Proteasome Inhibitors Market Revenues & Volume Share, By Product, 2022 & 2032F |
3.6 Guatemala Proteasome Inhibitors Market Revenues & Volume Share, By Drugs, 2022 & 2032F |
3.7 Guatemala Proteasome Inhibitors Market Revenues & Volume Share, By Indication, 2022 & 2032F |
3.8 Guatemala Proteasome Inhibitors Market Revenues & Volume Share, By Distribution Channel, 2022 & 2032F |
3.9 Guatemala Proteasome Inhibitors Market Revenues & Volume Share, By End-Users, 2022 & 2032F |
4 Guatemala Proteasome Inhibitors Market Dynamics |
4.1 Impact Analysis |
4.2 Market Drivers |
4.2.1 Increasing prevalence of diseases such as multiple myeloma and certain types of cancer that require proteasome inhibitors for treatment. |
4.2.2 Growing awareness about the benefits of proteasome inhibitors in improving treatment outcomes and quality of life for patients. |
4.2.3 Rising investments in healthcare infrastructure and research and development activities in Guatemala. |
4.3 Market Restraints |
4.3.1 High cost of proteasome inhibitors leading to limited affordability for a significant portion of the population. |
4.3.2 Limited availability of skilled healthcare professionals proficient in administering proteasome inhibitors and managing associated side effects. |
4.3.3 Regulatory challenges and approval processes for new proteasome inhibitors in the Guatemalan market. |
5 Guatemala Proteasome Inhibitors Market Trends |
6 Guatemala Proteasome Inhibitors Market, By Types |
6.1 Guatemala Proteasome Inhibitors Market, By Product |
6.1.1 Overview and Analysis |
6.1.2 Guatemala Proteasome Inhibitors Market Revenues & Volume, By Product, 2022 - 2032F |
6.1.3 Guatemala Proteasome Inhibitors Market Revenues & Volume, By Velcade, 2022 - 2032F |
6.1.4 Guatemala Proteasome Inhibitors Market Revenues & Volume, By Kyprolis, 2022 - 2032F |
6.1.5 Guatemala Proteasome Inhibitors Market Revenues & Volume, By Ninlaro, 2022 - 2032F |
6.2 Guatemala Proteasome Inhibitors Market, By Drugs |
6.2.1 Overview and Analysis |
6.2.2 Guatemala Proteasome Inhibitors Market Revenues & Volume, By Bortezomib, 2022 - 2032F |
6.2.3 Guatemala Proteasome Inhibitors Market Revenues & Volume, By Carfilzomib, 2022 - 2032F |
6.2.4 Guatemala Proteasome Inhibitors Market Revenues & Volume, By Ixazomib, 2022 - 2032F |
6.3 Guatemala Proteasome Inhibitors Market, By Indication |
6.3.1 Overview and Analysis |
6.3.2 Guatemala Proteasome Inhibitors Market Revenues & Volume, By Lymphoma, 2022 - 2032F |
6.3.3 Guatemala Proteasome Inhibitors Market Revenues & Volume, By Mantle Cell Lymphoma, 2022 - 2032F |
6.3.4 Guatemala Proteasome Inhibitors Market Revenues & Volume, By Multiple Myeloma, 2022 - 2032F |
6.4 Guatemala Proteasome Inhibitors Market, By Distribution Channel |
6.4.1 Overview and Analysis |
6.4.2 Guatemala Proteasome Inhibitors Market Revenues & Volume, By Hospital Pharmacy, 2022 - 2032F |
6.4.3 Guatemala Proteasome Inhibitors Market Revenues & Volume, By Online Pharmacy, 2022 - 2032F |
6.4.4 Guatemala Proteasome Inhibitors Market Revenues & Volume, By Retail Pharmacy, 2022 - 2032F |
6.5 Guatemala Proteasome Inhibitors Market, By End-Users |
6.5.1 Overview and Analysis |
6.5.2 Guatemala Proteasome Inhibitors Market Revenues & Volume, By Hospitals, 2022 - 2032F |
6.5.3 Guatemala Proteasome Inhibitors Market Revenues & Volume, By Specialty Clinics, 2022 - 2032F |
7 Guatemala Proteasome Inhibitors Market Import-Export Trade Statistics |
7.1 Guatemala Proteasome Inhibitors Market Export to Major Countries |
7.2 Guatemala Proteasome Inhibitors Market Imports from Major Countries |
8 Guatemala Proteasome Inhibitors Market Key Performance Indicators |
8.1 Number of clinical trials or research studies conducted on proteasome inhibitors in Guatemala. |
8.2 Patient adherence rates to proteasome inhibitor treatment regimens. |
8.3 Rate of adoption of new proteasome inhibitors in clinical practice in Guatemala. |
8.4 Average time taken for regulatory approval of proteasome inhibitors in the Guatemalan market. |
9 Guatemala Proteasome Inhibitors Market - Opportunity Assessment |
9.1 Guatemala Proteasome Inhibitors Market Opportunity Assessment, By Product, 2022 & 2032F |
9.2 Guatemala Proteasome Inhibitors Market Opportunity Assessment, By Drugs, 2022 & 2032F |
9.3 Guatemala Proteasome Inhibitors Market Opportunity Assessment, By Indication, 2022 & 2032F |
9.4 Guatemala Proteasome Inhibitors Market Opportunity Assessment, By Distribution Channel, 2022 & 2032F |
9.5 Guatemala Proteasome Inhibitors Market Opportunity Assessment, By End-Users, 2022 & 2032F |
10 Guatemala Proteasome Inhibitors Market - Competitive Landscape |
10.1 Guatemala Proteasome Inhibitors Market Revenue Share, By Companies, 2025 |
10.2 Guatemala Proteasome Inhibitors Market Competitive Benchmarking, By Operating and Technical Parameters |
11 Company Profiles |
12 Recommendations |
13 Disclaimer |
Export potential assessment - trade Analytics for 2030
Export potential enables firms to identify high-growth global markets with greater confidence by combining advanced trade intelligence with a structured quantitative methodology. The framework analyzes emerging demand trends and country-level import patterns while integrating macroeconomic and trade datasets such as GDP and population forecasts, bilateral import–export flows, tariff structures, elasticity differentials between developed and developing economies, geographic distance, and import demand projections. Using weighted trade values from 2020–2024 as the base period to project country-to-country export potential for 2030, these inputs are operationalized through calculated drivers such as gravity model parameters, tariff impact factors, and projected GDP per-capita growth. Through an analysis of hidden potentials, demand hotspots, and market conditions that are most favorable to success, this method enables firms to focus on target countries, maximize returns, and global expansion with data, backed by accuracy.
By factoring in the projected importer demand gap that is currently unmet and could be potential opportunity, it identifies the potential for the Exporter (Country) among 190 countries, against the general trade analysis, which identifies the biggest importer or exporter.
To discover high-growth global markets and optimize your business strategy:
Click Here
Pricing
- Single User License$ 1,995
- Department License$ 2,400
- Site License$ 3,120
- Global License$ 3,795

Search
Thought Leadership and Analyst Meet


Our Clients
Latest Reports
- India Ultrasonic Smart Water Meter Market (2026-2032) | Outlook, Competition, Drivers, Trends, Demand, Competitive, Strategic Insights, Companies, Challenges, Strategy, Consumer Insights, Analysis, Opportunities, Growth, Size, Share, Industry, Revenue, Segments, Value, Segmentation, Supply, Forecast, Restraints,
- India Electromagnetic Bulk Flow Meter Market (2026-2032) | Analysis, Challenges, Strategic Insights, Supply, Forecast, Growth, Share, Consumer Insights, Competitive, Value, Outlook, Size & Demand,
- India Battery Powered Bulk Flow Meter Market (2026-2032) | Outlook, Analysis, Competitive Landscape, Growth, Size, Trends, Value, Revenue, Companies, Segmentation, Share & Forecast
- Bosnia and Herzegovina Fuel-Efficient Winglets Market (2026-2032) | Growth, Competition, Strategy, Restraints, Trends, Challenges, segmentation, Value, Outlook, Investment Opportunities, Analysis, Revenue, Companies, Insights, Pricing, Size, Drivers, Demand, Share, Forecast
- Canada Cloud CFD Market (2026-2032) | Size & Revenue, Industry, Growth, Competitive Landscape, Forecast, Segmentation, Value, Outlook, Trends, Share, Analysis, Companies
- Taiwan Food Delivery Platform Market (2026-2032) | Companies, Outlook, Analysis, Trends, Value, Revenue, Segmentation, Share, Forecast, Competitive Landscape, Growth, Size & Forecast
- United Kingdom (UK) Long-term Care Insurance Market (2026-2032) | Growth, Share, Consumer Insights, Drivers, Opportunities, Competition, Pricing Analysis, Segments, Restraints, Companies, Competitive, Value, Outlook, Size, Demand, Analysis, Challenges, Strategic Insights, Investment Trends, Revenue, Trends, Supply, Forecast
- United Kingdom (UK) Long Term Care Market (2026-2032) | Companies, Outlook, Analysis, Trends, Value, Revenue, Segmentation, Share, Forecast, Competitive Landscape, Growth, Size & Forecast
- Iraq Insulation and Waterproofing Market (2026-2032) | Outlook, Drivers, Growth, Size, Share, Industry, Revenue, Trends, Demand, Competitive, Strategic Insights, Opportunities, Segments, Companies, Challenges, Strategy, Consumer Insights, Analysis, Investment Trends, Value, Segmentation, Forecast, Restraints
- India Switchgear Market Outlook (2026-2032) | Size, Share, Trends, Growth, Revenue, Forecast, Analysis, Value, Outlook
Industry Events and Analyst Meet

India EV Show 2026

EV tech India Expo 2026

Auto Tech Asia 2026

Battery Tech India 2026

Smart Production Solutions Guangzhou 2026
Whitepaper
- Middle East & Africa Commercial Security Market Click here to view more.
- Middle East & Africa Fire Safety Systems & Equipment Market Click here to view more.
- GCC Drone Market Click here to view more.
- Middle East Lighting Fixture Market Click here to view more.
- GCC Physical & Perimeter Security Market Click here to view more.
6WResearch In News
- Doha a strategic location for EV manufacturing hub: IPA Qatar
- Demand for luxury TVs surging in the GCC, says Samsung
- Empowering Growth: The Thriving Journey of Bangladesh’s Cable Industry
- Demand for luxury TVs surging in the GCC, says Samsung
- Video call with a traditional healer? Once unthinkable, it’s now common in South Africa
- Intelligent Buildings To Smooth GCC’s Path To Net Zero