Guatemala Ultrathin Glass Market (2026-2032) | Segmentation, Competition, Growth, Drivers, Restraints, Size, Challenges, Investment Trends, Industry, Outlook, Pricing Analysis, Strategic Insights, Trends, Segments, Companies, Competitive, Consumer Insights, Forecast, Strategy, Value, Revenue, Analysis, Supply, Share, Demand, Opportunities
Market Forecast By Type (Below 0.1mm, 0.1mm - 0.5mm, 0.5mm - 1mm, Flexible Glass), By Manufacturing Process (Float Process, Fusion Process, Down-Draw Process, Roll-to-Roll), By Application (Display Panels, Touch Sensors, Automotive Glass, Solar Panels), By End User (Consumer Electronics, Semiconductor, Automotive, Renewable Energy), By End Use (Professional Tattooing, Tattoo Studios) And Competitive Landscape
| Product Code: ETC11237735 | Publication Date: Apr 2025 | Updated Date: Apr 2026 | Product Type: Market Research Report | |
| Publisher: 6Wresearch | Author: Bhawna Singh | No. of Pages: 65 | No. of Figures: 34 | No. of Tables: 19 |
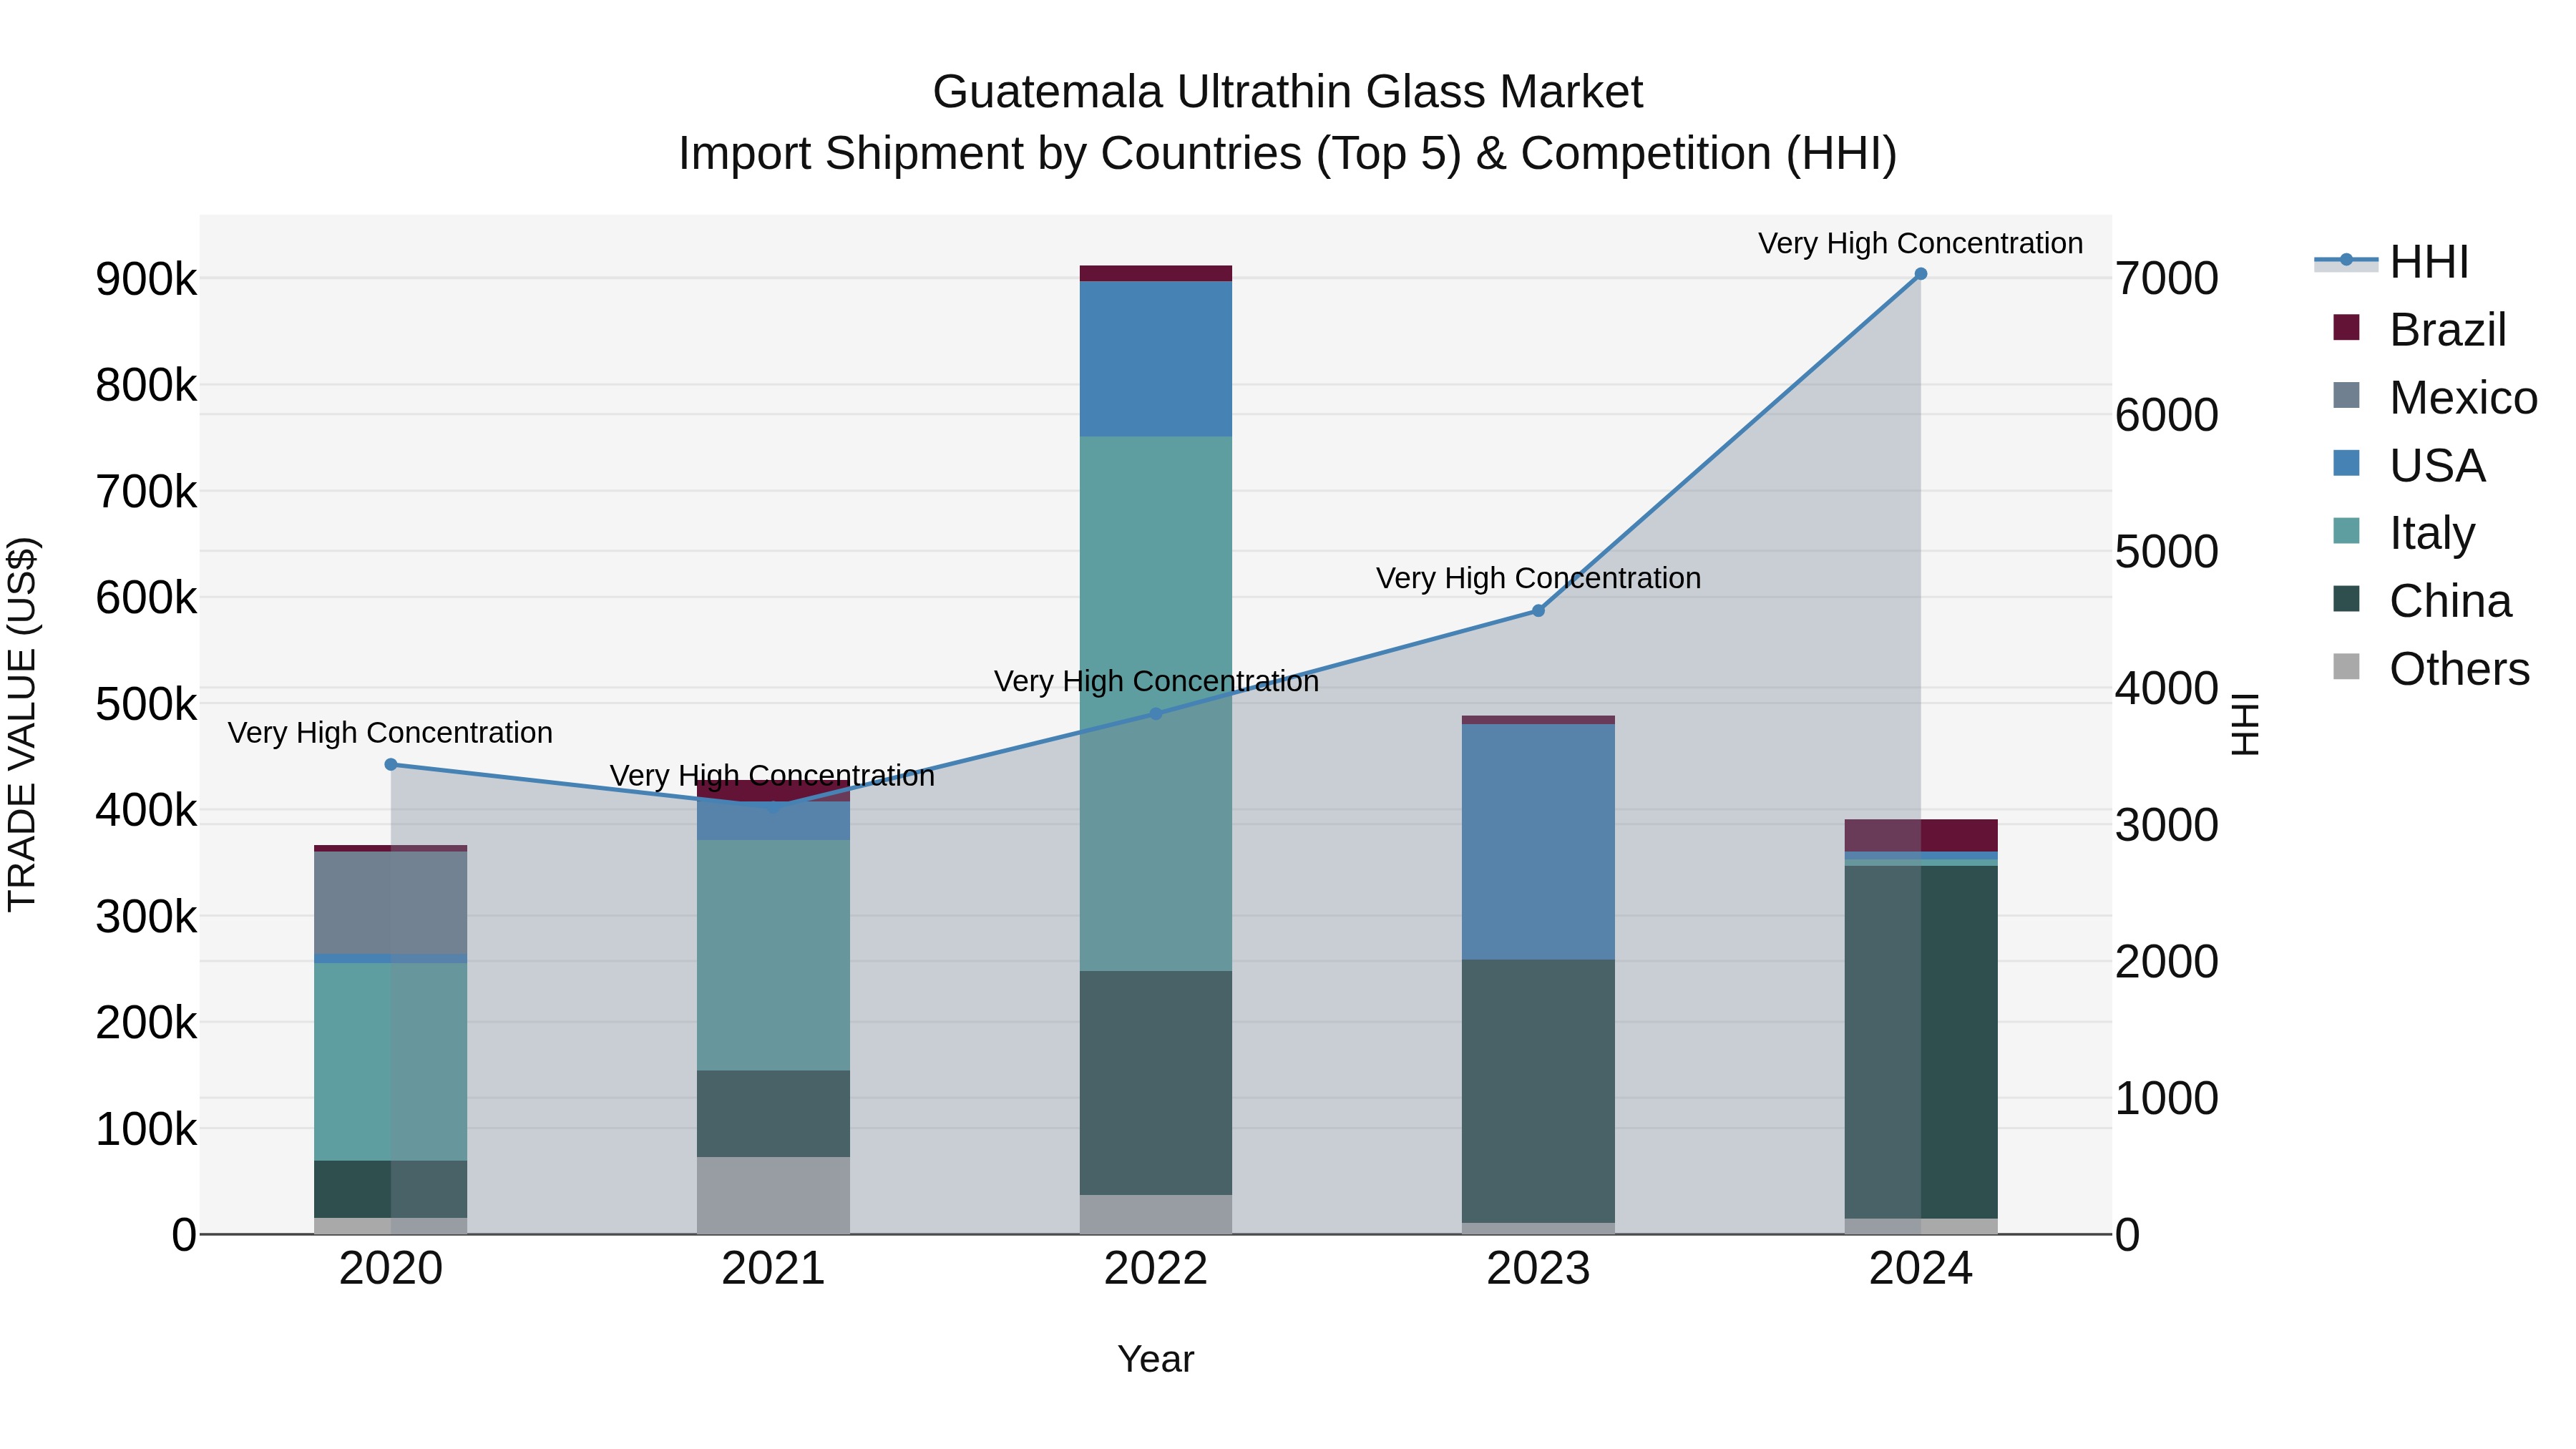
Guatemala Ultrathin Glass Market Top 5 Importing Countries and Market Competition (HHI) Analysis
Despite a negative growth rate in 2024, Guatemala saw consistent import shipments of ultrathin glass with a 1.63% CAGR from 2020-24. The top exporting countries included China, Brazil, El Salvador, USA, and Italy, indicating a diverse market source. However, the high Herfindahl-Hirschman Index (HHI) concentration suggests a competitive landscape dominated by a few key players. Monitoring market dynamics and exploring strategies to enhance competitiveness will be crucial for stakeholders in the Guatemalan ultrathin glass import market.
Key Highlights of the Report:
- Guatemala Ultrathin Glass Market Outlook
- Market Size of Guatemala Ultrathin Glass Market, 2025
- Forecast of Guatemala Ultrathin Glass Market, 2032
- Historical Data and Forecast of Guatemala Ultrathin Glass Revenues & Volume for the Period 2022 - 2032F
- Guatemala Ultrathin Glass Market Trend Evolution
- Guatemala Ultrathin Glass Market Drivers and Challenges
- Guatemala Ultrathin Glass Price Trends
- Guatemala Ultrathin Glass Porter's Five Forces
- Guatemala Ultrathin Glass Industry Life Cycle
- Historical Data and Forecast of Guatemala Ultrathin Glass Market Revenues & Volume By Type for the Period 2022 - 2032F
- Historical Data and Forecast of Guatemala Ultrathin Glass Market Revenues & Volume By Below 0.1mm for the Period 2022 - 2032F
- Historical Data and Forecast of Guatemala Ultrathin Glass Market Revenues & Volume By 0.1mm - 0.5mm for the Period 2022 - 2032F
- Historical Data and Forecast of Guatemala Ultrathin Glass Market Revenues & Volume By 0.5mm - 1mm for the Period 2022 - 2032F
- Historical Data and Forecast of Guatemala Ultrathin Glass Market Revenues & Volume By Flexible Glass for the Period 2022 - 2032F
- Historical Data and Forecast of Guatemala Ultrathin Glass Market Revenues & Volume By Manufacturing Process for the Period 2022 - 2032F
- Historical Data and Forecast of Guatemala Ultrathin Glass Market Revenues & Volume By Float Process for the Period 2022 - 2032F
- Historical Data and Forecast of Guatemala Ultrathin Glass Market Revenues & Volume By Fusion Process for the Period 2022 - 2032F
- Historical Data and Forecast of Guatemala Ultrathin Glass Market Revenues & Volume By Down-Draw Process for the Period 2022 - 2032F
- Historical Data and Forecast of Guatemala Ultrathin Glass Market Revenues & Volume By Roll-to-Roll for the Period 2022 - 2032F
- Historical Data and Forecast of Guatemala Ultrathin Glass Market Revenues & Volume By Application for the Period 2022 - 2032F
- Historical Data and Forecast of Guatemala Ultrathin Glass Market Revenues & Volume By Display Panels for the Period 2022 - 2032F
- Historical Data and Forecast of Guatemala Ultrathin Glass Market Revenues & Volume By Touch Sensors for the Period 2022 - 2032F
- Historical Data and Forecast of Guatemala Ultrathin Glass Market Revenues & Volume By Automotive Glass for the Period 2022 - 2032F
- Historical Data and Forecast of Guatemala Ultrathin Glass Market Revenues & Volume By Solar Panels for the Period 2022 - 2032F
- Historical Data and Forecast of Guatemala Ultrathin Glass Market Revenues & Volume By End User for the Period 2022 - 2032F
- Historical Data and Forecast of Guatemala Ultrathin Glass Market Revenues & Volume By Consumer Electronics for the Period 2022 - 2032F
- Historical Data and Forecast of Guatemala Ultrathin Glass Market Revenues & Volume By Semiconductor for the Period 2022 - 2032F
- Historical Data and Forecast of Guatemala Ultrathin Glass Market Revenues & Volume By Automotive for the Period 2022 - 2032F
- Historical Data and Forecast of Guatemala Ultrathin Glass Market Revenues & Volume By Renewable Energy for the Period 2022 - 2032F
- Historical Data and Forecast of Guatemala Ultrathin Glass Market Revenues & Volume By End Use for the Period 2022 - 2032F
- Historical Data and Forecast of Guatemala Ultrathin Glass Market Revenues & Volume By Professional Tattooing for the Period 2022 - 2032F
- Historical Data and Forecast of Guatemala Ultrathin Glass Market Revenues & Volume By Tattoo Studios for the Period 2022 - 2032F
- Guatemala Ultrathin Glass Import Export Trade Statistics
- Market Opportunity Assessment By Type
- Market Opportunity Assessment By Manufacturing Process
- Market Opportunity Assessment By Application
- Market Opportunity Assessment By End User
- Market Opportunity Assessment By End Use
- Guatemala Ultrathin Glass Top Companies Market Share
- Guatemala Ultrathin Glass Competitive Benchmarking By Technical and Operational Parameters
- Guatemala Ultrathin Glass Company Profiles
- Guatemala Ultrathin Glass Key Strategic Recommendations
Frequently Asked Questions About the Market Study (FAQs):
6Wresearch actively monitors the Guatemala Ultrathin Glass Market and publishes its comprehensive annual report, highlighting emerging trends, growth drivers, revenue analysis, and forecast outlook. Our insights help businesses to make data-backed strategic decisions with ongoing market dynamics. Our analysts track relevent industries related to the Guatemala Ultrathin Glass Market, allowing our clients with actionable intelligence and reliable forecasts tailored to emerging regional needs.
Yes, we provide customisation as per your requirements. To learn more, feel free to contact us on sales@6wresearch.com
1 Executive Summary |
2 Introduction |
2.1 Key Highlights of the Report |
2.2 Report Description |
2.3 Market Scope & Segmentation |
2.4 Research Methodology |
2.5 Assumptions |
3 Guatemala Ultrathin Glass Market Overview |
3.1 Guatemala Country Macro Economic Indicators |
3.2 Guatemala Ultrathin Glass Market Revenues & Volume, 2022 & 2032F |
3.3 Guatemala Ultrathin Glass Market - Industry Life Cycle |
3.4 Guatemala Ultrathin Glass Market - Porter's Five Forces |
3.5 Guatemala Ultrathin Glass Market Revenues & Volume Share, By Type, 2022 & 2032F |
3.6 Guatemala Ultrathin Glass Market Revenues & Volume Share, By Manufacturing Process, 2022 & 2032F |
3.7 Guatemala Ultrathin Glass Market Revenues & Volume Share, By Application, 2022 & 2032F |
3.8 Guatemala Ultrathin Glass Market Revenues & Volume Share, By End User, 2022 & 2032F |
4 Guatemala Ultrathin Glass Market Dynamics |
4.1 Impact Analysis |
4.2 Market Drivers |
4.2.1 Growing demand for lightweight and durable electronic devices, such as smartphones and tablets, which require ultrathin glass for displays. |
4.2.2 Increasing adoption of advanced display technologies, like OLED and flexible displays, that rely on ultrathin glass for improved performance. |
4.2.3 Rising investments in the automotive sector, where ultrathin glass is used for heads-up displays and advanced driver assistance systems. |
4.3 Market Restraints |
4.3.1 High production costs associated with manufacturing ultrathin glass, limiting its affordability for some consumers. |
4.3.2 Limited availability of skilled labor and technical expertise required for producing high-quality ultrathin glass. |
4.3.3 Environmental concerns related to the production processes of ultrathin glass, leading to regulatory challenges and sustainability issues. |
5 Guatemala Ultrathin Glass Market Trends |
6 Guatemala Ultrathin Glass Market, By Types |
6.1 Guatemala Ultrathin Glass Market, By Type |
6.1.1 Overview and Analysis |
6.1.2 Guatemala Ultrathin Glass Market Revenues & Volume, By Type, 2022 - 2032F |
6.1.3 Guatemala Ultrathin Glass Market Revenues & Volume, By Below 0.1mm, 2022 - 2032F |
6.1.4 Guatemala Ultrathin Glass Market Revenues & Volume, By 0.1mm - 0.5mm, 2022 - 2032F |
6.1.5 Guatemala Ultrathin Glass Market Revenues & Volume, By 0.5mm - 1mm, 2022 - 2032F |
6.1.6 Guatemala Ultrathin Glass Market Revenues & Volume, By Flexible Glass, 2022 - 2032F |
6.2 Guatemala Ultrathin Glass Market, By Manufacturing Process |
6.2.1 Overview and Analysis |
6.2.2 Guatemala Ultrathin Glass Market Revenues & Volume, By Float Process, 2022 - 2032F |
6.2.3 Guatemala Ultrathin Glass Market Revenues & Volume, By Fusion Process, 2022 - 2032F |
6.2.4 Guatemala Ultrathin Glass Market Revenues & Volume, By Down-Draw Process, 2022 - 2032F |
6.2.5 Guatemala Ultrathin Glass Market Revenues & Volume, By Roll-to-Roll, 2022 - 2032F |
6.3 Guatemala Ultrathin Glass Market, By Application |
6.3.1 Overview and Analysis |
6.3.2 Guatemala Ultrathin Glass Market Revenues & Volume, By Display Panels, 2022 - 2032F |
6.3.3 Guatemala Ultrathin Glass Market Revenues & Volume, By Touch Sensors, 2022 - 2032F |
6.3.4 Guatemala Ultrathin Glass Market Revenues & Volume, By Automotive Glass, 2022 - 2032F |
6.3.5 Guatemala Ultrathin Glass Market Revenues & Volume, By Solar Panels, 2022 - 2032F |
6.4 Guatemala Ultrathin Glass Market, By End User |
6.4.1 Overview and Analysis |
6.4.2 Guatemala Ultrathin Glass Market Revenues & Volume, By Consumer Electronics, 2022 - 2032F |
6.4.3 Guatemala Ultrathin Glass Market Revenues & Volume, By Semiconductor, 2022 - 2032F |
6.4.4 Guatemala Ultrathin Glass Market Revenues & Volume, By Automotive, 2022 - 2032F |
6.4.5 Guatemala Ultrathin Glass Market Revenues & Volume, By Renewable Energy, 2022 - 2032F |
7 Guatemala Ultrathin Glass Market Import-Export Trade Statistics |
7.1 Guatemala Ultrathin Glass Market Export to Major Countries |
7.2 Guatemala Ultrathin Glass Market Imports from Major Countries |
8 Guatemala Ultrathin Glass Market Key Performance Indicators |
8.1 Average selling price (ASP) of ultrathin glass products in the Guatemala market. |
8.2 Number of research and development (RD) initiatives focused on enhancing ultrathin glass technologies. |
8.3 Percentage of manufacturers in Guatemala investing in automation and digitalization of production processes for ultrathin glass. |
9 Guatemala Ultrathin Glass Market - Opportunity Assessment |
9.1 Guatemala Ultrathin Glass Market Opportunity Assessment, By Type, 2022 & 2032F |
9.2 Guatemala Ultrathin Glass Market Opportunity Assessment, By Manufacturing Process, 2022 & 2032F |
9.3 Guatemala Ultrathin Glass Market Opportunity Assessment, By Application, 2022 & 2032F |
9.4 Guatemala Ultrathin Glass Market Opportunity Assessment, By End User, 2022 & 2032F |
10 Guatemala Ultrathin Glass Market - Competitive Landscape |
10.1 Guatemala Ultrathin Glass Market Revenue Share, By Companies, 2025 |
10.2 Guatemala Ultrathin Glass Market Competitive Benchmarking, By Operating and Technical Parameters |
11 Company Profiles |
12 Recommendations |
13 Disclaimer |
Export potential assessment - trade Analytics for 2030
Export potential enables firms to identify high-growth global markets with greater confidence by combining advanced trade intelligence with a structured quantitative methodology. The framework analyzes emerging demand trends and country-level import patterns while integrating macroeconomic and trade datasets such as GDP and population forecasts, bilateral import–export flows, tariff structures, elasticity differentials between developed and developing economies, geographic distance, and import demand projections. Using weighted trade values from 2020–2024 as the base period to project country-to-country export potential for 2030, these inputs are operationalized through calculated drivers such as gravity model parameters, tariff impact factors, and projected GDP per-capita growth. Through an analysis of hidden potentials, demand hotspots, and market conditions that are most favorable to success, this method enables firms to focus on target countries, maximize returns, and global expansion with data, backed by accuracy.
By factoring in the projected importer demand gap that is currently unmet and could be potential opportunity, it identifies the potential for the Exporter (Country) among 190 countries, against the general trade analysis, which identifies the biggest importer or exporter.
To discover high-growth global markets and optimize your business strategy:
Click Here
Pricing
- Single User License$ 1,995
- Department License$ 2,400
- Site License$ 3,120
- Global License$ 3,795

Search
Thought Leadership and Analyst Meet


Our Clients
Latest Reports
- Syria Air Conditioner Market (2026-2032) | Outlook, Competition, Drivers, Trends, Demand, Competitive, Strategic Insights, Companies, Challenges, Strategy, Consumer Insights, Analysis, Opportunities, Growth, Size, Share, Industry, Revenue, Segments, Value, Segmentation, Supply, Forecast, Restraints,
- Philippines Polyhydroxybutyrate-co-Hydroxyvalerate Market (2026-2032) | Trends, Insights, Challenges, Restraints, Competition, Size, Value, Forecast, Pricing, Share, Outlook, Revenue, Investment Opportunities, Strategy, Drivers, Demand, Growth, segmentation, Analysis, Companies
- Peru Polyhydroxybutyrate-co-Hydroxyvalerate Market (2026-2032) | Growth, Demand, Challenges, Share, Trends, Analysis, Pricing, Investment Opportunities, Drivers, Value, Forecast, Competition, Size, Companies, Insights, Outlook, Restraints, segmentation, Revenue, Strategy
- Pakistan Polyhydroxybutyrate-co-Hydroxyvalerate Market (2026-2032) | Restraints, segmentation, Pricing, Forecast, Share, Strategy, Competition, Trends, Insights, Drivers, Challenges, Growth, Revenue, Outlook, Value, Investment Opportunities, Companies, Size, Analysis, Demand
- Oman Polyhydroxybutyrate-co-Hydroxyvalerate Market (2026-2032) | Drivers, segmentation, Insights, Competition, Pricing, Outlook, Size, Revenue, Challenges, Forecast, Analysis, Growth, Value, Share, Trends, Investment Opportunities, Strategy, Restraints, Companies, Demand
- Nigeria Polyhydroxybutyrate-co-Hydroxyvalerate Market (2026-2032) | Value, Investment Opportunities, Analysis, Revenue, Restraints, Pricing, Outlook, Competition, Demand, Growth, Forecast, Companies, Trends, Challenges, segmentation, Drivers, Insights, Share, Size, Strategy
- Nepal Polyhydroxybutyrate-co-Hydroxyvalerate Market (2026-2032) | Insights, Analysis, Drivers, Share, Revenue, Demand, segmentation, Investment Opportunities, Competition, Forecast, Growth, Pricing, Companies, Strategy, Trends, Restraints, Challenges, Outlook, Size, Value
- Myanmar Polyhydroxybutyrate-co-Hydroxyvalerate Market (2026-2032) | Outlook, Revenue, Strategy, Restraints, Drivers, segmentation, Share, Forecast, Competition, Insights, Growth, Pricing, Size, Demand, Value, Companies, Trends, Challenges, Investment Opportunities, Analysis
- Morocco Polyhydroxybutyrate-co-Hydroxyvalerate Market (2026-2032) | Outlook, Investment Opportunities, Restraints, Strategy, Forecast, Challenges, Drivers, Growth, Companies, segmentation, Trends, Size, Competition, Revenue, Demand, Insights, Share, Analysis, Value, Pricing
- Mexico Polyhydroxybutyrate-co-Hydroxyvalerate Market (2026-2032) | Size, Drivers, Outlook, Share, Strategy, Growth, Pricing, Challenges, Companies, Demand, Value, Investment Opportunities, Restraints, Trends, Forecast, segmentation, Analysis, Insights, Competition, Revenue
Industry Events and Analyst Meet

HIMTEX 2026

India Refining Summit 2026

India EV Show 2026

EV tech India Expo 2026

Auto Tech Asia 2026
Whitepaper
- Middle East & Africa Commercial Security Market Click here to view more.
- Middle East & Africa Fire Safety Systems & Equipment Market Click here to view more.
- GCC Drone Market Click here to view more.
- Middle East Lighting Fixture Market Click here to view more.
- GCC Physical & Perimeter Security Market Click here to view more.
6WResearch In News
- Doha a strategic location for EV manufacturing hub: IPA Qatar
- Demand for luxury TVs surging in the GCC, says Samsung
- Empowering Growth: The Thriving Journey of Bangladesh’s Cable Industry
- Demand for luxury TVs surging in the GCC, says Samsung
- Video call with a traditional healer? Once unthinkable, it’s now common in South Africa
- Intelligent Buildings To Smooth GCC’s Path To Net Zero