Guyana N-propanol Market (2025-2031) | Outlook, Size, Growth, Analysis, Companies, Revenue, Trends, Forecast, Share, Segmentation, Industry & Value
Market Forecast By Type (Ethylene Hydrogenation Method, Allyl Alcohol Hydrogenation Method, Other Compounds Byproduct Method), By Application (Coatings, Food Additive, Pharmaceutical, Cosmetics, Others) And Competitive Landscape
| Product Code: ETC5293308 | Publication Date: Nov 2023 | Updated Date: Nov 2025 | Product Type: Market Research Report | |
| Publisher: 6Wresearch | Author: Bhawna Singh | No. of Pages: 60 | No. of Figures: 30 | No. of Tables: 5 |
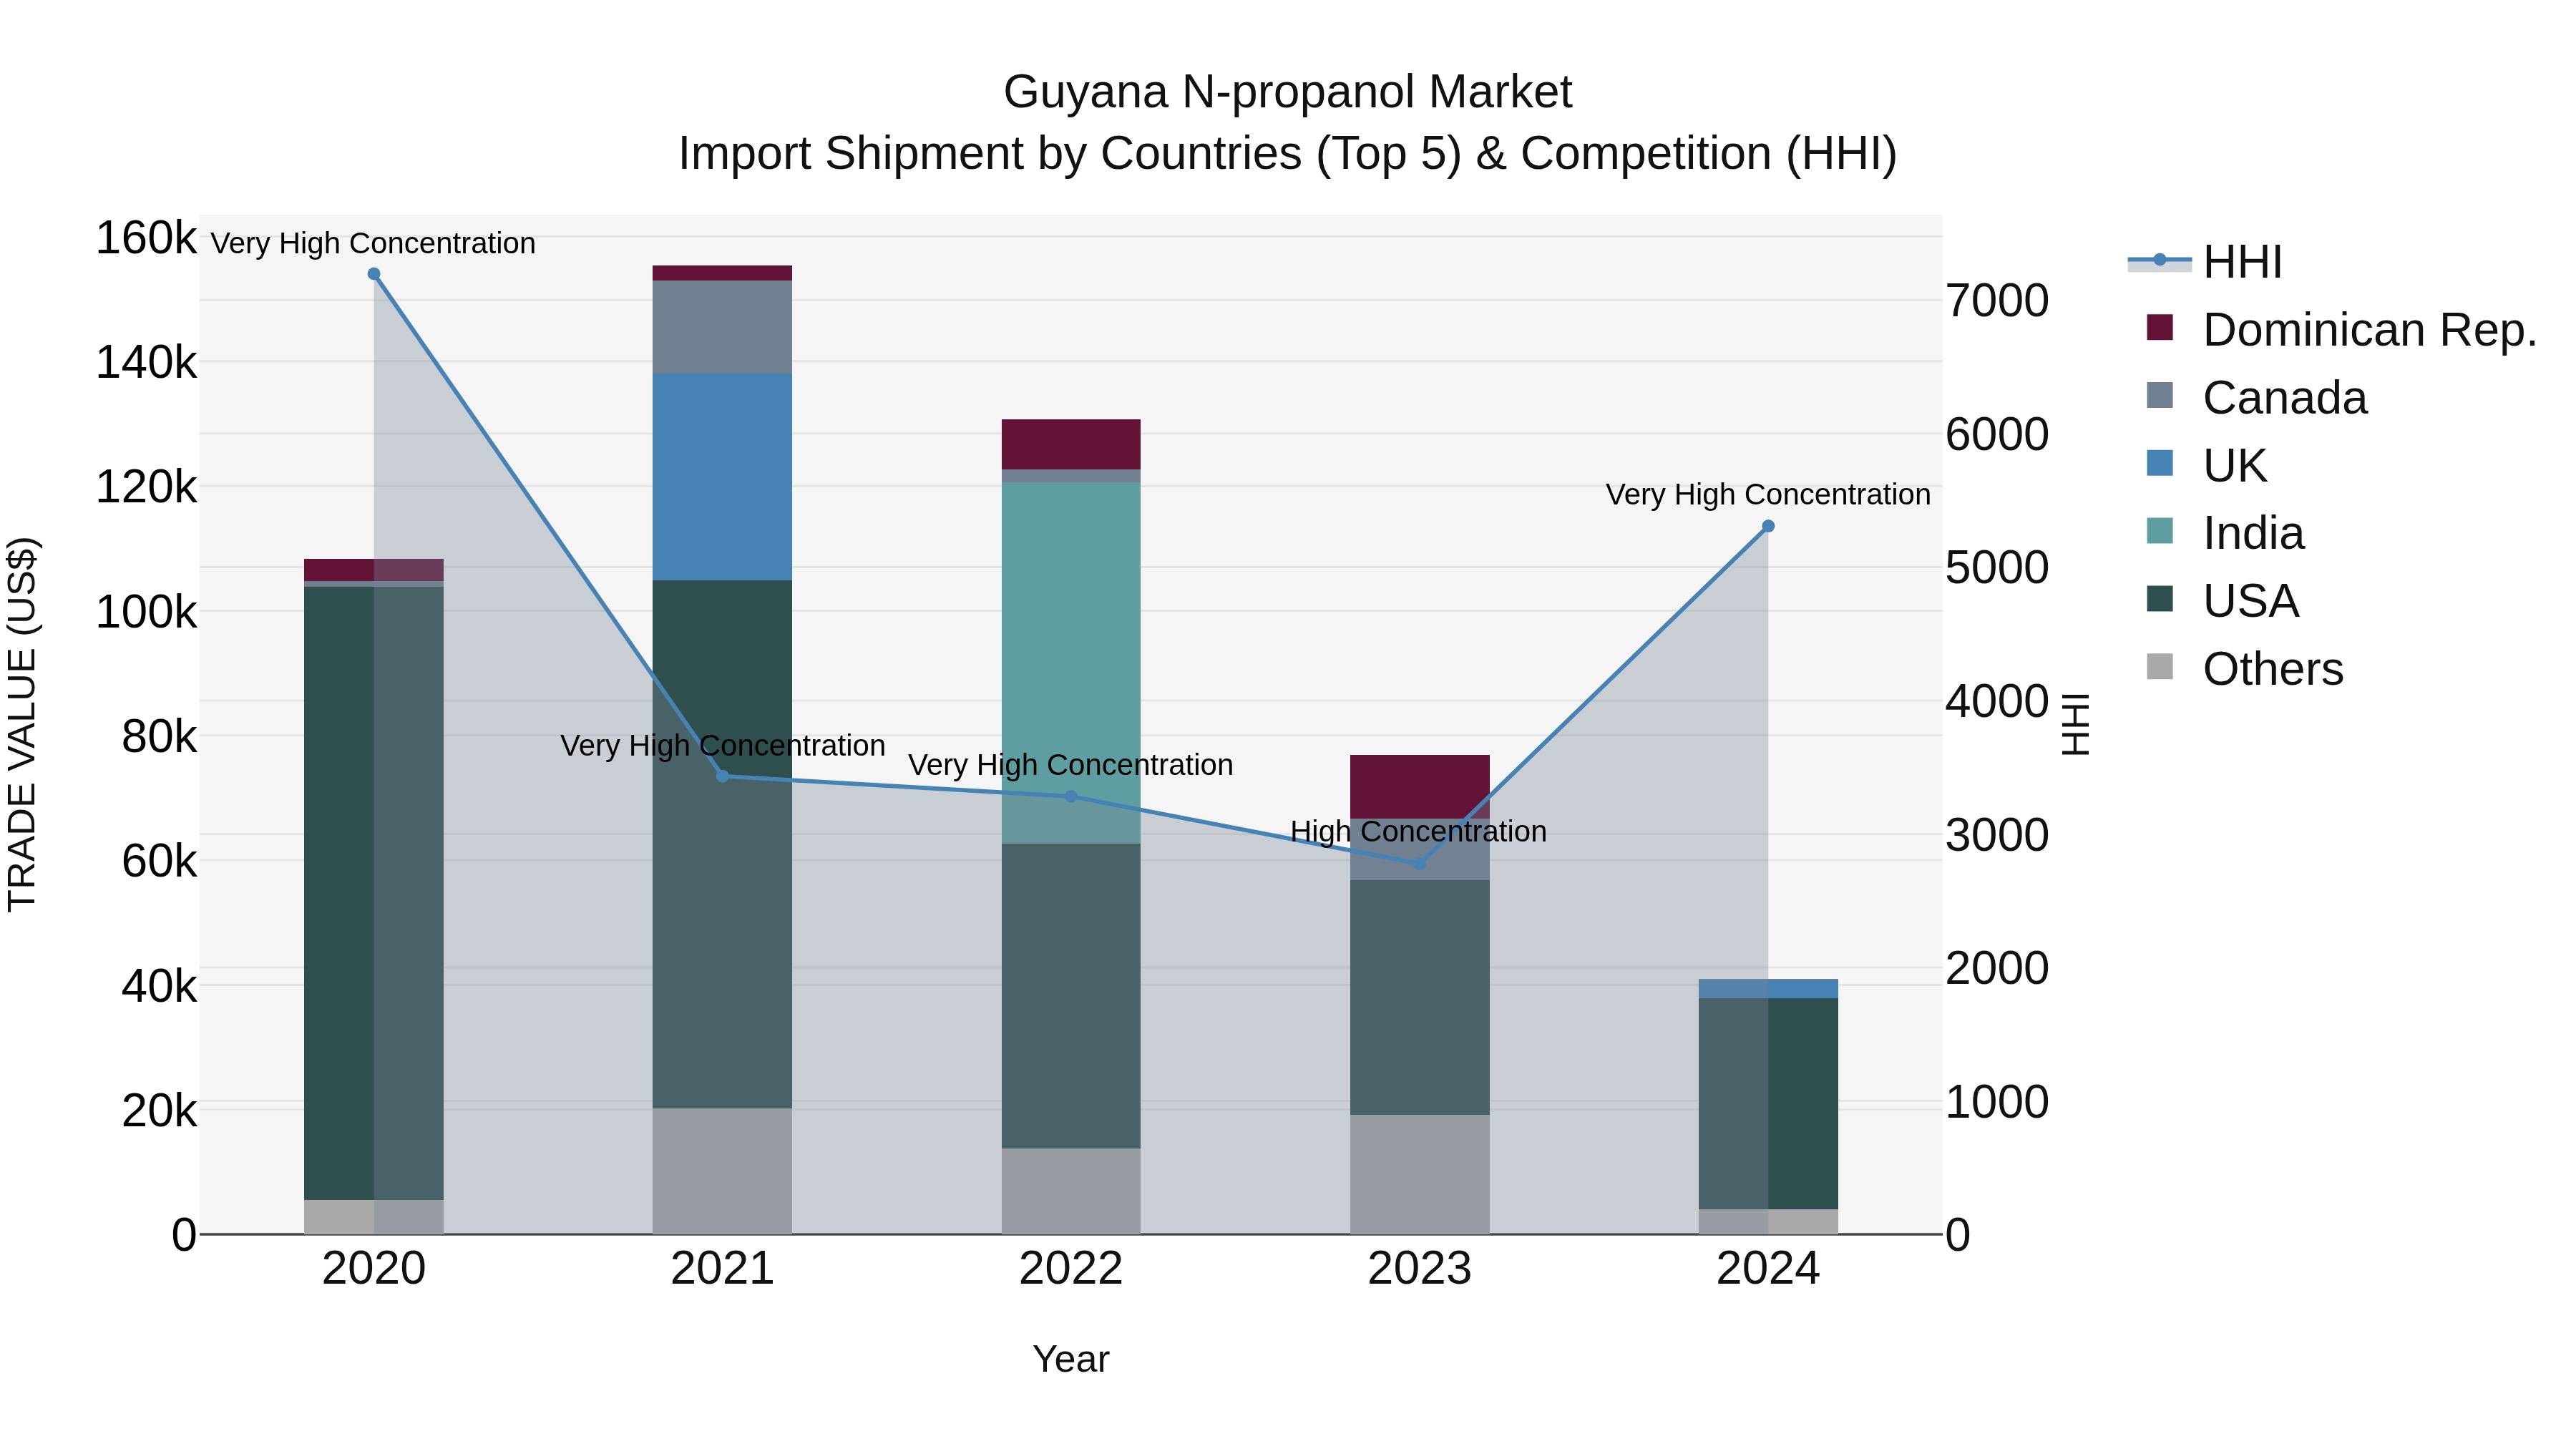
Guyana N-propanol Market Top 5 Importing Countries and Market Competition (HHI) Analysis
Guyana`s n-propanol import market saw a significant shift in 2024, with a notable increase in concentration among top exporting countries. The USA, Trinidad and Tobago, UK, Canada, and Germany emerged as key players in supplying n-propanol to Guyana. The market experienced a sharp decline in both CAGR and growth rate, indicating a challenging environment for importers. The heightened concentration levels suggest a potential impact on market dynamics and competitiveness. Stakeholders should closely monitor these trends and adapt their strategies to navigate the evolving market landscape effectively.
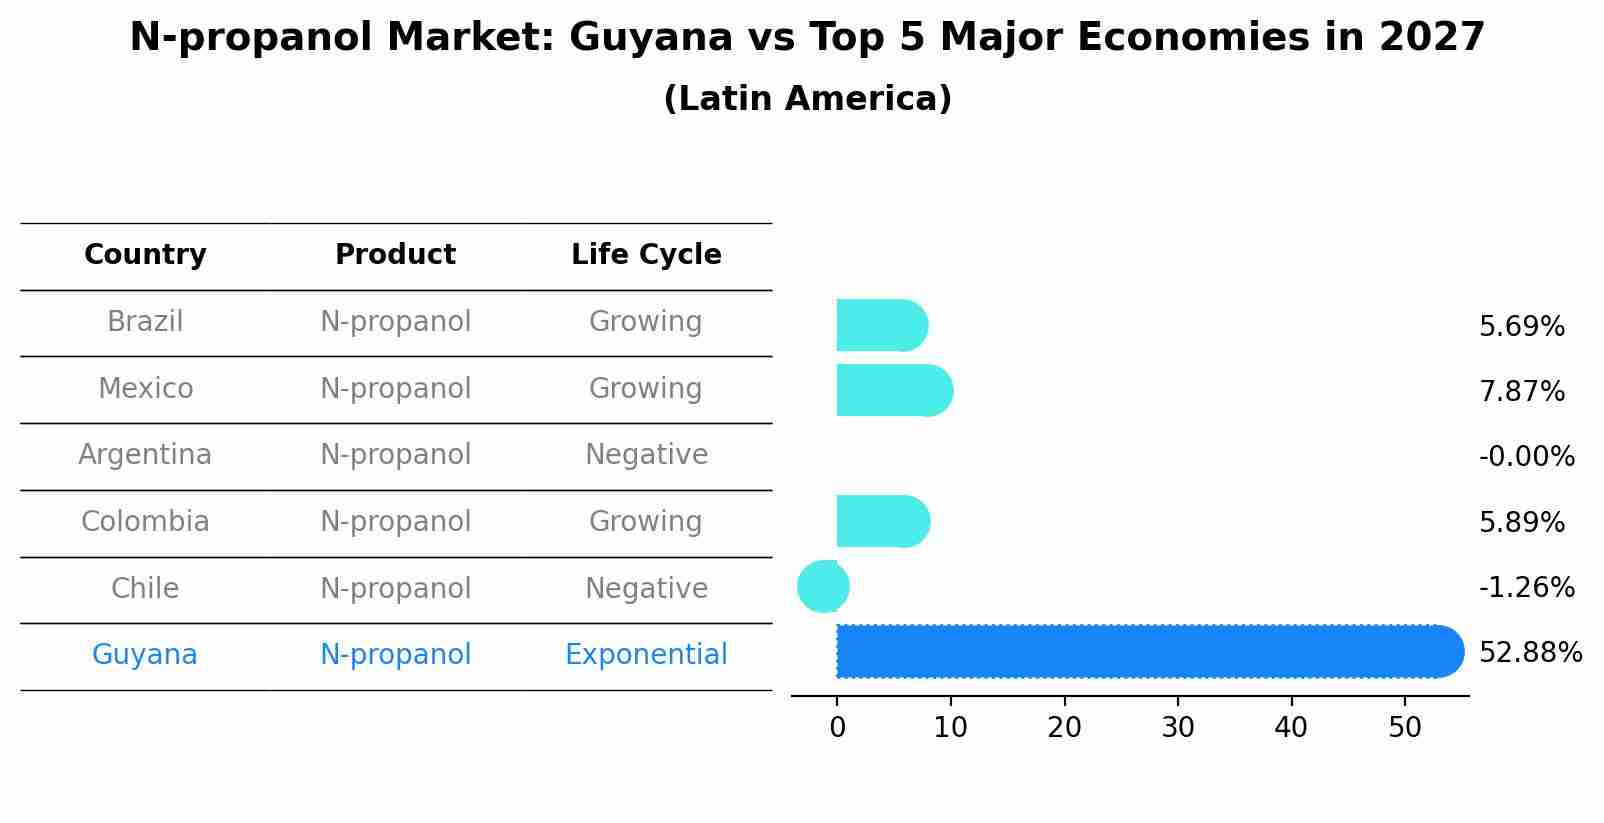
N-propanol Market: Guyana vs Top 5 Major Economies in 2027 (Latin America)
Guyana's N-propanol market is anticipated to experience a exponential growth rate of 52.88% by 2027, reflecting trends observed in the largest economy Brazil, followed by Mexico, Argentina, Colombia and Chile.
Guyana N-propanol Market Overview
The N-Propanol Market in Guyana supports industries like pharmaceuticals, cosmetics, and chemicals. This solvent is widely used in manufacturing processes, driven by demand from various industrial applications.
Drivers of the market
The n-propanol market in Guyana is driven by the increasing use of n-propanol as a solvent in various industrial applications, including paints, coatings, and cosmetics. N-propanol`s use in the pharmaceutical industry as a solvent for drugs also contributes to market demand. As industries expand, particularly in the chemical, automotive, and pharmaceutical sectors, the demand for n-propanol as a versatile solvent and intermediate chemical grows, further fueling market growth.
Challenges of the market
The N-propanol market in Guyana is constrained by limited industrial applications and a lack of local production facilities. High import costs and low awareness about the benefits of N-propanol also restrict market expansion.
Government Policy of the market
The government of Guyana is working to develop the n-propanol market, an important chemical used in industrial applications such as solvents, pharmaceuticals, and plastics. Policies support the local production and export of n-propanol, with a focus on attracting foreign investment and boosting the countrys chemical manufacturing sector. The government offers financial incentives to businesses that invest in n-propanol production and related infrastructure. Additionally, there are regulations aimed at ensuring that the production and use of n-propanol comply with environmental and safety standards, supporting the growth of a sustainable and competitive chemical industry.
Key Highlights of the Report:
- Guyana N-propanol Market Outlook
- Market Size of Guyana N-propanol Market, 2024
- Forecast of Guyana N-propanol Market, 2031
- Historical Data and Forecast of Guyana N-propanol Revenues & Volume for the Period 2021-2031
- Guyana N-propanol Market Trend Evolution
- Guyana N-propanol Market Drivers and Challenges
- Guyana N-propanol Price Trends
- Guyana N-propanol Porter`s Five Forces
- Guyana N-propanol Industry Life Cycle
- Historical Data and Forecast of Guyana N-propanol Market Revenues & Volume By Type for the Period 2021-2031
- Historical Data and Forecast of Guyana N-propanol Market Revenues & Volume By Ethylene Hydrogenation Method for the Period 2021-2031
- Historical Data and Forecast of Guyana N-propanol Market Revenues & Volume By Allyl Alcohol Hydrogenation Method for the Period 2021-2031
- Historical Data and Forecast of Guyana N-propanol Market Revenues & Volume By Other Compounds Byproduct Method for the Period 2021-2031
- Historical Data and Forecast of Guyana N-propanol Market Revenues & Volume By Application for the Period 2021-2031
- Historical Data and Forecast of Guyana N-propanol Market Revenues & Volume By Coatings for the Period 2021-2031
- Historical Data and Forecast of Guyana N-propanol Market Revenues & Volume By Food Additive for the Period 2021-2031
- Historical Data and Forecast of Guyana N-propanol Market Revenues & Volume By Pharmaceutical for the Period 2021-2031
- Historical Data and Forecast of Guyana N-propanol Market Revenues & Volume By Cosmetics for the Period 2021-2031
- Historical Data and Forecast of Guyana N-propanol Market Revenues & Volume By Others for the Period 2021-2031
- Guyana N-propanol Import Export Trade Statistics
- Market Opportunity Assessment By Type
- Market Opportunity Assessment By Application
- Guyana N-propanol Top Companies Market Share
- Guyana N-propanol Competitive Benchmarking By Technical and Operational Parameters
- Guyana N-propanol Company Profiles
- Guyana N-propanol Key Strategic Recommendations
Frequently Asked Questions About the Market Study (FAQs):
6Wresearch actively monitors the Guyana N-propanol Market and publishes its comprehensive annual report, highlighting emerging trends, growth drivers, revenue analysis, and forecast outlook. Our insights help businesses to make data-backed strategic decisions with ongoing market dynamics. Our analysts track relevent industries related to the Guyana N-propanol Market, allowing our clients with actionable intelligence and reliable forecasts tailored to emerging regional needs.
Yes, we provide customisation as per your requirements. To learn more, feel free to contact us on sales@6wresearch.com
1 Executive Summary |
2 Introduction |
2.1 Key Highlights of the Report |
2.2 Report Description |
2.3 Market Scope & Segmentation |
2.4 Research Methodology |
2.5 Assumptions |
3 Guyana N-propanol Market Overview |
3.1 Guyana Country Macro Economic Indicators |
3.2 Guyana N-propanol Market Revenues & Volume, 2021 & 2031F |
3.3 Guyana N-propanol Market - Industry Life Cycle |
3.4 Guyana N-propanol Market - Porter's Five Forces |
3.5 Guyana N-propanol Market Revenues & Volume Share, By Type, 2021 & 2031F |
3.6 Guyana N-propanol Market Revenues & Volume Share, By Application, 2021 & 2031F |
4 Guyana N-propanol Market Dynamics |
4.1 Impact Analysis |
4.2 Market Drivers |
4.2.1 Growing demand for n-propanol in the pharmaceutical industry |
4.2.2 Increasing use of n-propanol as a solvent in various industrial applications |
4.2.3 Expansion of the cosmetics and personal care industry in Guyana |
4.3 Market Restraints |
4.3.1 Fluctuating prices of raw materials used in the production of n-propanol |
4.3.2 Stringent regulations regarding environmental impact and safety concerns associated with n-propanol usage |
5 Guyana N-propanol Market Trends |
6 Guyana N-propanol Market Segmentations |
6.1 Guyana N-propanol Market, By Type |
6.1.1 Overview and Analysis |
6.1.2 Guyana N-propanol Market Revenues & Volume, By Ethylene Hydrogenation Method, 2021-2031F |
6.1.3 Guyana N-propanol Market Revenues & Volume, By Allyl Alcohol Hydrogenation Method, 2021-2031F |
6.1.4 Guyana N-propanol Market Revenues & Volume, By Other Compounds Byproduct Method, 2021-2031F |
6.2 Guyana N-propanol Market, By Application |
6.2.1 Overview and Analysis |
6.2.2 Guyana N-propanol Market Revenues & Volume, By Coatings, 2021-2031F |
6.2.3 Guyana N-propanol Market Revenues & Volume, By Food Additive, 2021-2031F |
6.2.4 Guyana N-propanol Market Revenues & Volume, By Pharmaceutical, 2021-2031F |
6.2.5 Guyana N-propanol Market Revenues & Volume, By Cosmetics, 2021-2031F |
6.2.6 Guyana N-propanol Market Revenues & Volume, By Others, 2021-2031F |
7 Guyana N-propanol Market Import-Export Trade Statistics |
7.1 Guyana N-propanol Market Export to Major Countries |
7.2 Guyana N-propanol Market Imports from Major Countries |
8 Guyana N-propanol Market Key Performance Indicators |
8.1 Number of new product developments or innovations using n-propanol |
8.2 Percentage increase in n-propanol exports from Guyana |
8.3 Adoption rate of n-propanol in new industries or applications |
9 Guyana N-propanol Market - Opportunity Assessment |
9.1 Guyana N-propanol Market Opportunity Assessment, By Type, 2021 & 2031F |
9.2 Guyana N-propanol Market Opportunity Assessment, By Application, 2021 & 2031F |
10 Guyana N-propanol Market - Competitive Landscape |
10.1 Guyana N-propanol Market Revenue Share, By Companies, 2024 |
10.2 Guyana N-propanol Market Competitive Benchmarking, By Operating and Technical Parameters |
11 Company Profiles |
12 Recommendations | 13 Disclaimer |
Global Go To Market Strategy - 2030
Export potential enables firms to identify high-growth global markets with greater confidence by combining advanced trade intelligence with a structured quantitative methodology. The framework analyzes emerging demand trends and country-level import patterns while integrating macroeconomic and trade datasets such as GDP and population forecasts, bilateral import–export flows, tariff structures, elasticity differentials between developed and developing economies, geographic distance, and import demand projections. Using weighted trade values from 2020–2024 as the base period to project country-to-country export potential for 2030, these inputs are operationalized through calculated drivers such as gravity model parameters, tariff impact factors, and projected GDP per-capita growth. Through an analysis of hidden potentials, demand hotspots, and market conditions that are most favorable to success, this method enables firms to focus on target countries, maximize returns, and global expansion with data, backed by accuracy.
By factoring in the projected importer demand gap that is currently unmet and could be potential opportunity, it identifies the potential for the Exporter (Country) among 190 countries, against the general trade analysis, which identifies the biggest importer or exporter.
To discover high-growth global markets and optimize your business strategy:
Click Here
Pricing
- Single User License$ 1,995
- Department License$ 2,400
- Site License$ 3,120
- Global License$ 3,795

Leadership Perspectives from Industry Events
Search
Thought Leadership and Analyst Meet


Our Clients
6WResearch In News
- Doha a strategic location for EV manufacturing hub: IPA Qatar
- Demand for luxury TVs surging in the GCC, says Samsung
- Empowering Growth: The Thriving Journey of Bangladesh’s Cable Industry
- Demand for luxury TVs surging in the GCC, says Samsung
- Video call with a traditional healer? Once unthinkable, it’s now common in South Africa
- Intelligent Buildings To Smooth GCC’s Path To Net Zero
Latest Reports
- Taiwan Airport Wireless Infrastructure Market (2026-2032)
- Vietnam Airport Wireless Infrastructure Market (2026-2032)
- Thailand Airport Wireless Infrastructure Market (2026-2032)
- South Korea Airport Wireless Infrastructure Market (2026-2032)
- Romania Airport Wireless Infrastructure Market (2026-2032)
- Qatar Airport Wireless Infrastructure Market (2026-2032)
- Philippines Airport Wireless Infrastructure Market (2026-2032)
- Japan Airport Wireless Infrastructure Market (2026-2032)
- Taiwan Airport Winter Services Market (2026-2032)
- Vietnam Airport Winter Services Market (2026-2032)
Industry Events and Analyst Meet

HIMTEX 2026

India Refining Summit 2026

India EV Show 2026

EV tech India Expo 2026

Auto Tech Asia 2026
Whitepaper
- Middle East & Africa Commercial Security Market Click here to view more.
- Middle East & Africa Fire Safety Systems & Equipment Market Click here to view more.
- GCC Drone Market Click here to view more.
- Middle East Lighting Fixture Market Click here to view more.
- GCC Physical & Perimeter Security Market Click here to view more.