Hong Kong Port Wine Market (2026-2032) | Value, Demand, Segmentation, Growth, Restraints, Industry, Companies, Revenue, Supply, Consumer Insights, Competitive, Competition, Forecast, Segments, Trends, Analysis, Strategic Insights, Investment Trends, Strategy, Share, Pricing Analysis, Drivers, Size, Challenges, Outlook, Opportunities
Market Forecast By Type (Ruby, Tawny, Vintage, White Port, Rose Port), By Age Category (Young, Aged, Reserve, Colheita, Single Harvest), By Distribution Channel (Online, Supermarkets, Wine Shops, Duty-Free Stores, Direct Sales), By Application (Household, Restaurants, Hotels, Bars, Events) And Competitive Landscape
| Product Code: ETC13023339 | Publication Date: Apr 2025 | Updated Date: Apr 2026 | Product Type: Market Research Report | |
| Publisher: 6Wresearch | Author: Sachin Kumar Rai | No. of Pages: 65 | No. of Figures: 34 | No. of Tables: 19 |
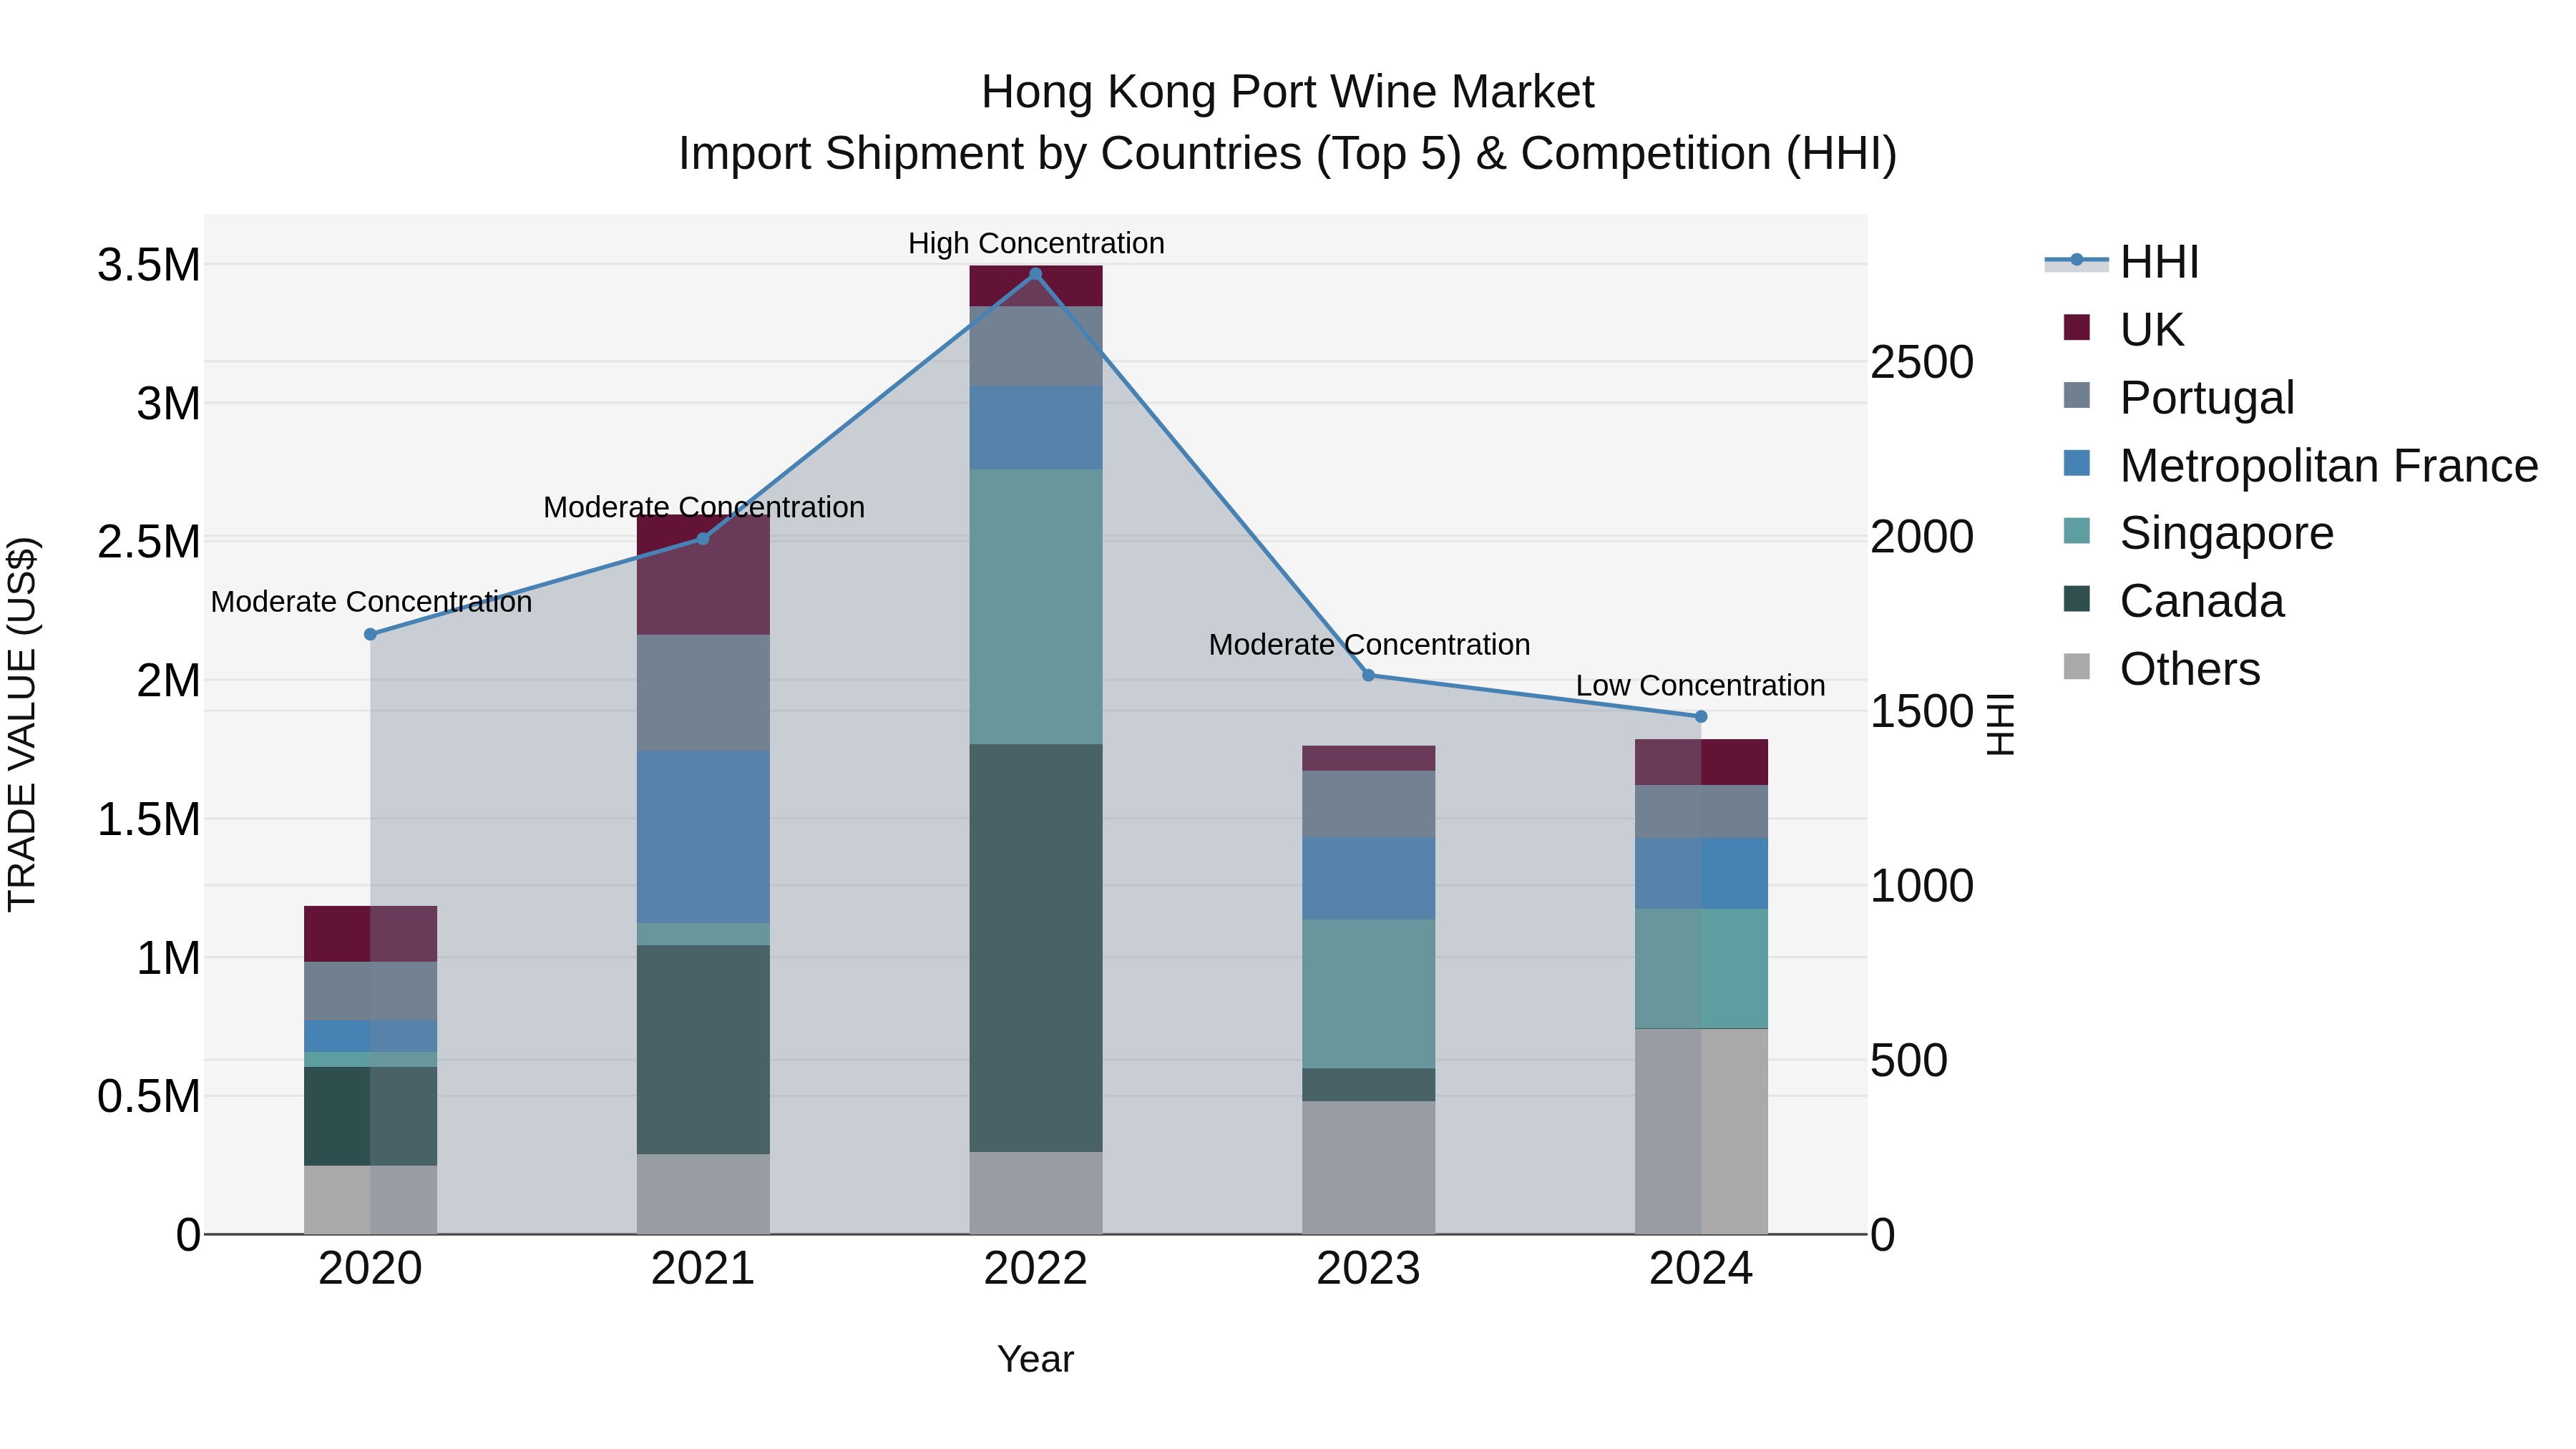
Hong Kong Port Wine Market Top 5 Importing Countries and Market Competition (HHI) Analysis
The Hong Kong port wine import market saw a diverse range of countries dominating the shipments in 2024, with Singapore, China, Metropolitan France, Portugal, and the UK taking the lead. The market concentration, as measured by the Herfindahl-Hirschman Index (HHI), decreased from moderate to low in 2024, indicating a more competitive landscape. The compound annual growth rate (CAGR) from 2020 to 2024 stood at a healthy 10.83%, with a slight growth rate of 1.23% from 2023 to 2024, reflecting a steady but positive trend in the market.
Key Highlights of the Report:
- Hong Kong Port Wine Market Outlook
- Market Size of Hong Kong Port Wine Market, 2025
- Forecast of Hong Kong Port Wine Market, 2032
- Historical Data and Forecast of Hong Kong Port Wine Revenues & Volume for the Period 2022 - 2032F
- Hong Kong Port Wine Market Trend Evolution
- Hong Kong Port Wine Market Drivers and Challenges
- Hong Kong Port Wine Price Trends
- Hong Kong Port Wine Porter's Five Forces
- Hong Kong Port Wine Industry Life Cycle
- Historical Data and Forecast of Hong Kong Port Wine Market Revenues & Volume By Type for the Period 2022 - 2032F
- Historical Data and Forecast of Hong Kong Port Wine Market Revenues & Volume By Ruby for the Period 2022 - 2032F
- Historical Data and Forecast of Hong Kong Port Wine Market Revenues & Volume By Tawny for the Period 2022 - 2032F
- Historical Data and Forecast of Hong Kong Port Wine Market Revenues & Volume By Vintage for the Period 2022 - 2032F
- Historical Data and Forecast of Hong Kong Port Wine Market Revenues & Volume By White Port for the Period 2022 - 2032F
- Historical Data and Forecast of Hong Kong Port Wine Market Revenues & Volume By Rose Port for the Period 2022 - 2032F
- Historical Data and Forecast of Hong Kong Port Wine Market Revenues & Volume By Age Category for the Period 2022 - 2032F
- Historical Data and Forecast of Hong Kong Port Wine Market Revenues & Volume By Young for the Period 2022 - 2032F
- Historical Data and Forecast of Hong Kong Port Wine Market Revenues & Volume By Aged for the Period 2022 - 2032F
- Historical Data and Forecast of Hong Kong Port Wine Market Revenues & Volume By Reserve for the Period 2022 - 2032F
- Historical Data and Forecast of Hong Kong Port Wine Market Revenues & Volume By Colheita for the Period 2022 - 2032F
- Historical Data and Forecast of Hong Kong Port Wine Market Revenues & Volume By Single Harvest for the Period 2022 - 2032F
- Historical Data and Forecast of Hong Kong Port Wine Market Revenues & Volume By Distribution Channel for the Period 2022 - 2032F
- Historical Data and Forecast of Hong Kong Port Wine Market Revenues & Volume By Online for the Period 2022 - 2032F
- Historical Data and Forecast of Hong Kong Port Wine Market Revenues & Volume By Supermarkets for the Period 2022 - 2032F
- Historical Data and Forecast of Hong Kong Port Wine Market Revenues & Volume By Wine Shops for the Period 2022 - 2032F
- Historical Data and Forecast of Hong Kong Port Wine Market Revenues & Volume By Duty-Free Stores for the Period 2022 - 2032F
- Historical Data and Forecast of Hong Kong Port Wine Market Revenues & Volume By Direct Sales for the Period 2022 - 2032F
- Historical Data and Forecast of Hong Kong Port Wine Market Revenues & Volume By Application for the Period 2022 - 2032F
- Historical Data and Forecast of Hong Kong Port Wine Market Revenues & Volume By Household for the Period 2022 - 2032F
- Historical Data and Forecast of Hong Kong Port Wine Market Revenues & Volume By Restaurants for the Period 2022 - 2032F
- Historical Data and Forecast of Hong Kong Port Wine Market Revenues & Volume By Hotels for the Period 2022 - 2032F
- Historical Data and Forecast of Hong Kong Port Wine Market Revenues & Volume By Bars for the Period 2022 - 2032F
- Historical Data and Forecast of Hong Kong Port Wine Market Revenues & Volume By Events for the Period 2022 - 2032F
- Hong Kong Port Wine Import Export Trade Statistics
- Market Opportunity Assessment By Type
- Market Opportunity Assessment By Age Category
- Market Opportunity Assessment By Distribution Channel
- Market Opportunity Assessment By Application
- Hong Kong Port Wine Top Companies Market Share
- Hong Kong Port Wine Competitive Benchmarking By Technical and Operational Parameters
- Hong Kong Port Wine Company Profiles
- Hong Kong Port Wine Key Strategic Recommendations
Frequently Asked Questions About the Market Study (FAQs):
6Wresearch actively monitors the Hong Kong Port Wine Market and publishes its comprehensive annual report, highlighting emerging trends, growth drivers, revenue analysis, and forecast outlook. Our insights help businesses to make data-backed strategic decisions with ongoing market dynamics. Our analysts track relevent industries related to the Hong Kong Port Wine Market, allowing our clients with actionable intelligence and reliable forecasts tailored to emerging regional needs.
Yes, we provide customisation as per your requirements. To learn more, feel free to contact us on sales@6wresearch.com
1 Executive Summary |
2 Introduction |
2.1 Key Highlights of the Report |
2.2 Report Description |
2.3 Market Scope & Segmentation |
2.4 Research Methodology |
2.5 Assumptions |
3 Hong Kong Port Wine Market Overview |
3.1 Hong Kong Country Macro Economic Indicators |
3.2 Hong Kong Port Wine Market Revenues & Volume, 2022 & 2032F |
3.3 Hong Kong Port Wine Market - Industry Life Cycle |
3.4 Hong Kong Port Wine Market - Porter's Five Forces |
3.5 Hong Kong Port Wine Market Revenues & Volume Share, By Type, 2022 & 2032F |
3.6 Hong Kong Port Wine Market Revenues & Volume Share, By Age Category, 2022 & 2032F |
3.7 Hong Kong Port Wine Market Revenues & Volume Share, By Distribution Channel, 2022 & 2032F |
3.8 Hong Kong Port Wine Market Revenues & Volume Share, By Application, 2022 & 2032F |
4 Hong Kong Port Wine Market Dynamics |
4.1 Impact Analysis |
4.2 Market Drivers |
4.2.1 Increasing demand for premium and luxury products in the Hong Kong market |
4.2.2 Growing popularity of wine culture and appreciation for high-quality wines |
4.2.3 Rising disposable incomes and changing consumer preferences towards wine consumption |
4.3 Market Restraints |
4.3.1 High import duties and taxes affecting the pricing and affordability of port wine |
4.3.2 Competition from other alcoholic beverages like whiskey, gin, and craft beers |
4.3.3 Regulatory restrictions and compliance requirements in the wine industry |
5 Hong Kong Port Wine Market Trends |
6 Hong Kong Port Wine Market, By Types |
6.1 Hong Kong Port Wine Market, By Type |
6.1.1 Overview and Analysis |
6.1.2 Hong Kong Port Wine Market Revenues & Volume, By Type, 2022 - 2032F |
6.1.3 Hong Kong Port Wine Market Revenues & Volume, By Ruby, 2022 - 2032F |
6.1.4 Hong Kong Port Wine Market Revenues & Volume, By Tawny, 2022 - 2032F |
6.1.5 Hong Kong Port Wine Market Revenues & Volume, By Vintage, 2022 - 2032F |
6.1.6 Hong Kong Port Wine Market Revenues & Volume, By White Port, 2022 - 2032F |
6.1.7 Hong Kong Port Wine Market Revenues & Volume, By Rose Port, 2022 - 2032F |
6.2 Hong Kong Port Wine Market, By Age Category |
6.2.1 Overview and Analysis |
6.2.2 Hong Kong Port Wine Market Revenues & Volume, By Young, 2022 - 2032F |
6.2.3 Hong Kong Port Wine Market Revenues & Volume, By Aged, 2022 - 2032F |
6.2.4 Hong Kong Port Wine Market Revenues & Volume, By Reserve, 2022 - 2032F |
6.2.5 Hong Kong Port Wine Market Revenues & Volume, By Colheita, 2022 - 2032F |
6.2.6 Hong Kong Port Wine Market Revenues & Volume, By Single Harvest, 2022 - 2032F |
6.3 Hong Kong Port Wine Market, By Distribution Channel |
6.3.1 Overview and Analysis |
6.3.2 Hong Kong Port Wine Market Revenues & Volume, By Online, 2022 - 2032F |
6.3.3 Hong Kong Port Wine Market Revenues & Volume, By Supermarkets, 2022 - 2032F |
6.3.4 Hong Kong Port Wine Market Revenues & Volume, By Wine Shops, 2022 - 2032F |
6.3.5 Hong Kong Port Wine Market Revenues & Volume, By Duty-Free Stores, 2022 - 2032F |
6.3.6 Hong Kong Port Wine Market Revenues & Volume, By Direct Sales, 2022 - 2032F |
6.4 Hong Kong Port Wine Market, By Application |
6.4.1 Overview and Analysis |
6.4.2 Hong Kong Port Wine Market Revenues & Volume, By Household, 2022 - 2032F |
6.4.3 Hong Kong Port Wine Market Revenues & Volume, By Restaurants, 2022 - 2032F |
6.4.4 Hong Kong Port Wine Market Revenues & Volume, By Hotels, 2022 - 2032F |
6.4.5 Hong Kong Port Wine Market Revenues & Volume, By Bars, 2022 - 2032F |
6.4.6 Hong Kong Port Wine Market Revenues & Volume, By Events, 2022 - 2032F |
7 Hong Kong Port Wine Market Import-Export Trade Statistics |
7.1 Hong Kong Port Wine Market Export to Major Countries |
7.2 Hong Kong Port Wine Market Imports from Major Countries |
8 Hong Kong Port Wine Market Key Performance Indicators |
8.1 Average spend per customer on port wine |
8.2 Number of high-end restaurants and bars offering port wine in their menu |
8.3 Consumer sentiment and engagement with port wine events and tastings |
8.4 Number of wine education programs and initiatives in Hong Kong |
8.5 Market penetration of premium port wine brands in the region |
9 Hong Kong Port Wine Market - Opportunity Assessment |
9.1 Hong Kong Port Wine Market Opportunity Assessment, By Type, 2022 & 2032F |
9.2 Hong Kong Port Wine Market Opportunity Assessment, By Age Category, 2022 & 2032F |
9.3 Hong Kong Port Wine Market Opportunity Assessment, By Distribution Channel, 2022 & 2032F |
9.4 Hong Kong Port Wine Market Opportunity Assessment, By Application, 2022 & 2032F |
10 Hong Kong Port Wine Market - Competitive Landscape |
10.1 Hong Kong Port Wine Market Revenue Share, By Companies, 2025 |
10.2 Hong Kong Port Wine Market Competitive Benchmarking, By Operating and Technical Parameters |
11 Company Profiles |
12 Recommendations |
13 Disclaimer |
Export potential assessment - trade Analytics for 2030
Export potential enables firms to identify high-growth global markets with greater confidence by combining advanced trade intelligence with a structured quantitative methodology. The framework analyzes emerging demand trends and country-level import patterns while integrating macroeconomic and trade datasets such as GDP and population forecasts, bilateral import–export flows, tariff structures, elasticity differentials between developed and developing economies, geographic distance, and import demand projections. Using weighted trade values from 2020–2024 as the base period to project country-to-country export potential for 2030, these inputs are operationalized through calculated drivers such as gravity model parameters, tariff impact factors, and projected GDP per-capita growth. Through an analysis of hidden potentials, demand hotspots, and market conditions that are most favorable to success, this method enables firms to focus on target countries, maximize returns, and global expansion with data, backed by accuracy.
By factoring in the projected importer demand gap that is currently unmet and could be potential opportunity, it identifies the potential for the Exporter (Country) among 190 countries, against the general trade analysis, which identifies the biggest importer or exporter.
To discover high-growth global markets and optimize your business strategy:
Click Here
Pricing
- Single User License$ 1,995
- Department License$ 2,400
- Site License$ 3,120
- Global License$ 3,795

Search
Thought Leadership and Analyst Meet


Our Clients
Latest Reports
- United Kingdom (UK) Outdoor Cooking Equipment Market (2026-2032) | Investment Opportunities, Outlook, Growth, Competition, Trends, Pricing, Demand, Insights, Challenges, Drivers, Size, Restraints, segmentation, Value, Share, Forecast, Companies, Analysis, Revenue, Strategy
- United Arab Emirates (UAE) Outdoor Cooking Equipment Market (2026-2032) | Challenges, Value, Restraints, Growth, Competition, Revenue, Trends, Outlook, Analysis, Drivers, Share, Investment Opportunities, Strategy, Demand, Companies, Forecast, Pricing, segmentation, Size, Insights
- Vietnam Outdoor Cooking Equipment Market (2026-2032) | Demand, Investment Opportunities, Growth, Pricing, Trends, Restraints, Competition, Outlook, Drivers, Strategy, Challenges, Revenue, Analysis, segmentation, Value, Size, Share, Insights, Companies, Forecast
- Venezuela Outdoor Cooking Equipment Market (2026-2032) | Challenges, Revenue, Demand, Value, Pricing, Strategy, Competition, Analysis, Companies, Insights, Growth, Outlook, Forecast, Size, Restraints, segmentation, Drivers, Trends, Investment Opportunities, Share
- Uganda Outdoor Cooking Equipment Market (2026-2032) | Drivers, Pricing, Challenges, Value, Growth, Companies, segmentation, Strategy, Analysis, Demand, Outlook, Size, Competition, Restraints, Revenue, Forecast, Investment Opportunities, Insights, Trends, Share
- Turkey Outdoor Cooking Equipment Market (2026-2032) | Size, Competition, Outlook, Strategy, Forecast, Drivers, Trends, Companies, Revenue, Growth, Analysis, segmentation, Insights, Pricing, Restraints, Demand, Investment Opportunities, Value, Share, Challenges
- Tunisia Outdoor Cooking Equipment Market (2026-2032) | Analysis, Share, Pricing, Trends, Size, Outlook, Revenue, segmentation, Demand, Insights, Investment Opportunities, Restraints, Growth, Forecast, Competition, Drivers, Challenges, Companies, Strategy, Value
- Thailand Outdoor Cooking Equipment Market (2026-2032) | Growth, Revenue, Insights, Companies, Drivers, Strategy, Forecast, Size, Analysis, segmentation, Trends, Challenges, Competition, Share, Investment Opportunities, Demand, Pricing, Value, Restraints, Outlook
- Tanzania Outdoor Cooking Equipment Market (2026-2032) | Share, Drivers, Forecast, Revenue, Growth, Outlook, Analysis, Investment Opportunities, Restraints, segmentation, Demand, Pricing, Size, Insights, Challenges, Competition, Companies, Value, Trends, Strategy
- Tajikistan Outdoor Cooking Equipment Market (2026-2032) | Value, Pricing, Companies, Share, Strategy, Revenue, Investment Opportunities, Demand, Forecast, Size, Competition, Challenges, Growth, Insights, Restraints, segmentation, Analysis, Trends, Drivers, Outlook
Industry Events and Analyst Meet

HIMTEX 2026

India Refining Summit 2026

India EV Show 2026

EV tech India Expo 2026

Auto Tech Asia 2026
Whitepaper
- Middle East & Africa Commercial Security Market Click here to view more.
- Middle East & Africa Fire Safety Systems & Equipment Market Click here to view more.
- GCC Drone Market Click here to view more.
- Middle East Lighting Fixture Market Click here to view more.
- GCC Physical & Perimeter Security Market Click here to view more.
6WResearch In News
- Doha a strategic location for EV manufacturing hub: IPA Qatar
- Demand for luxury TVs surging in the GCC, says Samsung
- Empowering Growth: The Thriving Journey of Bangladesh’s Cable Industry
- Demand for luxury TVs surging in the GCC, says Samsung
- Video call with a traditional healer? Once unthinkable, it’s now common in South Africa
- Intelligent Buildings To Smooth GCC’s Path To Net Zero