Hungary Pipeline Construction Market (2026-2032) | Trends, Growth, Competitive Landscape, Share, Companies, Size & Revenue, Value, Outlook, Forecast, Segmentation, Industry, Analysis
Market Forecast By Pipe Type (Metallic, Non-Metallic), By Application (Liquid Pipeline, Gas Pipeline), By End User (Oil and Gas, Chemical, Water and Wastewater, Energy, Others) And Competitive Landscape
| Product Code: ETC7507774 | Publication Date: Sep 2024 | Updated Date: Apr 2026 | Product Type: Market Research Report | |
| Publisher: 6Wresearch | Author: Dhaval Chaurasia | No. of Pages: 75 | No. of Figures: 35 | No. of Tables: 20 |
Hungary Pipeline Construction Market Size (2020-2030)
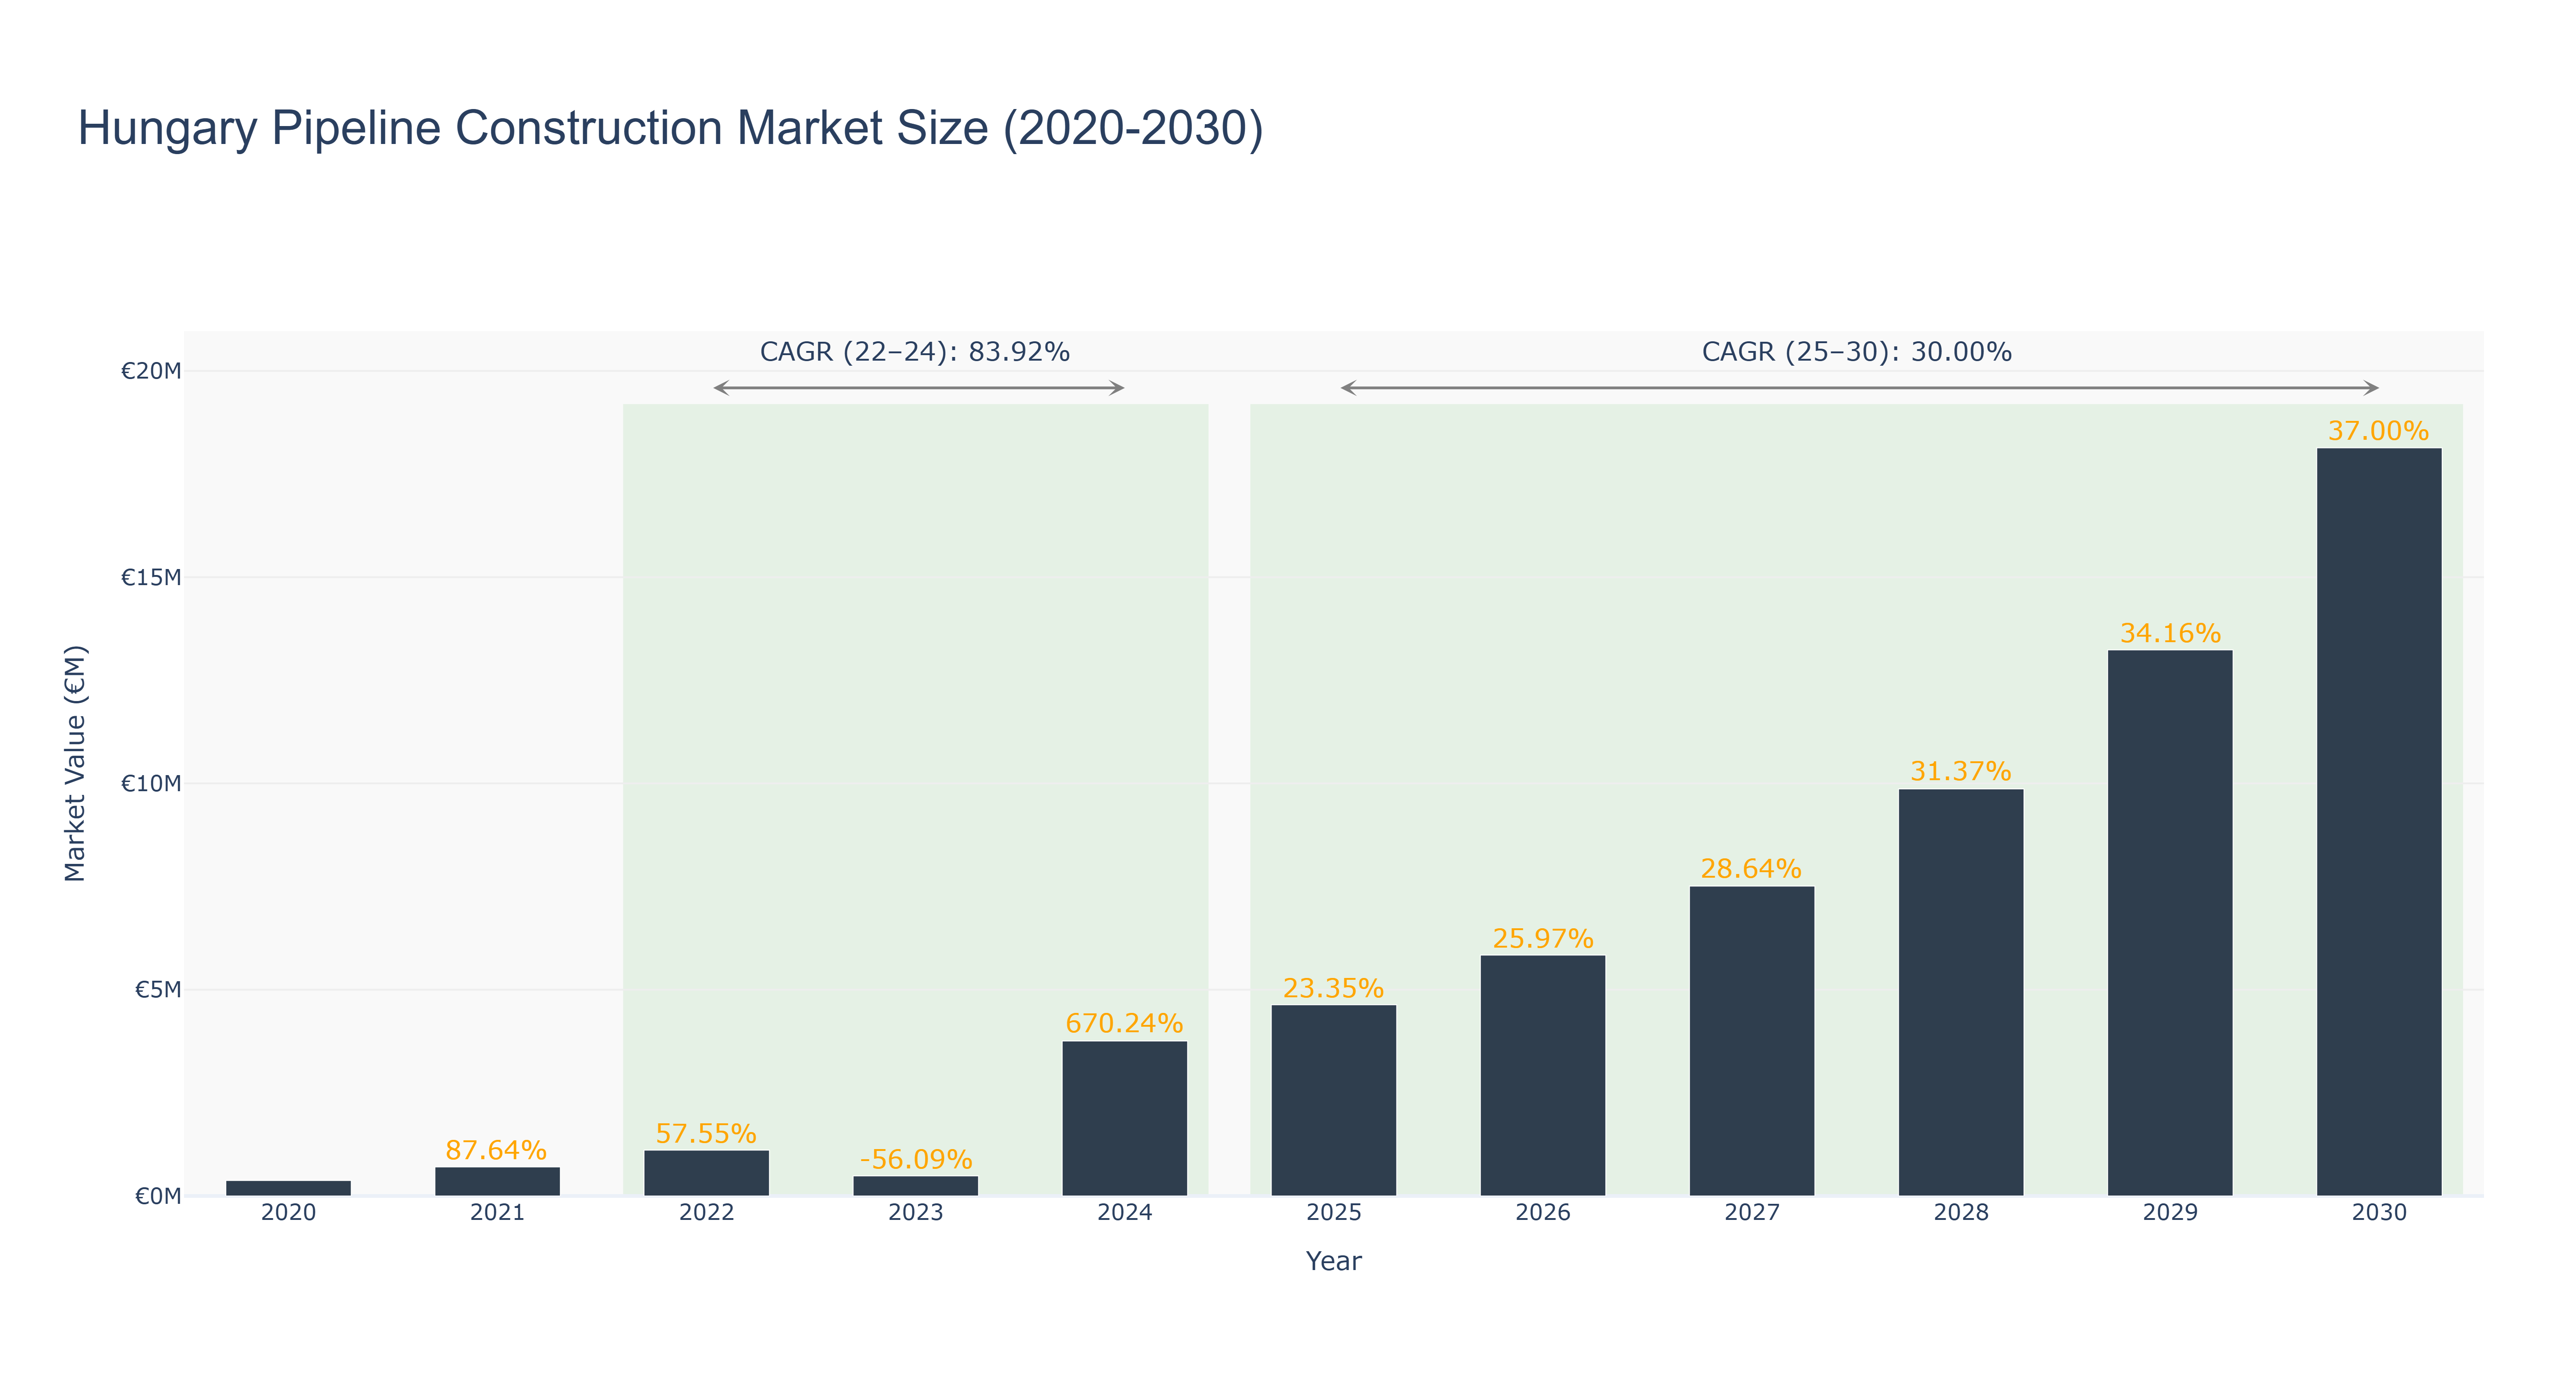
Hungary's Pipeline Construction Market has shown significant growth over the past decade. The market size peaked at €18.14 million in 2030, with a notable increase in market size from €0.38 million in 2020 to €3.76 million in 2024. The forecasted market size is expected to continue growing, reaching €18.14 million by 2030. The CAGR for the period 2022-24 was 83.92%, reflecting a period of rapid expansion, while the CAGR for 2025-30 is projected at 30.0%. The market's growth can be attributed to increased infrastructure investments, urbanization trends, and government initiatives promoting construction projects. Recent developments in Hungary's pipeline construction sector include the implementation of advanced technologies for efficient project management and the initiation of large-scale infrastructure projects to enhance the country's energy distribution network. These developments are poised to further boost market growth and attract investment opportunities in the coming years.
Hungary Pipeline Construction Market: Production & Trade Performance (2019-2025)
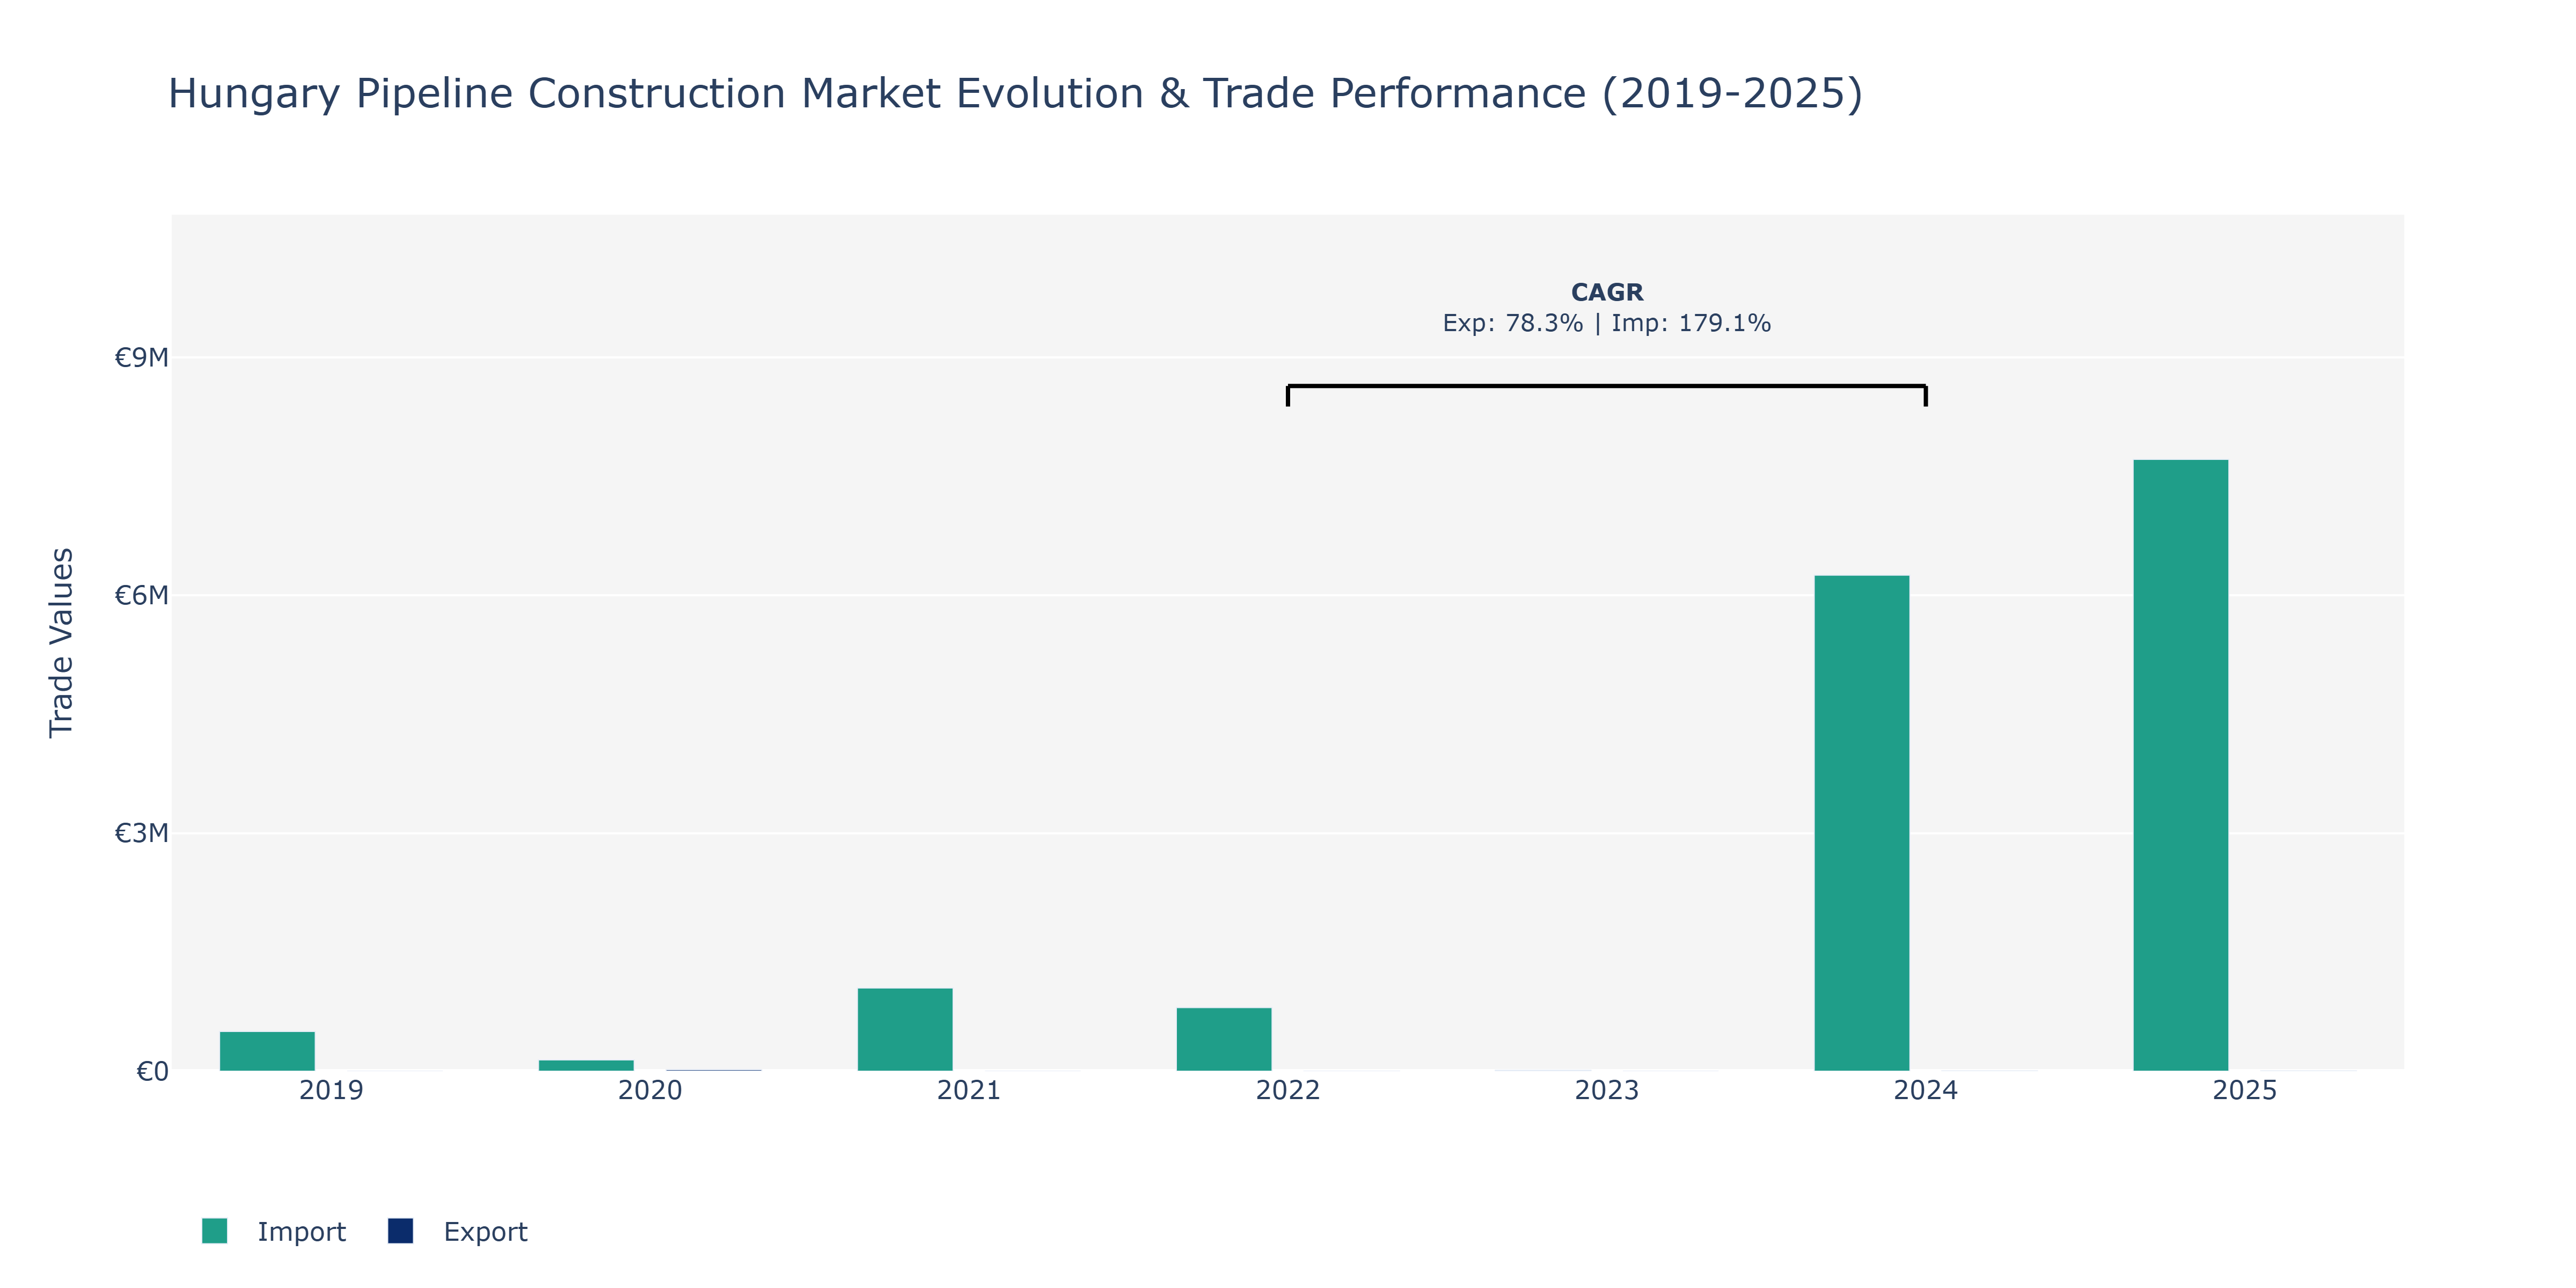
Between 2019 and 2025, Hungary's Pipeline Construction Market witnessed fluctuations in both Exports and Imports. In 2019, Imports stood at €500.78 thousand, gradually increasing to €7.71 million by 2025. Despite a decline in 2021, Exports peaked in 2025 at €3.59 billion, reflecting a positive growth trajectory. Notably, Imports surged significantly in 2024, reaching €6.25 million, showcasing a spike in demand. These fluctuations may be attributed to infrastructure development projects, with increased imports indicating higher construction activity and Exports demonstrating Hungary's growing expertise in pipeline construction services. The CAGR for Exports from 2022 to 2024 was 78.27%, and for Imports, it was 179.14%, signifying a robust market expansion driven by technological advancements and strategic partnerships within the industry, aligning with the global push towards sustainable energy infrastructure.
Key Highlights of the Report:
- Hungary Pipeline Construction Market Outlook
- Market Size of Hungary Pipeline Construction Market, 2025
- Forecast of Hungary Pipeline Construction Market, 2032
- Historical Data and Forecast of Hungary Pipeline Construction Revenues & Volume for the Period 2022-2032F
- Hungary Pipeline Construction Market Trend Evolution
- Hungary Pipeline Construction Market Drivers and Challenges
- Hungary Pipeline Construction Price Trends
- Hungary Pipeline Construction Porter's Five Forces
- Hungary Pipeline Construction Industry Life Cycle
- Historical Data and Forecast of Hungary Pipeline Construction Market Revenues & Volume By Pipe Type for the Period 2022-2032F
- Historical Data and Forecast of Hungary Pipeline Construction Market Revenues & Volume By Metallic for the Period 2022-2032F
- Historical Data and Forecast of Hungary Pipeline Construction Market Revenues & Volume By Non-Metallic for the Period 2022-2032F
- Historical Data and Forecast of Hungary Pipeline Construction Market Revenues & Volume By Application for the Period 2022-2032F
- Historical Data and Forecast of Hungary Pipeline Construction Market Revenues & Volume By Liquid Pipeline for the Period 2022-2032F
- Historical Data and Forecast of Hungary Pipeline Construction Market Revenues & Volume By Gas Pipeline for the Period 2022-2032F
- Historical Data and Forecast of Hungary Pipeline Construction Market Revenues & Volume By End User for the Period 2022-2032F
- Historical Data and Forecast of Hungary Pipeline Construction Market Revenues & Volume By Oil and Gas for the Period 2022-2032F
- Historical Data and Forecast of Hungary Pipeline Construction Market Revenues & Volume By Chemical for the Period 2022-2032F
- Historical Data and Forecast of Hungary Pipeline Construction Market Revenues & Volume By Water and Wastewater for the Period 2022-2032F
- Historical Data and Forecast of Hungary Pipeline Construction Market Revenues & Volume By Energy for the Period 2022-2032F
- Historical Data and Forecast of Hungary Pipeline Construction Market Revenues & Volume By Others for the Period 2022-2032F
- Hungary Pipeline Construction Import Export Trade Statistics
- Market Opportunity Assessment By Pipe Type
- Market Opportunity Assessment By Application
- Market Opportunity Assessment By End User
- Hungary Pipeline Construction Top Companies Market Share
- Hungary Pipeline Construction Competitive Benchmarking By Technical and Operational Parameters
- Hungary Pipeline Construction Company Profiles
- Hungary Pipeline Construction Key Strategic Recommendations
Frequently Asked Questions About the Market Study (FAQs):
6Wresearch actively monitors the Hungary Pipeline Construction Market and publishes its comprehensive annual report, highlighting emerging trends, growth drivers, revenue analysis, and forecast outlook. Our insights help businesses to make data-backed strategic decisions with ongoing market dynamics. Our analysts track relevent industries related to the Hungary Pipeline Construction Market, allowing our clients with actionable intelligence and reliable forecasts tailored to emerging regional needs.
Yes, we provide customisation as per your requirements. To learn more, feel free to contact us on sales@6wresearch.com
1 Executive Summary |
2 Introduction |
2.1 Key Highlights of the Report |
2.2 Report Description |
2.3 Market Scope & Segmentation |
2.4 Research Methodology |
2.5 Assumptions |
3 Hungary Pipeline Construction Market Overview |
3.1 Hungary Country Macro Economic Indicators |
3.2 Hungary Pipeline Construction Market Revenues & Volume, 2022 & 2032F |
3.3 Hungary Pipeline Construction Market - Industry Life Cycle |
3.4 Hungary Pipeline Construction Market - Porter's Five Forces |
3.5 Hungary Pipeline Construction Market Revenues & Volume Share, By Pipe Type, 2022 & 2032F |
3.6 Hungary Pipeline Construction Market Revenues & Volume Share, By Application, 2022 & 2032F |
3.7 Hungary Pipeline Construction Market Revenues & Volume Share, By End User, 2022 & 2032F |
4 Hungary Pipeline Construction Market Dynamics |
4.1 Impact Analysis |
4.2 Market Drivers |
4.2.1 Increasing investment in infrastructure projects in Hungary |
4.2.2 Growing demand for energy transportation and distribution |
4.2.3 Government initiatives to enhance the country's pipeline network |
4.3 Market Restraints |
4.3.1 Regulatory challenges and approval processes for pipeline construction projects |
4.3.2 Fluctuating raw material prices impacting project costs |
4.3.3 Environmental concerns and opposition from local communities |
5 Hungary Pipeline Construction Market Trends |
6 Hungary Pipeline Construction Market, By Types |
6.1 Hungary Pipeline Construction Market, By Pipe Type |
6.1.1 Overview and Analysis |
6.1.2 Hungary Pipeline Construction Market Revenues & Volume, By Pipe Type, 2022-2032F |
6.1.3 Hungary Pipeline Construction Market Revenues & Volume, By Metallic, 2022-2032F |
6.1.4 Hungary Pipeline Construction Market Revenues & Volume, By Non-Metallic, 2022-2032F |
6.2 Hungary Pipeline Construction Market, By Application |
6.2.1 Overview and Analysis |
6.2.2 Hungary Pipeline Construction Market Revenues & Volume, By Liquid Pipeline, 2022-2032F |
6.2.3 Hungary Pipeline Construction Market Revenues & Volume, By Gas Pipeline, 2022-2032F |
6.3 Hungary Pipeline Construction Market, By End User |
6.3.1 Overview and Analysis |
6.3.2 Hungary Pipeline Construction Market Revenues & Volume, By Oil and Gas, 2022-2032F |
6.3.3 Hungary Pipeline Construction Market Revenues & Volume, By Chemical, 2022-2032F |
6.3.4 Hungary Pipeline Construction Market Revenues & Volume, By Water and Wastewater, 2022-2032F |
6.3.5 Hungary Pipeline Construction Market Revenues & Volume, By Energy, 2022-2032F |
6.3.6 Hungary Pipeline Construction Market Revenues & Volume, By Others, 2022-2032F |
7 Hungary Pipeline Construction Market Import-Export Trade Statistics |
7.1 Hungary Pipeline Construction Market Export to Major Countries |
7.2 Hungary Pipeline Construction Market Imports from Major Countries |
8 Hungary Pipeline Construction Market Key Performance Indicators |
8.1 Number of new pipeline construction projects initiated in Hungary |
8.2 Average project completion time for pipeline construction projects |
8.3 Percentage increase in pipeline length added to Hungary's network each year |
9 Hungary Pipeline Construction Market - Opportunity Assessment |
9.1 Hungary Pipeline Construction Market Opportunity Assessment, By Pipe Type, 2022 & 2032F |
9.2 Hungary Pipeline Construction Market Opportunity Assessment, By Application, 2022 & 2032F |
9.3 Hungary Pipeline Construction Market Opportunity Assessment, By End User, 2022 & 2032F |
10 Hungary Pipeline Construction Market - Competitive Landscape |
10.1 Hungary Pipeline Construction Market Revenue Share, By Companies, 2025 |
10.2 Hungary Pipeline Construction Market Competitive Benchmarking, By Operating and Technical Parameters |
11 Company Profiles |
12 Recommendations |
13 Disclaimer |
Global Go To Market Strategy - 2030
Export potential enables firms to identify high-growth global markets with greater confidence by combining advanced trade intelligence with a structured quantitative methodology. The framework analyzes emerging demand trends and country-level import patterns while integrating macroeconomic and trade datasets such as GDP and population forecasts, bilateral import–export flows, tariff structures, elasticity differentials between developed and developing economies, geographic distance, and import demand projections. Using weighted trade values from 2020–2024 as the base period to project country-to-country export potential for 2030, these inputs are operationalized through calculated drivers such as gravity model parameters, tariff impact factors, and projected GDP per-capita growth. Through an analysis of hidden potentials, demand hotspots, and market conditions that are most favorable to success, this method enables firms to focus on target countries, maximize returns, and global expansion with data, backed by accuracy.
By factoring in the projected importer demand gap that is currently unmet and could be potential opportunity, it identifies the potential for the Exporter (Country) among 190 countries, against the general trade analysis, which identifies the biggest importer or exporter.
To discover high-growth global markets and optimize your business strategy:
Click Here
Pricing
- Single User License$ 1,995
- Department License$ 2,400
- Site License$ 3,120
- Global License$ 3,795

Leadership Perspectives from Industry Events
Search
Thought Leadership and Analyst Meet


Our Clients
6WResearch In News
- Doha a strategic location for EV manufacturing hub: IPA Qatar
- Demand for luxury TVs surging in the GCC, says Samsung
- Empowering Growth: The Thriving Journey of Bangladesh’s Cable Industry
- Demand for luxury TVs surging in the GCC, says Samsung
- Video call with a traditional healer? Once unthinkable, it’s now common in South Africa
- Intelligent Buildings To Smooth GCC’s Path To Net Zero
Latest Reports
- New Zealand Aseptic Manufacturing Market (2026-2032)
- Netherlands Aseptic Manufacturing Market (2026-2032)
- Nauru Aseptic Manufacturing Market (2026-2032)
- Namibia Aseptic Manufacturing Market (2026-2032)
- Mozambique Aseptic Manufacturing Market (2026-2032)
- Montenegro Aseptic Manufacturing Market (2026-2032)
- Mongolia Aseptic Manufacturing Market (2026-2032)
- Monaco Aseptic Manufacturing Market (2026-2032)
- Micronesia Aseptic Manufacturing Market (2026-2032)
- Mauritius Aseptic Manufacturing Market (2026-2032)
Industry Events and Analyst Meet

HIMTEX 2026

India Refining Summit 2026

India EV Show 2026

EV tech India Expo 2026

Auto Tech Asia 2026
Whitepaper
- Middle East & Africa Commercial Security Market Click here to view more.
- Middle East & Africa Fire Safety Systems & Equipment Market Click here to view more.
- GCC Drone Market Click here to view more.
- Middle East Lighting Fixture Market Click here to view more.
- GCC Physical & Perimeter Security Market Click here to view more.