Iceland Non-Metallic Enclosure Market (2026-2032) | Share, Size & Revenue, Companies, Growth, Value, Trends, Forecast, Competitive Landscape, Outlook, Industry, Segmentation, Analysis
Market Forecast By Material Type (Fiberglass, Polycarbonate, PVC, Polyester), By Type (Junction Enclosures, Disconnect Enclosures, Operator Interface Enclosures, Environment and Climate Control Enclosures, Push Button Enclosures), By Design (Standard Type, Custom Type), By Mounted Type (Wall Mounted Enclosure, Floor-Mounted/Free Standing Enclosure, Underground), By Form Factor (Small Enclosure, Compact Enclosure, Free-Size Enclosure), By Capacity Range (Less than 400 cu.in, More than 400 cu.in), By Place (Indoor, Outdoor), By Weight (Less than 10 lbs, More than 10 lbs) And Competitive Landscape
| Product Code: ETC7527397 | Publication Date: Sep 2024 | Updated Date: Feb 2026 | Product Type: Market Research Report | |
| Publisher: 6Wresearch | Author: Shubham Padhi | No. of Pages: 75 | No. of Figures: 35 | No. of Tables: 20 |
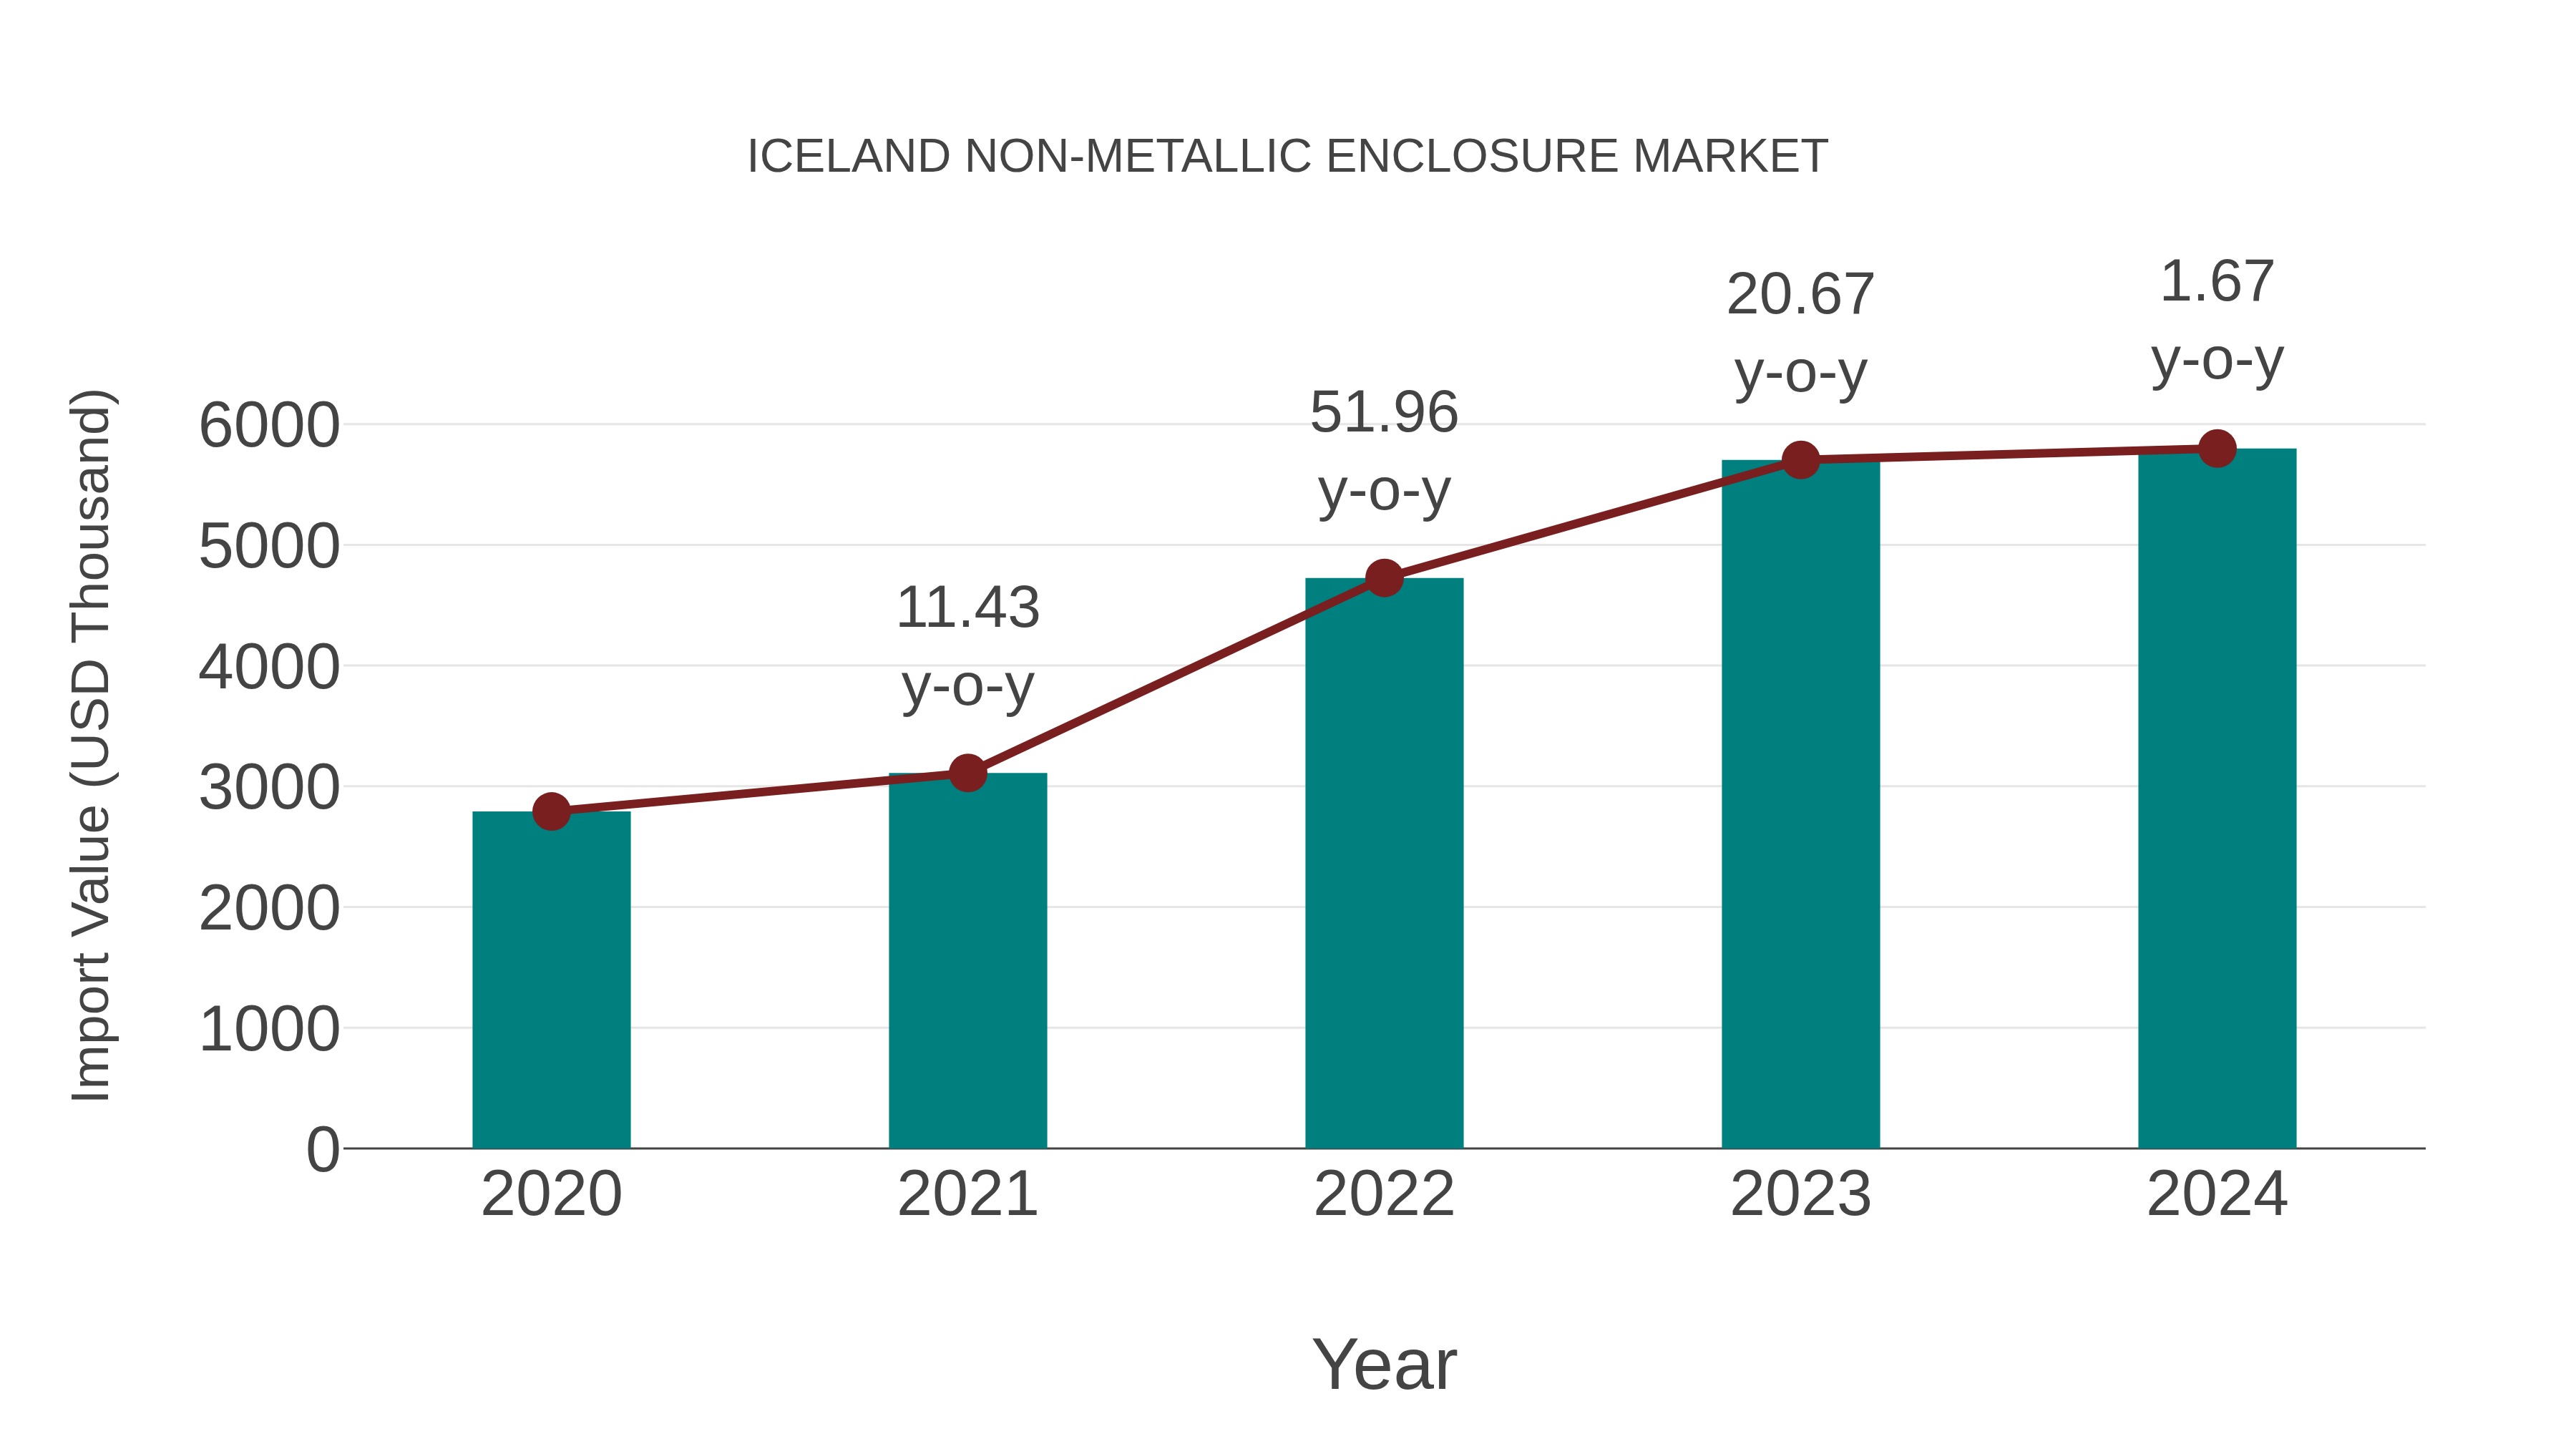
Iceland Non-metallic Enclosure Market: Import Trend Analysis
During 2020-2024, the Iceland non-metallic enclosure market witnessed a steady increase in imports. The compound annual growth rate (CAGR) for this period stood at 20.05%. In 2023-2024, the year-on-year growth rate was 1.67%, contributing to the overall growth trend in import volumes.
Key Highlights of the Report:
- Iceland Non-Metallic Enclosure Market Outlook
- Market Size of Iceland Non-Metallic Enclosure Market, 2025
- Forecast of Iceland Non-Metallic Enclosure Market, 2032
- Historical Data and Forecast of Iceland Non-Metallic Enclosure Revenues & Volume for the Period 2022-2032F
- Iceland Non-Metallic Enclosure Market Trend Evolution
- Iceland Non-Metallic Enclosure Market Drivers and Challenges
- Iceland Non-Metallic Enclosure Price Trends
- Iceland Non-Metallic Enclosure Porter's Five Forces
- Iceland Non-Metallic Enclosure Industry Life Cycle
- Historical Data and Forecast of Iceland Non-Metallic Enclosure Market Revenues & Volume By Material Type for the Period 2022-2032F
- Historical Data and Forecast of Iceland Non-Metallic Enclosure Market Revenues & Volume By Fiberglass for the Period 2022-2032F
- Historical Data and Forecast of Iceland Non-Metallic Enclosure Market Revenues & Volume By Polycarbonate for the Period 2022-2032F
- Historical Data and Forecast of Iceland Non-Metallic Enclosure Market Revenues & Volume By PVC for the Period 2022-2032F
- Historical Data and Forecast of Iceland Non-Metallic Enclosure Market Revenues & Volume By Polyester for the Period 2022-2032F
- Historical Data and Forecast of Iceland Non-Metallic Enclosure Market Revenues & Volume By Type for the Period 2022-2032F
- Historical Data and Forecast of Iceland Non-Metallic Enclosure Market Revenues & Volume By Junction Enclosures for the Period 2022-2032F
- Historical Data and Forecast of Iceland Non-Metallic Enclosure Market Revenues & Volume By Disconnect Enclosures for the Period 2022-2032F
- Historical Data and Forecast of Iceland Non-Metallic Enclosure Market Revenues & Volume By Operator Interface Enclosures for the Period 2022-2032F
- Historical Data and Forecast of Iceland Non-Metallic Enclosure Market Revenues & Volume By Environment and Climate Control Enclosures for the Period 2022-2032F
- Historical Data and Forecast of Iceland Non-Metallic Enclosure Market Revenues & Volume By Push Button Enclosures for the Period 2022-2032F
- Historical Data and Forecast of Iceland Non-Metallic Enclosure Market Revenues & Volume By Design for the Period 2022-2032F
- Historical Data and Forecast of Iceland Non-Metallic Enclosure Market Revenues & Volume By Standard Type for the Period 2022-2032F
- Historical Data and Forecast of Iceland Non-Metallic Enclosure Market Revenues & Volume By Custom Type for the Period 2022-2032F
- Historical Data and Forecast of Iceland Non-Metallic Enclosure Market Revenues & Volume By Mounted Type for the Period 2022-2032F
- Historical Data and Forecast of Iceland Non-Metallic Enclosure Market Revenues & Volume By Wall Mounted Enclosure for the Period 2022-2032F
- Historical Data and Forecast of Iceland Non-Metallic Enclosure Market Revenues & Volume By Floor-Mounted/Free Standing Enclosure for the Period 2022-2032F
- Historical Data and Forecast of Iceland Non-Metallic Enclosure Market Revenues & Volume By Underground for the Period 2022-2032F
- Historical Data and Forecast of Iceland Non-Metallic Enclosure Market Revenues & Volume By Form Factor for the Period 2022-2032F
- Historical Data and Forecast of Iceland Non-Metallic Enclosure Market Revenues & Volume By Small Enclosure for the Period 2022-2032F
- Historical Data and Forecast of Iceland Non-Metallic Enclosure Market Revenues & Volume By Compact Enclosure for the Period 2022-2032F
- Historical Data and Forecast of Iceland Non-Metallic Enclosure Market Revenues & Volume By Free-Size Enclosure for the Period 2022-2032F
- Historical Data and Forecast of Iceland Non-Metallic Enclosure Market Revenues & Volume By Capacity Range for the Period 2022-2032F
- Historical Data and Forecast of Iceland Non-Metallic Enclosure Market Revenues & Volume By Less than 400 cu.in for the Period 2022-2032F
- Historical Data and Forecast of Iceland Non-Metallic Enclosure Market Revenues & Volume By More than 400 cu.in for the Period 2022-2032F
- Historical Data and Forecast of Iceland Non-Metallic Enclosure Market Revenues & Volume By Place for the Period 2022-2032F
- Historical Data and Forecast of Iceland Non-Metallic Enclosure Market Revenues & Volume By Indoor for the Period 2022-2032F
- Historical Data and Forecast of Iceland Non-Metallic Enclosure Market Revenues & Volume By Outdoor for the Period 2022-2032F
- Historical Data and Forecast of Iceland Non-Metallic Enclosure Market Revenues & Volume By Weight for the Period 2022-2032F
- Historical Data and Forecast of Iceland Non-Metallic Enclosure Market Revenues & Volume By Less than 10 lbs for the Period 2022-2032F
- Historical Data and Forecast of Iceland Non-Metallic Enclosure Market Revenues & Volume By More than 10 lbs for the Period 2022-2032F
- Iceland Non-Metallic Enclosure Import Export Trade Statistics
- Market Opportunity Assessment By Material Type
- Market Opportunity Assessment By Type
- Market Opportunity Assessment By Design
- Market Opportunity Assessment By Mounted Type
- Market Opportunity Assessment By Form Factor
- Market Opportunity Assessment By Capacity Range
- Market Opportunity Assessment By Place
- Market Opportunity Assessment By Weight
- Iceland Non-Metallic Enclosure Top Companies Market Share
- Iceland Non-Metallic Enclosure Competitive Benchmarking By Technical and Operational Parameters
- Iceland Non-Metallic Enclosure Company Profiles
- Iceland Non-Metallic Enclosure Key Strategic Recommendations
Frequently Asked Questions About the Market Study (FAQs):
6Wresearch actively monitors the Iceland Non-Metallic Enclosure Market and publishes its comprehensive annual report, highlighting emerging trends, growth drivers, revenue analysis, and forecast outlook. Our insights help businesses to make data-backed strategic decisions with ongoing market dynamics. Our analysts track relevent industries related to the Iceland Non-Metallic Enclosure Market, allowing our clients with actionable intelligence and reliable forecasts tailored to emerging regional needs.
Yes, we provide customisation as per your requirements. To learn more, feel free to contact us on sales@6wresearch.com
1 Executive Summary |
2 Introduction |
2.1 Key Highlights of the Report |
2.2 Report Description |
2.3 Market Scope & Segmentation |
2.4 Research Methodology |
2.5 Assumptions |
3 Iceland Non-Metallic Enclosure Market Overview |
3.1 Iceland Country Macro Economic Indicators |
3.2 Iceland Non-Metallic Enclosure Market Revenues & Volume, 2022 & 2032F |
3.3 Iceland Non-Metallic Enclosure Market - Industry Life Cycle |
3.4 Iceland Non-Metallic Enclosure Market - Porter's Five Forces |
3.5 Iceland Non-Metallic Enclosure Market Revenues & Volume Share, By Material Type, 2022 & 2032F |
3.6 Iceland Non-Metallic Enclosure Market Revenues & Volume Share, By Type, 2022 & 2032F |
3.7 Iceland Non-Metallic Enclosure Market Revenues & Volume Share, By Design, 2022 & 2032F |
3.8 Iceland Non-Metallic Enclosure Market Revenues & Volume Share, By Mounted Type, 2022 & 2032F |
3.9 Iceland Non-Metallic Enclosure Market Revenues & Volume Share, By Form Factor, 2022 & 2032F |
3.10 Iceland Non-Metallic Enclosure Market Revenues & Volume Share, By Capacity Range, 2022 & 2032F |
3.11 Iceland Non-Metallic Enclosure Market Revenues & Volume Share, By Place, 2022 & 2032F |
4 Iceland Non-Metallic Enclosure Market Dynamics |
4.1 Impact Analysis |
4.2 Market Drivers |
4.2.1 Increasing demand for non-metallic enclosures in industries such as renewable energy, telecommunications, and IT due to their corrosion resistance and lightweight properties. |
4.2.2 Growing focus on sustainable and environmentally-friendly solutions driving the adoption of non-metallic enclosures. |
4.2.3 Technological advancements leading to the development of innovative non-metallic enclosure solutions with enhanced features and functionalities. |
4.3 Market Restraints |
4.3.1 Limited awareness about the benefits of non-metallic enclosures among end-users, hindering market growth. |
4.3.2 Higher initial costs associated with non-metallic enclosures compared to traditional metallic enclosures impacting adoption rates. |
4.3.3 Challenges related to the recyclability and disposal of non-metallic materials posing environmental concerns. |
5 Iceland Non-Metallic Enclosure Market Trends |
6 Iceland Non-Metallic Enclosure Market, By Types |
6.1 Iceland Non-Metallic Enclosure Market, By Material Type |
6.1.1 Overview and Analysis |
6.1.2 Iceland Non-Metallic Enclosure Market Revenues & Volume, By Material Type, 2022-2032F |
6.1.3 Iceland Non-Metallic Enclosure Market Revenues & Volume, By Fiberglass, 2022-2032F |
6.1.4 Iceland Non-Metallic Enclosure Market Revenues & Volume, By Polycarbonate, 2022-2032F |
6.1.5 Iceland Non-Metallic Enclosure Market Revenues & Volume, By PVC, 2022-2032F |
6.1.6 Iceland Non-Metallic Enclosure Market Revenues & Volume, By Polyester, 2022-2032F |
6.2 Iceland Non-Metallic Enclosure Market, By Type |
6.2.1 Overview and Analysis |
6.2.2 Iceland Non-Metallic Enclosure Market Revenues & Volume, By Junction Enclosures, 2022-2032F |
6.2.3 Iceland Non-Metallic Enclosure Market Revenues & Volume, By Disconnect Enclosures, 2022-2032F |
6.2.4 Iceland Non-Metallic Enclosure Market Revenues & Volume, By Operator Interface Enclosures, 2022-2032F |
6.2.5 Iceland Non-Metallic Enclosure Market Revenues & Volume, By Environment and Climate Control Enclosures, 2022-2032F |
6.2.6 Iceland Non-Metallic Enclosure Market Revenues & Volume, By Push Button Enclosures, 2022-2032F |
6.3 Iceland Non-Metallic Enclosure Market, By Design |
6.3.1 Overview and Analysis |
6.3.2 Iceland Non-Metallic Enclosure Market Revenues & Volume, By Standard Type, 2022-2032F |
6.3.3 Iceland Non-Metallic Enclosure Market Revenues & Volume, By Custom Type, 2022-2032F |
6.4 Iceland Non-Metallic Enclosure Market, By Mounted Type |
6.4.1 Overview and Analysis |
6.4.2 Iceland Non-Metallic Enclosure Market Revenues & Volume, By Wall Mounted Enclosure, 2022-2032F |
6.4.3 Iceland Non-Metallic Enclosure Market Revenues & Volume, By Floor-Mounted/Free Standing Enclosure, 2022-2032F |
6.4.4 Iceland Non-Metallic Enclosure Market Revenues & Volume, By Underground, 2022-2032F |
6.5 Iceland Non-Metallic Enclosure Market, By Form Factor |
6.5.1 Overview and Analysis |
6.5.2 Iceland Non-Metallic Enclosure Market Revenues & Volume, By Small Enclosure, 2022-2032F |
6.5.3 Iceland Non-Metallic Enclosure Market Revenues & Volume, By Compact Enclosure, 2022-2032F |
6.5.4 Iceland Non-Metallic Enclosure Market Revenues & Volume, By Free-Size Enclosure, 2022-2032F |
6.6 Iceland Non-Metallic Enclosure Market, By Capacity Range |
6.6.1 Overview and Analysis |
6.6.2 Iceland Non-Metallic Enclosure Market Revenues & Volume, By Less than 400 cu.in, 2022-2032F |
6.6.3 Iceland Non-Metallic Enclosure Market Revenues & Volume, By More than 400 cu.in, 2022-2032F |
6.7 Iceland Non-Metallic Enclosure Market, By Place |
6.7.1 Overview and Analysis |
6.7.2 Iceland Non-Metallic Enclosure Market Revenues & Volume, By Indoor, 2022-2032F |
6.7.3 Iceland Non-Metallic Enclosure Market Revenues & Volume, By Outdoor, 2022-2032F |
6.8 Iceland Non-Metallic Enclosure Market, By Weight |
6.8.1 Overview and Analysis |
6.8.2 Iceland Non-Metallic Enclosure Market Revenues & Volume, By Less than 10 lbs, 2022-2032F |
6.8.3 Iceland Non-Metallic Enclosure Market Revenues & Volume, By More than 10 lbs, 2022-2032F |
7 Iceland Non-Metallic Enclosure Market Import-Export Trade Statistics |
7.1 Iceland Non-Metallic Enclosure Market Export to Major Countries |
7.2 Iceland Non-Metallic Enclosure Market Imports from Major Countries |
8 Iceland Non-Metallic Enclosure Market Key Performance Indicators |
8.1 Percentage increase in the adoption of non-metallic enclosures across key industries in Iceland. |
8.2 Number of new product launches and innovations in the non-metallic enclosure market. |
8.3 Percentage growth in the number of partnerships and collaborations between non-metallic enclosure manufacturers and end-users for custom solutions. |
9 Iceland Non-Metallic Enclosure Market - Opportunity Assessment |
9.1 Iceland Non-Metallic Enclosure Market Opportunity Assessment, By Material Type, 2022 & 2032F |
9.2 Iceland Non-Metallic Enclosure Market Opportunity Assessment, By Type, 2022 & 2032F |
9.3 Iceland Non-Metallic Enclosure Market Opportunity Assessment, By Design, 2022 & 2032F |
9.4 Iceland Non-Metallic Enclosure Market Opportunity Assessment, By Mounted Type, 2022 & 2032F |
9.5 Iceland Non-Metallic Enclosure Market Opportunity Assessment, By Form Factor, 2022 & 2032F |
9.6 Iceland Non-Metallic Enclosure Market Opportunity Assessment, By Capacity Range, 2022 & 2032F |
9.7 Iceland Non-Metallic Enclosure Market Opportunity Assessment, By Place, 2022 & 2032F |
9.7 Iceland Non-Metallic Enclosure Market Opportunity Assessment, By Weight, 2022 & 2032F |
10 Iceland Non-Metallic Enclosure Market - Competitive Landscape |
10.1 Iceland Non-Metallic Enclosure Market Revenue Share, By Companies, 2025 |
10.2 Iceland Non-Metallic Enclosure Market Competitive Benchmarking, By Operating and Technical Parameters |
11 Company Profiles |
12 Recommendations |
13 Disclaimer |
Export potential assessment - trade Analytics for 2030
Export potential enables firms to identify high-growth global markets with greater confidence by combining advanced trade intelligence with a structured quantitative methodology. The framework analyzes emerging demand trends and country-level import patterns while integrating macroeconomic and trade datasets such as GDP and population forecasts, bilateral import–export flows, tariff structures, elasticity differentials between developed and developing economies, geographic distance, and import demand projections. Using weighted trade values from 2020–2024 as the base period to project country-to-country export potential for 2030, these inputs are operationalized through calculated drivers such as gravity model parameters, tariff impact factors, and projected GDP per-capita growth. Through an analysis of hidden potentials, demand hotspots, and market conditions that are most favorable to success, this method enables firms to focus on target countries, maximize returns, and global expansion with data, backed by accuracy.
By factoring in the projected importer demand gap that is currently unmet and could be potential opportunity, it identifies the potential for the Exporter (Country) among 190 countries, against the general trade analysis, which identifies the biggest importer or exporter.
To discover high-growth global markets and optimize your business strategy:
Click Here
Pricing
- Single User License$ 1,995
- Department License$ 2,400
- Site License$ 3,120
- Global License$ 3,795

Thought Leadership
Search
Thought Leadership and Analyst Meet


Our Clients
Latest Reports
- New Zealand Aseptic Manufacturing Market (2026-2032)
- Netherlands Aseptic Manufacturing Market (2026-2032)
- Nauru Aseptic Manufacturing Market (2026-2032)
- Namibia Aseptic Manufacturing Market (2026-2032)
- Mozambique Aseptic Manufacturing Market (2026-2032)
- Montenegro Aseptic Manufacturing Market (2026-2032)
- Mongolia Aseptic Manufacturing Market (2026-2032)
- Monaco Aseptic Manufacturing Market (2026-2032)
- Micronesia Aseptic Manufacturing Market (2026-2032)
- Mauritius Aseptic Manufacturing Market (2026-2032)
Industry Events and Analyst Meet

HIMTEX 2026

India Refining Summit 2026

India EV Show 2026

EV tech India Expo 2026

Auto Tech Asia 2026
Whitepaper
- Middle East & Africa Commercial Security Market Click here to view more.
- Middle East & Africa Fire Safety Systems & Equipment Market Click here to view more.
- GCC Drone Market Click here to view more.
- Middle East Lighting Fixture Market Click here to view more.
- GCC Physical & Perimeter Security Market Click here to view more.
6WResearch In News
- Doha a strategic location for EV manufacturing hub: IPA Qatar
- Demand for luxury TVs surging in the GCC, says Samsung
- Empowering Growth: The Thriving Journey of Bangladesh’s Cable Industry
- Demand for luxury TVs surging in the GCC, says Samsung
- Video call with a traditional healer? Once unthinkable, it’s now common in South Africa
- Intelligent Buildings To Smooth GCC’s Path To Net Zero