India Mobility-as-a-service Market (2026-2032) Outlook | Value, Share, Growth, Analysis, Companies, Size, Trends, Revenue, Industry & Forecast
Market Forecast By Solution Type (Technology Platform, Insurance Services, Telecom Connectivity Providers, Payment Engines, Ticketing Solutions, Navigation Solutions), By Service Type (Ride Hailing, Car Sharing, Micromobility, Bus Sharing, Train Services), By Transportation Type (Public, Private), By Vehicle Type (Micro mobility, Trains, Buses, Four-wheelers), By Application Type (Personalized Application Services, Journey Management, Journey Planning, Flexible Payments and Transactions), By Operating System (Android, iOS, Others) And Competitive Landscape
| Product Code: ETC071323 | Publication Date: Jun 2023 | Updated Date: Jun 2026 | Product Type: Report | |
| Publisher: 6Wresearch | Author: Ravi Bhandari | No. of Pages: 70 | No. of Figures: 35 | No. of Tables: 5 |
India Mobility-as-a-service Market Size, Share & Growth Rate
The India Mobility-as-a-service Market was estimated at USD 781 Million in 2025 and is projected to reach USD 1120 Million by 2032, growing at a CAGR of 5.3% from 2026 to 2032. This impressive growth trajectory is fueled by an increasing urban population seeking efficient and accessible transportation options, as well as the growing integration of technology in everyday travel solutions. The rise of smartphone penetration and internet connectivity further bolsters the demand for seamless multi-modal transport experiences, positioning MaaS as a pivotal player in transforming India's mobility landscape.
India Mobility-as-a-service Market Year-wise Growth Rate and Key Drivers
This graph highlights how the India Mobility-as-a-service Market has steadily grown over the years, supported by major growth factors.
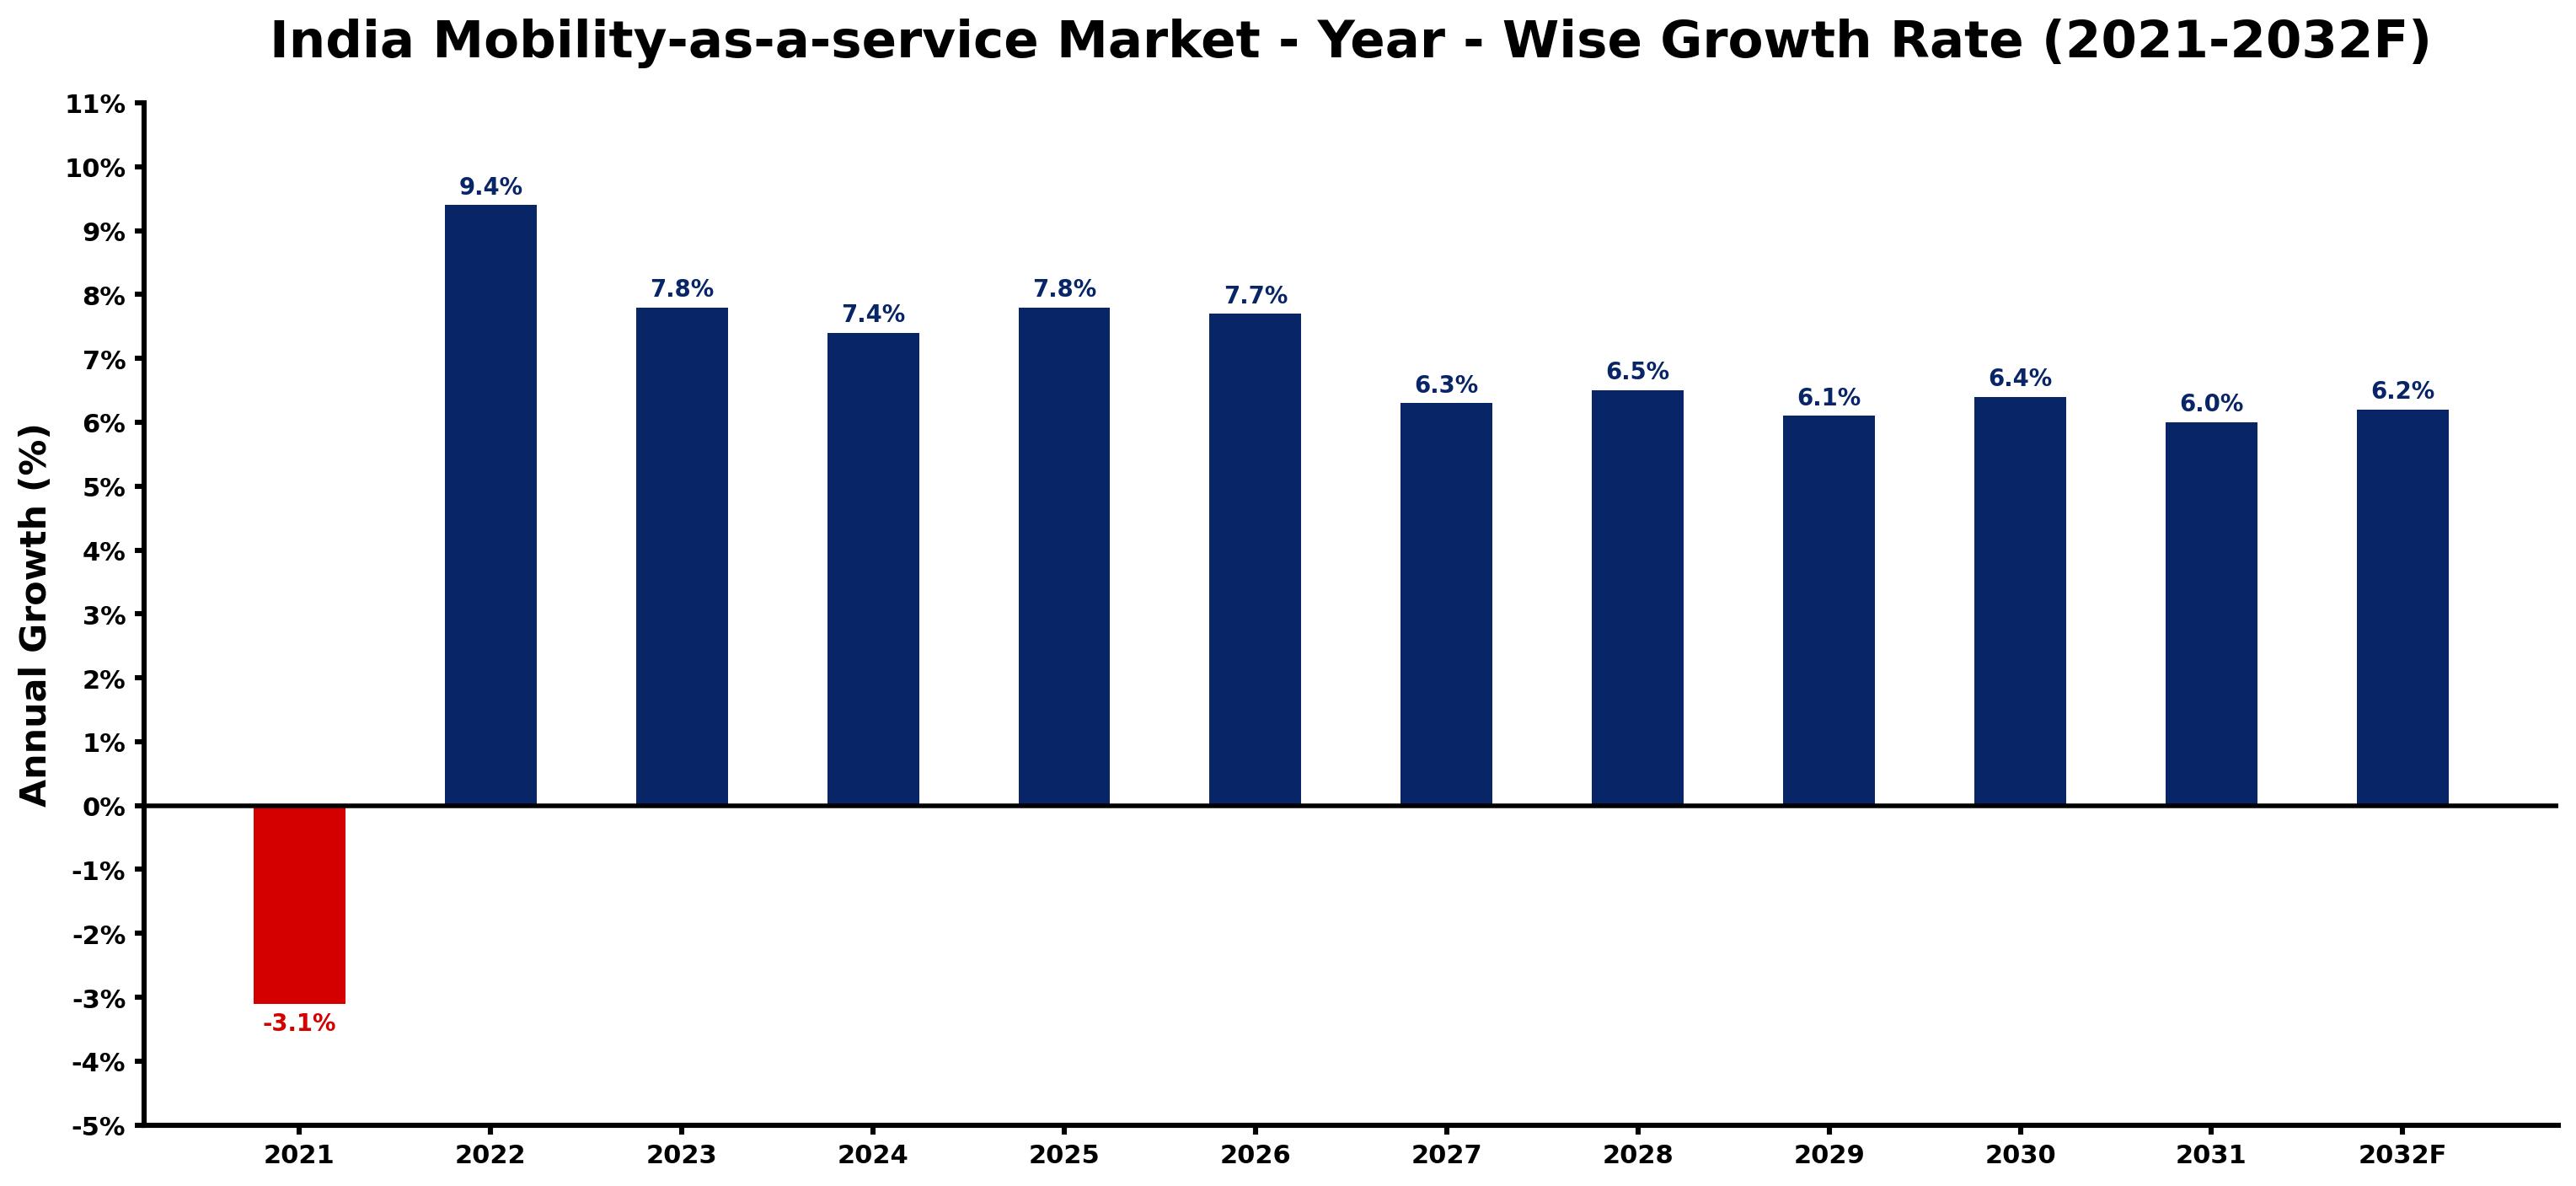
The table below presents the year‑wise growth rates along with the key drivers influencing the market
| Year | Growth Rate | Major Drivers |
| 2021 | -3.1% | Expansion of manufacturing activities |
| 2022 | 9.4% | Increasing smart city development projects |
| 2023 | 7.8% | Growing renewable energy integration projects |
| 2024 | 7.4% | Expansion of manufacturing activities |
| 2025 | 7.8% | Rapid growth in telecom and data center sectors |
| 2026 | 7.7% | Growing urbanization and commercial development |
| 2027 | 6.3% | Growing urbanization and commercial development |
| 2028 | 6.5% | Expansion of transportation and logistics networks |
| 2029 | 6.1% | Increasing industrial infrastructure investments |
| 2030 | 6.4% | Growing urbanization and commercial development |
| 2031 | 6.0% | Expansion of commercial construction activities |
| 2032 | 6.2% | Increasing smart city development projects |
Note - Market size estimations and growth projections presented in this report are based on 6Wresearch’s advanced forecasting approach, validated with industry datasets as of June 2026.
India Mobility-as-a-service Market Synopsis
The most significant force driving the India Mobility-as-a-service Market is the urgent need for last-mile connectivity solutions. Urbanization has outpaced infrastructure development, creating gaps in efficient public transport that MaaS providers are increasingly filling with shared mobility options.
Moreover, the growing penetration of smartphones and internet access plays a crucial role in shaping the market. Consumers are now more connected than ever, enabling MaaS platforms to provide personalized and real-time updates, ultimately enhancing the customer experience.
India Mobility-as-a-service Market Key Takeaways
- The MaaS market is undergoing rapid transformation driven by technology and urban demand.
- Integration of electric vehicles and government support is fueling market growth.
- Consumers are increasingly preferring digital solutions over traditional transport options.
- Safety and payment concerns remain challenges that require strategic addressing.
- Data analytics and AI are becoming integral to service delivery and operational efficiency.
Evaluation of Restraints in India Mobility-as-a-service Market
Despite the market's promising outlook, certain restraints hinder its growth potential. A significant challenge is the low awareness levels among potential consumers, who continue to rely on traditional transport means. Additionally, regulatory hurdles from various governing bodies impose inconsistencies that complicate the operational landscape for MaaS providers. Safety concerns surrounding digital payment methods can also deter users, requiring robust solutions to assure consumers of secure transactions.
India Mobility-as-a-service Market Trends
Current trends point towards data analytics driving decision-making processes for service providers. Companies are increasingly integrating AI-enabled features into their applications to enhance user experience. The focus on contactless payment options is growing, aligning with global shifts toward convenience and hygiene. Subscription-based models are also emerging, providing users with flexible travel solutions tailored to their needs. Lastly, partnerships between local authorities and service providers are increasing, paving the way for collaborative and integrated transportation ecosystems.
India Mobility-as-a-service Market Opportunities
The real growth opportunities in the Indian Mobility-as-a-service Market lie in expanding last-mile connectivity solutions and advancing the integration of electric vehicles. As cities evolve and smart initiatives gain traction, MaaS providers can capitalize on the shifting landscape by offering innovative, eco-friendly transportation options. Furthermore, investing in technology that enhances user interaction and service personalization will allow stakeholders to cater to the evolving consumer expectations and preferences.
Government Initiatives in the India Mobility-as-a-service Market
In recent years, the Indian government has rolled out various initiatives aimed at promoting sustainable urban mobility solutions. Key programs focus on the development of smart cities, which integrate technology and transport, paving the way for MaaS adoption. Investments in electric vehicles and related infrastructure are also on the rise, aligning with global sustainability trends. The government’s push for innovation in transportation further supports startups and established players dedicated to improving the MaaS landscape.
Future Insights of the India Mobility-as-a-service Market
Looking ahead to 2026-2032, the India Mobility-as-a-service Market is poised for substantial advancements driven by technology and infrastructure enhancements. Increased urbanization will necessitate even more integrated transport solutions, making MaaS not just a choice but a necessity for urban commuters. As safety and regulatory frameworks improve, along with consumer acceptance, the market can expect accelerated growth, transforming how people navigate their urban environments.
India Mobility-as-a-service Market Latest Developments (May 2025 - June 2026)
In recent months, the focus has shifted towards integrating more eco-friendly options within the Mobility-as-a-service framework. Enhanced partnerships between technology providers and local governments are being established to streamline service delivery. Innovative subscription-based models are gaining traction as users seek convenience and flexibility. Additionally, there is a notable increase in the adoption of AI and machine learning to provide enhanced analytics and user experiences, positioning the MaaS market for transformative growth.
India Mobility-as-a-service Market - Key Attractiveness of the Report
- 10 Years of Market Numbers
- Historical Data Starting from 2022 to 2025
- Base Year: 2025
- Forecast Data until 2032
- Key Performance Indicators Impacting the Market
- Major Upcoming Developments and Projects
Key Highlights of the Report:
- India Mobility-as-a-service Market Outlook
- Market Size of India Mobility-as-a-service Market, 2025
- Forecast of India Mobility-as-a-service Market, 2032
- Historical Data and Forecast of India Mobility-as-a-service Revenues & Volume for the Period 2022-2032F
- India Mobility-as-a-service Market Trend Evolution
- India Mobility-as-a-service Market Drivers and Challenges
- India Mobility-as-a-service Price Trends
- India Mobility-as-a-service Porter's Five Forces
- India Mobility-as-a-service Industry Life Cycle
- Historical Data and Forecast of India Mobility-as-a-service Market Revenues & Volume By Solution Type for the Period 2022-2032F
- Historical Data and Forecast of India Mobility-as-a-service Market Revenues & Volume By Technology Platform for the Period 2022-2032F
- Historical Data and Forecast of India Mobility-as-a-service Market Revenues & Volume By Insurance Services for the Period 2022-2032F
- Historical Data and Forecast of India Mobility-as-a-service Market Revenues & Volume By Telecom Connectivity Providers for the Period 2022-2032F
- Historical Data and Forecast of India Mobility-as-a-service Market Revenues & Volume By Payment Engines for the Period 2022-2032F
- Historical Data and Forecast of India Mobility-as-a-service Market Revenues & Volume By Ticketing Solutions for the Period 2022-2032F
- Historical Data and Forecast of India Mobility-as-a-service Market Revenues & Volume By Navigation Solutions for the Period 2022-2032F
- Historical Data and Forecast of India Mobility-as-a-service Market Revenues & Volume By Service Type for the Period 2022-2032F
- Historical Data and Forecast of India Mobility-as-a-service Market Revenues & Volume By Ride Hailing for the Period 2022-2032F
- Historical Data and Forecast of India Mobility-as-a-service Market Revenues & Volume By Car Sharing for the Period 2022-2032F
- Historical Data and Forecast of India Mobility-as-a-service Market Revenues & Volume By Micromobility for the Period 2022-2032F
- Historical Data and Forecast of India Mobility-as-a-service Market Revenues & Volume By Bus Sharing for the Period 2022-2032F
- Historical Data and Forecast of India Mobility-as-a-service Market Revenues & Volume By Train Services for the Period 2022-2032F
- Historical Data and Forecast of India Mobility-as-a-service Market Revenues & Volume By Transportation Type for the Period 2022-2032F
- Historical Data and Forecast of India Mobility-as-a-service Market Revenues & Volume By Public for the Period 2022-2032F
- Historical Data and Forecast of India Mobility-as-a-service Market Revenues & Volume By Private for the Period 2022-2032F
- Historical Data and Forecast of India Mobility-as-a-service Market Revenues & Volume By Vehicle Type for the Period 2022-2032F
- Historical Data and Forecast of India Mobility-as-a-service Market Revenues & Volume By Micro mobility for the Period 2022-2032F
- Historical Data and Forecast of India Mobility-as-a-service Market Revenues & Volume By Trains for the Period 2022-2032F
- Historical Data and Forecast of India Mobility-as-a-service Market Revenues & Volume By Buses for the Period 2022-2032F
- Historical Data and Forecast of India Mobility-as-a-service Market Revenues & Volume By Four-wheelers for the Period 2022-2032F
- Historical Data and Forecast of India Mobility-as-a-service Market Revenues & Volume By Application Type for the Period 2022-2032F
- Historical Data and Forecast of India Mobility-as-a-service Market Revenues & Volume By Personalized Application Services for the Period 2022-2032F
- Historical Data and Forecast of India Mobility-as-a-service Market Revenues & Volume By Journey Management for the Period 2022-2032F
- Historical Data and Forecast of India Mobility-as-a-service Market Revenues & Volume By Journey Planning for the Period 2022-2032F
- Historical Data and Forecast of India Mobility-as-a-service Market Revenues & Volume By Flexible Payments and Transactions for the Period 2022-2032F
- Historical Data and Forecast of India Mobility-as-a-service Market Revenues & Volume By Operating System for the Period 2022-2032F
- Historical Data and Forecast of India Mobility-as-a-service Market Revenues & Volume By Android for the Period 2022-2032F
- Historical Data and Forecast of India Mobility-as-a-service Market Revenues & Volume By iOS for the Period 2022-2032F
- Historical Data and Forecast of India Mobility-as-a-service Market Revenues & Volume By Others for the Period 2022-2032F
- India Mobility-as-a-service Import Export Trade Statistics
- Market Opportunity Assessment By Solution Type
- Market Opportunity Assessment By Service Type
- Market Opportunity Assessment By Transportation Type
- Market Opportunity Assessment By Vehicle Type
- Market Opportunity Assessment By Application Type
- Market Opportunity Assessment By Operating System
- India Mobility-as-a-service Top Companies Market Share
- India Mobility-as-a-service Competitive Benchmarking By Technical and Operational Parameters
- India Mobility-as-a-service Company Profiles
- India Mobility-as-a-service Key Strategic Recommendations
India Mobility-as-a-service Market - Frequently Asked Questions
The market is being driven by increasing urbanization, the need for efficient last-mile connectivity, and the growing integration of technology into transportation solutions.
The India Mobility-as-a-service Market was estimated at USD 781 Million in 2025 and is projected to reach USD 1120 Million by 2032, growing at a CAGR of 5.3% from 2026 to 2032.
Government initiatives aimed at promoting smart cities and electric vehicles are crucial in paving the way for MaaS adoption. These programs create a supportive environment for both innovation and investment.
Low consumer awareness remains a significant challenge, as many individuals still prefer traditional transport options. Raising awareness about the benefits and conveniences of MaaS is crucial for market expansion.
Key technology trends include the adoption of AI for service personalization, increased use of data analytics for decision-making, and the growth of subscription-based models aimed at providing flexible transport solutions.
6Wresearch actively monitors the India Mobility-as-a-service Market and publishes its comprehensive annual report, highlighting emerging trends, growth drivers, revenue analysis, and forecast outlook. Our insights help businesses to make data-backed strategic decisions with ongoing market dynamics. Our analysts track relevent industries related to the India Mobility-as-a-service Market, allowing our clients with actionable intelligence and reliable forecasts tailored to emerging regional needs.
Yes, we provide customisation as per your requirements. To learn more, feel free to contact us on sales@6wresearch.com
1 Executive Summary |
2 Introduction |
2.1 Key Highlights of the Report |
2.2 Report Description |
2.3 Market Scope & Segmentation |
2.4 Research Methodology |
2.5 Assumptions |
3 India Mobility-as-a-service Market Overview |
3.1 India Country Macro Economic Indicators |
3.2 India Mobility-as-a-service Market Revenues & Volume, 2022 & 2032F |
3.3 India Mobility-as-a-service Market - Industry Life Cycle |
3.4 India Mobility-as-a-service Market - Porter's Five Forces |
3.5 India Mobility-as-a-service Market Revenues & Volume Share, By Solution Type, 2022 & 2032F |
3.6 India Mobility-as-a-service Market Revenues & Volume Share, By Service Type, 2022 & 2032F |
3.7 India Mobility-as-a-service Market Revenues & Volume Share, By Transportation Type, 2022 & 2032F |
3.8 India Mobility-as-a-service Market Revenues & Volume Share, By Vehicle Type, 2022 & 2032F |
3.9 India Mobility-as-a-service Market Revenues & Volume Share, By Application Type, 2022 & 2032F |
3.10 India Mobility-as-a-service Market Revenues & Volume Share, By Operating System, 2022 & 2032F |
4 India Mobility-as-a-service Market Dynamics |
4.1 Impact Analysis |
4.2 Market Drivers |
4.2.1 Increasing urbanization and congestion in major Indian cities leading to a higher demand for efficient mobility solutions. |
4.2.2 Growing smartphone penetration and internet connectivity, enabling easier access to mobility services. |
4.2.3 Government initiatives promoting sustainable transportation options and digital infrastructure development. |
4.3 Market Restraints |
4.3.1 Lack of last-mile connectivity and integration between different modes of transport. |
4.3.2 Concerns over data privacy and cybersecurity hindering the adoption of mobility-as-a-service. |
4.3.3 Regulatory challenges and policy inconsistencies impacting the implementation and scalability of MaaS solutions. |
5 India Mobility-as-a-service Market Trends |
6 India Mobility-as-a-service Market, By Types |
6.1 India Mobility-as-a-service Market, By Solution Type |
6.1.1 Overview and Analysis |
6.1.2 India Mobility-as-a-service Market Revenues & Volume, By Solution Type, 2022-2032F |
6.1.3 India Mobility-as-a-service Market Revenues & Volume, By Technology Platform, 2022-2032F |
6.1.4 India Mobility-as-a-service Market Revenues & Volume, By Insurance Services, 2022-2032F |
6.1.5 India Mobility-as-a-service Market Revenues & Volume, By Telecom Connectivity Providers, 2022-2032F |
6.1.6 India Mobility-as-a-service Market Revenues & Volume, By Payment Engines, 2022-2032F |
6.1.7 India Mobility-as-a-service Market Revenues & Volume, By Ticketing Solutions, 2022-2032F |
6.1.8 India Mobility-as-a-service Market Revenues & Volume, By Navigation Solutions, 2022-2032F |
6.2 India Mobility-as-a-service Market, By Service Type |
6.2.1 Overview and Analysis |
6.2.2 India Mobility-as-a-service Market Revenues & Volume, By Ride Hailing, 2022-2032F |
6.2.3 India Mobility-as-a-service Market Revenues & Volume, By Car Sharing, 2022-2032F |
6.2.4 India Mobility-as-a-service Market Revenues & Volume, By Micromobility, 2022-2032F |
6.2.5 India Mobility-as-a-service Market Revenues & Volume, By Bus Sharing, 2022-2032F |
6.2.6 India Mobility-as-a-service Market Revenues & Volume, By Train Services, 2022-2032F |
6.3 India Mobility-as-a-service Market, By Transportation Type |
6.3.1 Overview and Analysis |
6.3.2 India Mobility-as-a-service Market Revenues & Volume, By Public, 2022-2032F |
6.3.3 India Mobility-as-a-service Market Revenues & Volume, By Private , 2022-2032F |
6.4 India Mobility-as-a-service Market, By Vehicle Type |
6.4.1 Overview and Analysis |
6.4.2 India Mobility-as-a-service Market Revenues & Volume, By Micro mobility, 2022-2032F |
6.4.3 India Mobility-as-a-service Market Revenues & Volume, By Trains, 2022-2032F |
6.4.4 India Mobility-as-a-service Market Revenues & Volume, By Buses, 2022-2032F |
6.4.5 India Mobility-as-a-service Market Revenues & Volume, By Four-wheelers, 2022-2032F |
6.5 India Mobility-as-a-service Market, By Application Type |
6.5.1 Overview and Analysis |
6.5.2 India Mobility-as-a-service Market Revenues & Volume, By Personalized Application Services, 2022-2032F |
6.5.3 India Mobility-as-a-service Market Revenues & Volume, By Journey Management, 2022-2032F |
6.5.4 India Mobility-as-a-service Market Revenues & Volume, By Journey Planning, 2022-2032F |
6.5.5 India Mobility-as-a-service Market Revenues & Volume, By Flexible Payments and Transactions, 2022-2032F |
6.6 India Mobility-as-a-service Market, By Operating System |
6.6.1 Overview and Analysis |
6.6.2 India Mobility-as-a-service Market Revenues & Volume, By Android, 2022-2032F |
6.6.3 India Mobility-as-a-service Market Revenues & Volume, By iOS, 2022-2032F |
6.6.4 India Mobility-as-a-service Market Revenues & Volume, By Others, 2022-2032F |
7 India Mobility-as-a-service Market Import-Export Trade Statistics |
7.1 India Mobility-as-a-service Market Export to Major Countries |
7.2 India Mobility-as-a-service Market Imports from Major Countries |
8 India Mobility-as-a-service Market Key Performance Indicators |
8.1 Average daily active users on MaaS platforms. |
8.2 Percentage increase in partnerships between MaaS providers and public transportation agencies. |
8.3 Customer satisfaction scores related to the ease of use and reliability of MaaS services. |
8.4 Number of cities covered by MaaS platforms. |
8.5 Average time saved by users when utilizing MaaS options compared to traditional transportation methods. |
9 India Mobility-as-a-service Market - Opportunity Assessment |
9.1 India Mobility-as-a-service Market Opportunity Assessment, By Solution Type, 2022 & 2032F |
9.2 India Mobility-as-a-service Market Opportunity Assessment, By Service Type, 2022 & 2032F |
9.3 India Mobility-as-a-service Market Opportunity Assessment, By Transportation Type, 2022 & 2032F |
9.4 India Mobility-as-a-service Market Opportunity Assessment, By Vehicle Type, 2022 & 2032F |
9.5 India Mobility-as-a-service Market Opportunity Assessment, By Application Type, 2022 & 2032F |
9.6 India Mobility-as-a-service Market Opportunity Assessment, By Operating System, 2022 & 2032F |
10 India Mobility-as-a-service Market - Competitive Landscape |
10.1 India Mobility-as-a-service Market Revenue Share, By Companies, 2025 |
10.2 India Mobility-as-a-service Market Competitive Benchmarking, By Operating and Technical Parameters |
11 Company Profiles |
12 Recommendations |
13 Disclaimer |
Global Go To Market Strategy - 2030
Export potential enables firms to identify high-growth global markets with greater confidence by combining advanced trade intelligence with a structured quantitative methodology. The framework analyzes emerging demand trends and country-level import patterns while integrating macroeconomic and trade datasets such as GDP and population forecasts, bilateral import–export flows, tariff structures, elasticity differentials between developed and developing economies, geographic distance, and import demand projections. Using weighted trade values from 2020–2024 as the base period to project country-to-country export potential for 2030, these inputs are operationalized through calculated drivers such as gravity model parameters, tariff impact factors, and projected GDP per-capita growth. Through an analysis of hidden potentials, demand hotspots, and market conditions that are most favorable to success, this method enables firms to focus on target countries, maximize returns, and global expansion with data, backed by accuracy.
By factoring in the projected importer demand gap that is currently unmet and could be potential opportunity, it identifies the potential for the Exporter (Country) among 190 countries, against the general trade analysis, which identifies the biggest importer or exporter.
To discover high-growth global markets and optimize your business strategy:
Click Here
Pricing
- Single User License$ 1,995
- Department License$ 2,400
- Site License$ 3,120
- Global License$ 3,795

Leadership Perspectives from Industry Events
Search
Thought Leadership and Analyst Meet


Our Clients
6WResearch In News
- India Air Conditioner Market Set for Strong Rebound in 2026 After Weather-Led Correction and GST-Driven Recovery: 6Wresearch
- ADAS in India: How Automatic Emergency Braking, Blind Spot Detection & Driver Monitoring are Transforming Road Safety
- Doha a strategic location for EV manufacturing hub: IPA Qatar
- Demand for luxury TVs surging in the GCC, says Samsung
- Empowering Growth: The Thriving Journey of Bangladesh’s Cable Industry
- Demand for luxury TVs surging in the GCC, says Samsung
Latest Reports
- Nicaragua RPG Gaming Market (2026-2032)
- New Zealand RPG Gaming Market (2026-2032)
- Netherlands RPG Gaming Market (2026-2032)
- Nauru RPG Gaming Market (2026-2032)
- Namibia RPG Gaming Market (2026-2032)
- Mozambique RPG Gaming Market (2026-2032)
- Montenegro RPG Gaming Market (2026-2032)
- Mongolia RPG Gaming Market (2026-2032)
- Monaco RPG Gaming Market (2026-2032)
- Micronesia RPG Gaming Market (2026-2032)
Industry Events and Analyst Meet

EV India Expo 2026

HIMTEX 2026

India Refining Summit 2026

India EV Show 2026

EV tech India Expo 2026
Whitepaper
- Middle East & Africa Commercial Security Market Click here to view more.
- Middle East & Africa Fire Safety Systems & Equipment Market Click here to view more.
- GCC Drone Market Click here to view more.
- Middle East Lighting Fixture Market Click here to view more.
- GCC Physical & Perimeter Security Market Click here to view more.