India Thermal Imaging Market Outlook (2023-2029) | COVID-19 IMPACT, Trends, Growth, Value, Analysis, Size, Revenue, Forecast, Industry, Share & Companies
Market Forecast By Technology (Uncooled, Cooled),By Form Factor (Fixed-Mounted, Handheld),By Applications (Security and Surveillance, Testing, Detection & Firefighting, Other Applications (Human, Wildlife Animal Safety, Transportation)), By Verticals (Defense/Military, Commercial, Industrial),By Region (Northern, Western, Eastern, Southern)And Competitive Landscape
| Product Code: ETC4457425 | Publication Date: Jul 2023 | Updated Date: Aug 2025 | Product Type: Report | |
| Publisher: 6Wresearch | Author: Ravi Bhandari | No. of Pages: 85 | No. of Figures: 45 | No. of Tables: 25 |
India Thermal Imaging Market Synopsis
India Thermal Imaging market has grown significantly during the past years on account of initiatives such as the Production Linked Incentive scheme, the Make in India initiative along with an increase in defense spending and government support towards the industrial sector. Moreover, the market registered positive growth during the year COVID-19 pandemic as thermal cameras were used widely to detect human body temperature across airports, public spaces, and businesses as these were deployed for temperature screening and monitoring purposes to counter the spread of COVID-19. Moreover, in 2021, the revenue increased as thermal imaging technology played a crucial role in helping businesses and organizations implement infection control measures and enforce social distancing protocols.
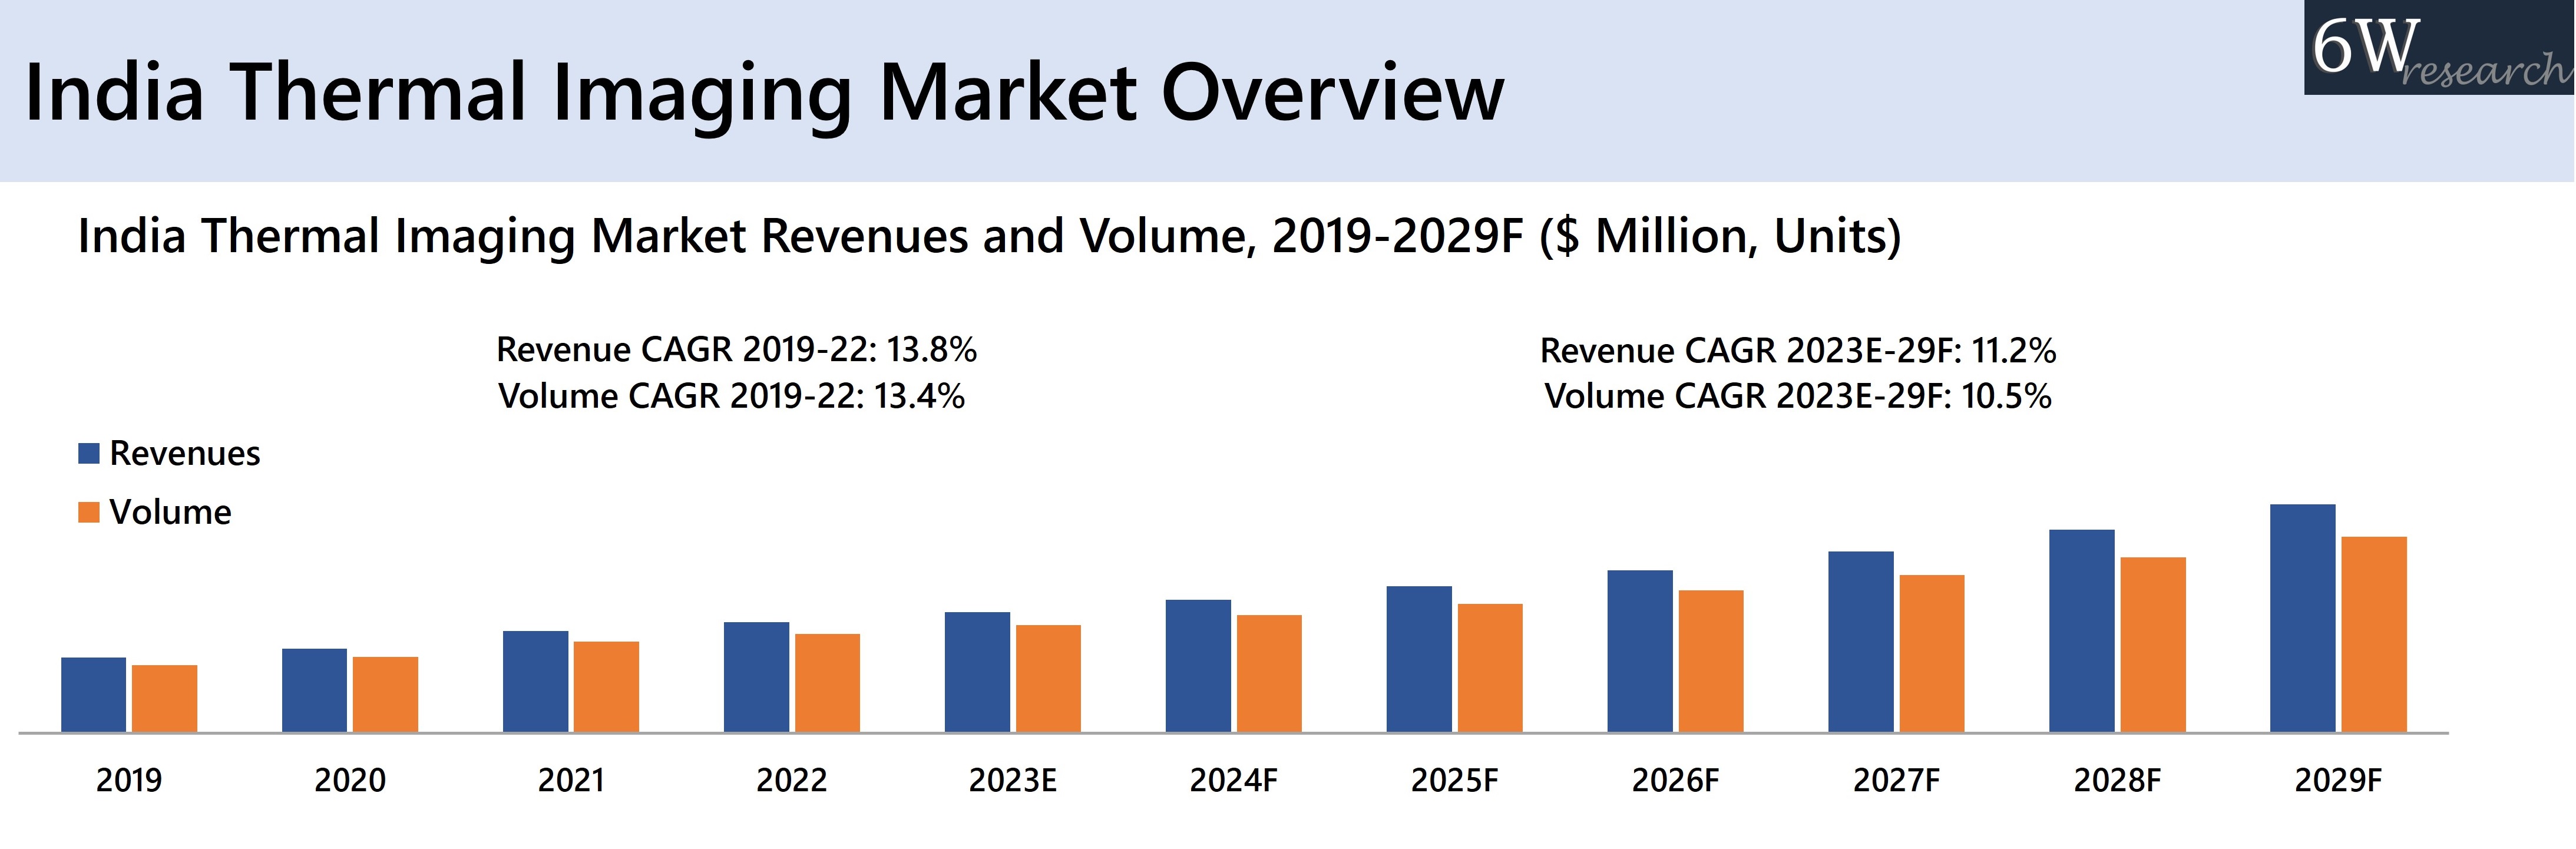
According to 6Wresearch, the India Thermal Imaging market size is projected to grow at a CAGR of 11.2% during 2023–2029F. The market is expected to witness growth in the coming years owing to the rising adoption of advanced thermal imaging cameras in the military and defense industry for night patrolling and combat operations which would boost the market growth. Moreover, the manufacturing sector of India has the potential to reach $1 trillion by the year 2025, which would boost the demand for thermal imaging in different industries such as petrochemicals, oil & gas, power utilities, and others across India. Moreover, the energy demand of India is anticipated to grow faster on the back of continuous economic growth, in addition to the rise in global primary energy consumption is projected to increase two-fold by 2035, thereby contributing to the rise in demand for thermal imaging cameras in these industries.
Market by Technology
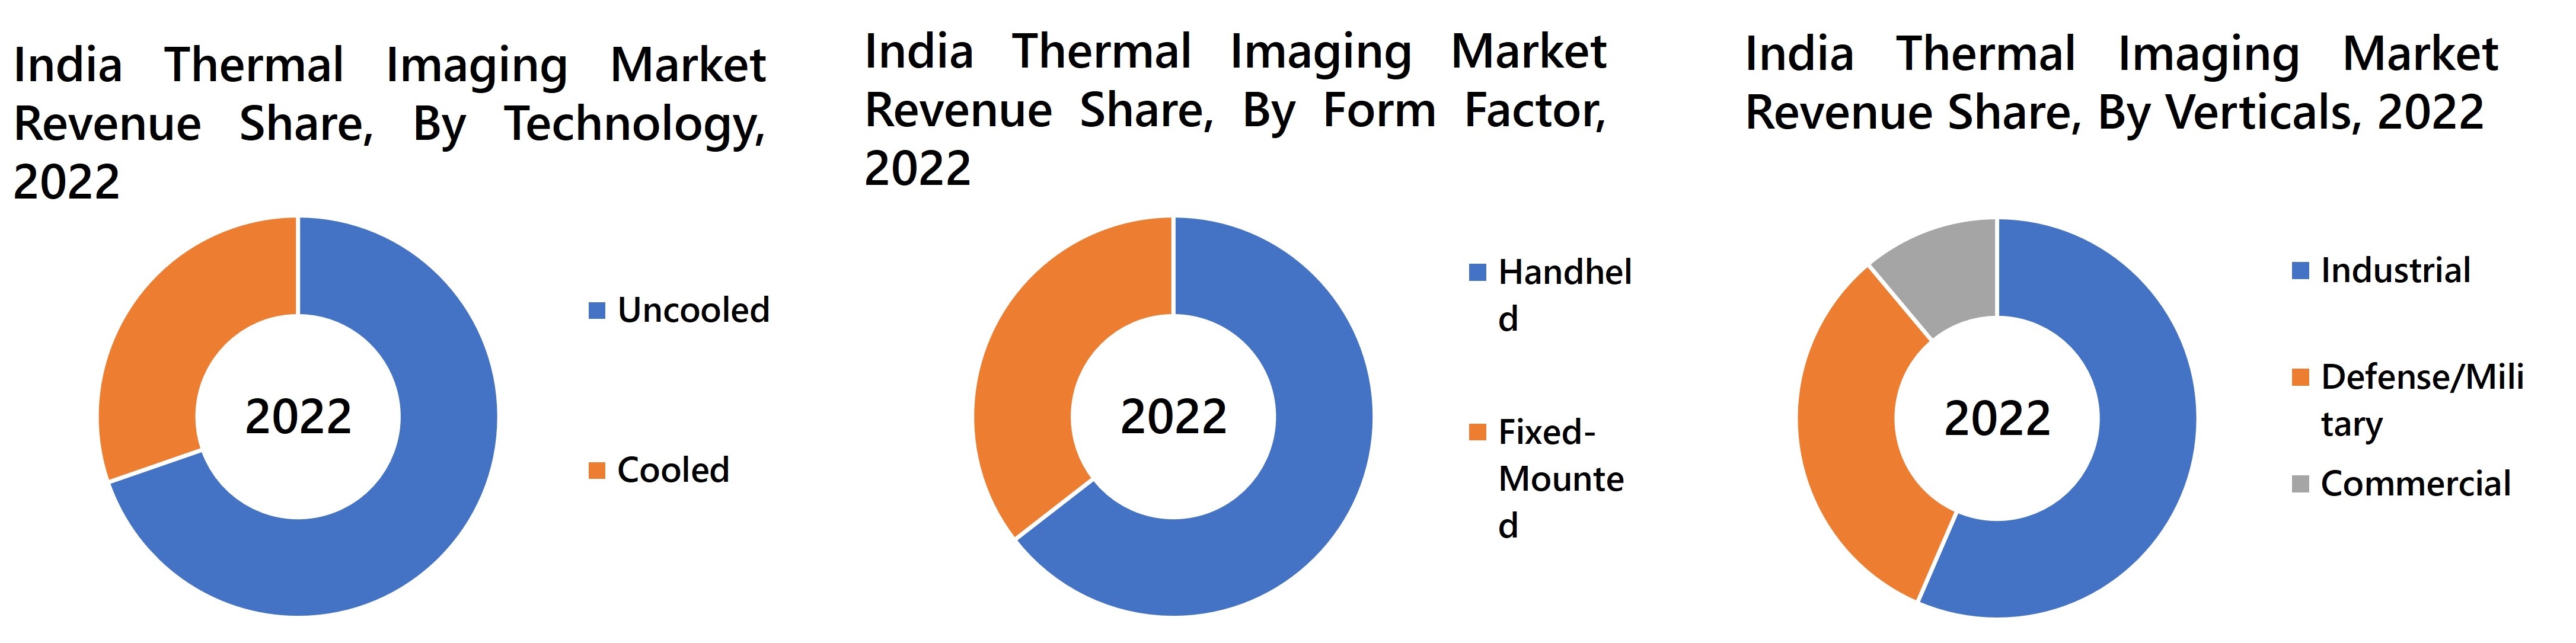
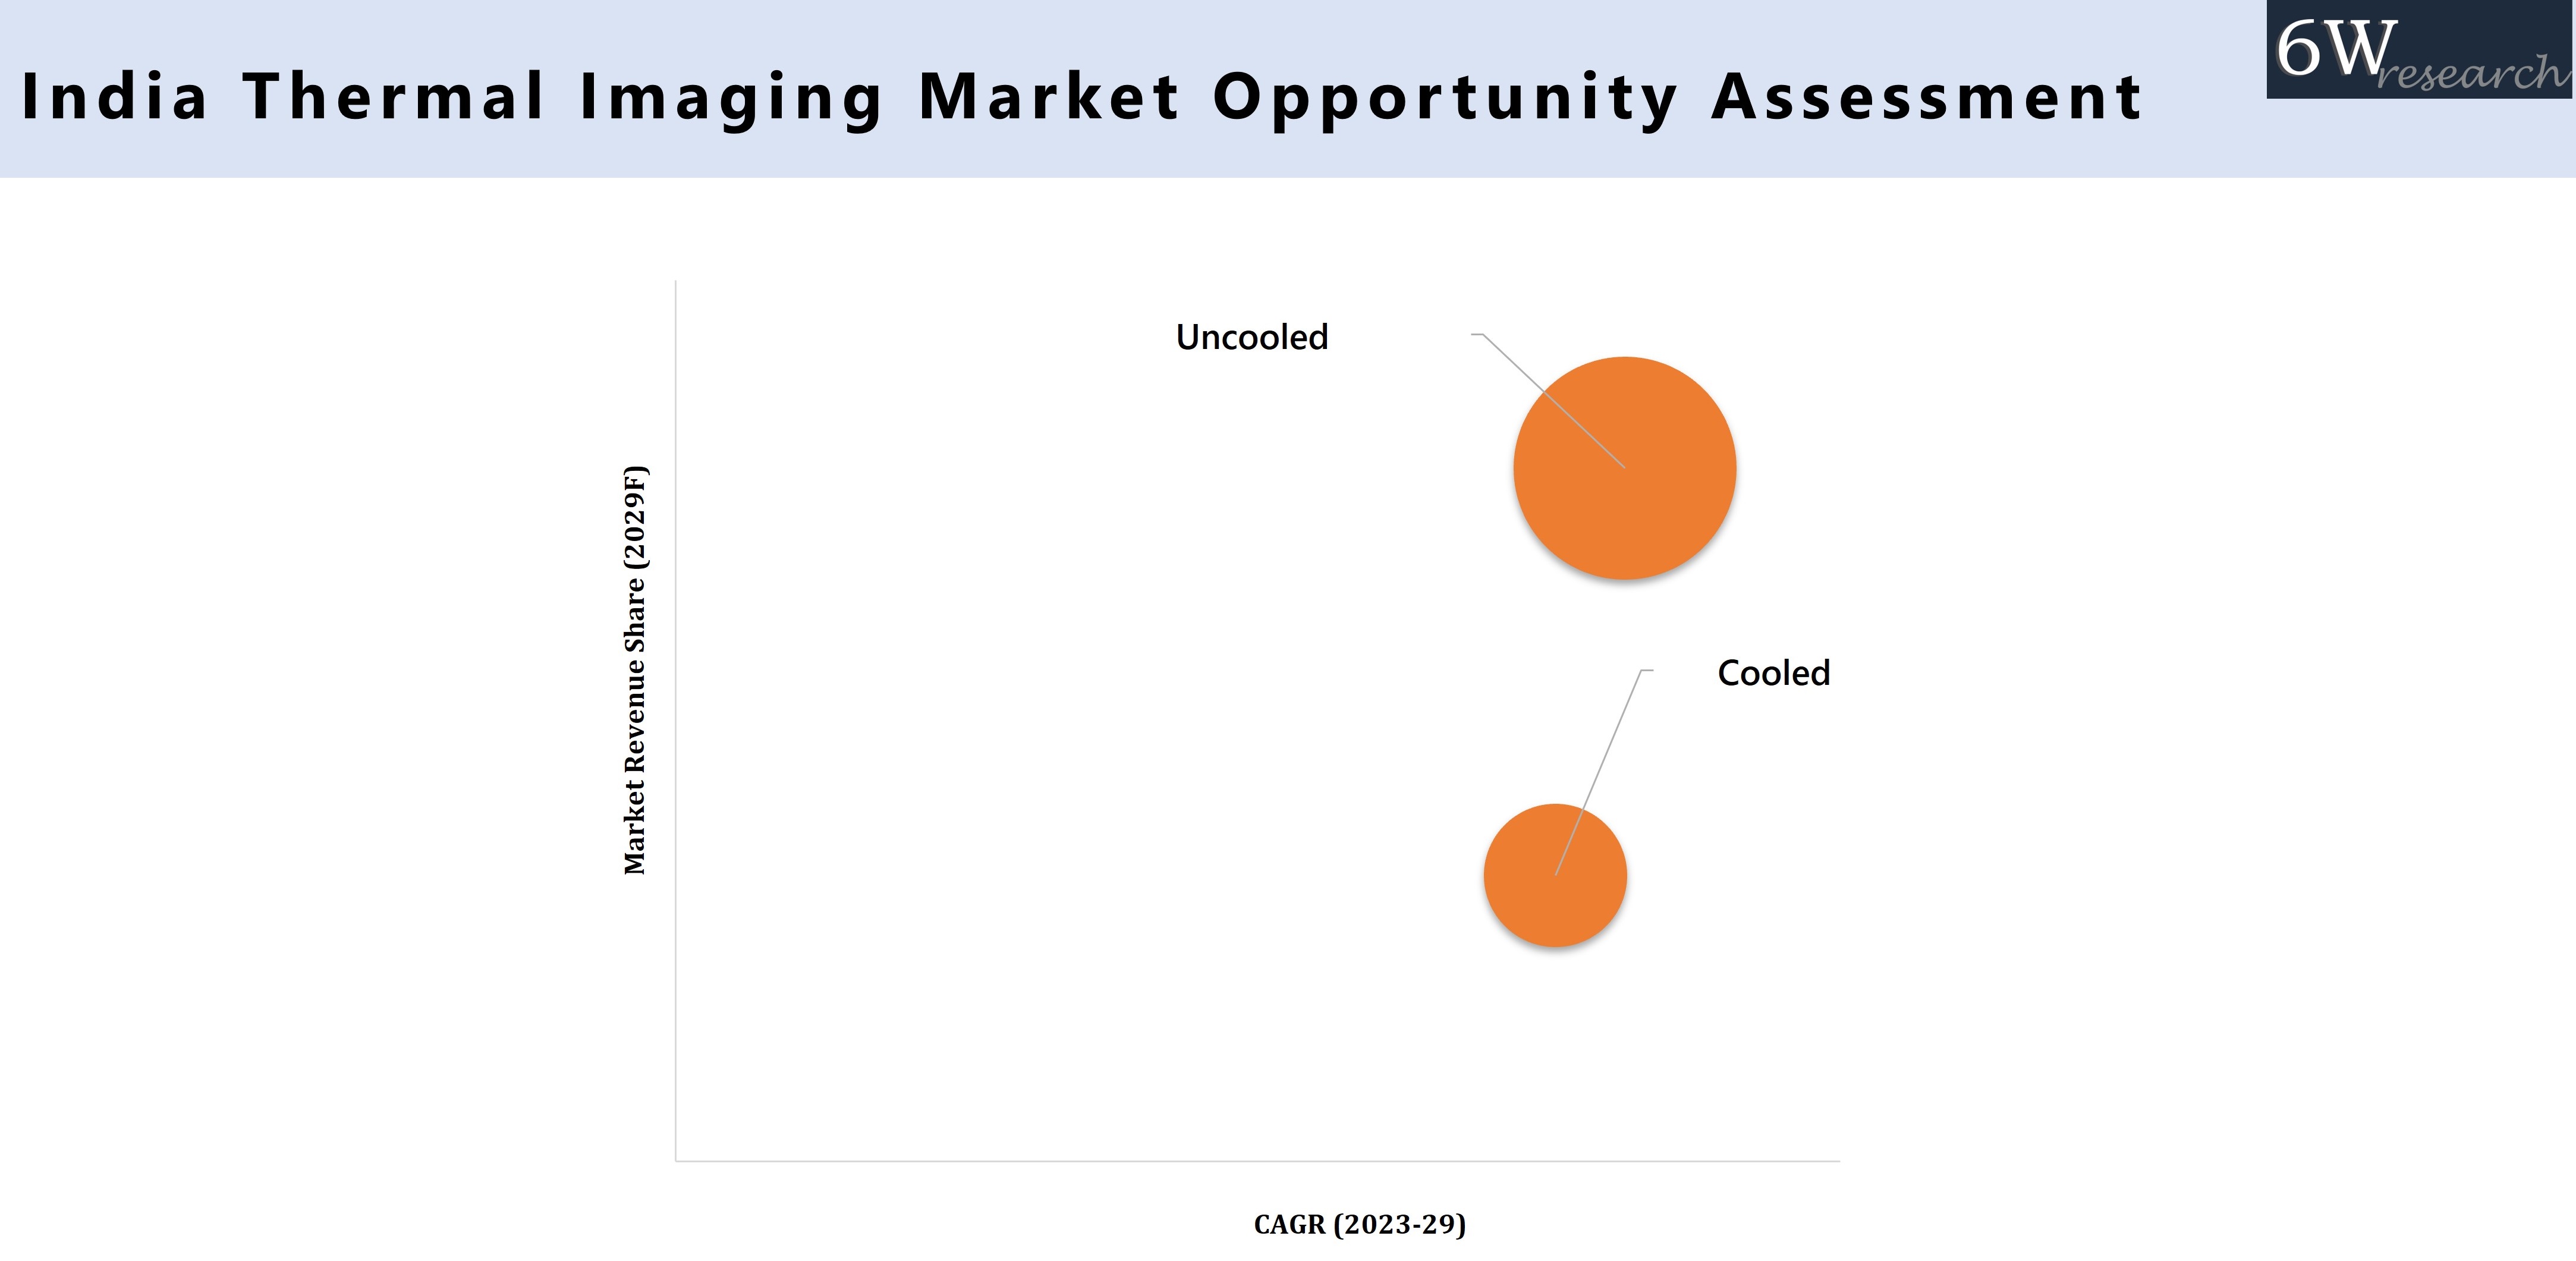
In 2022, Uncooled technology accounted for a major revenue share in the India Thermal Imaging Market owing to its cost-effectiveness, and the uncooled thermal camera is stabilized at or close to room temperature, using less complicated temperature control elements. For instance, uncooled technology is widely used for medical monitoring, and government initiatives such as spending of $200 billion is expected to be spent by the year 2024 for medical infrastructure, thereby creating demand for uncooled technology in the forthcoming years.
Market by Form Factor
Handheld thermal imagers are widely used in electrical inspections, mechanical inspections, building diagnostics, and firefighting applications. Moreover, the increase in the use of handheld thermal imagers for the detection of body temperature, and to target treatment interventions, such as physical therapy, pain medication, or localized therapies, would boost demand for handheld in the future.
Market by Applications
In 2022, Security and Surveillance acquired a major revenue share in 2022 India thermal imaging market on account of an increase in border surveillance, marine surveillance, and deployment of thermal imaging cameras for security at airports. Moreover, the rise in defense spending which increased to around 13% from the previous year would contribute to demand for thermal imagers in security and surveillance.
Market by Verticals
In 2022, the Industrial sector acquired a major revenue share in India thermal imaging market owing to growing government initiatives such as Make in India, Startup India, and Production Linked Incentive scheme which has led to a surge in the manufacturing output of the country. Moreover, rise in government initiatives and investments such as in Budget 2022-2023, the government allocated Rs. 7,327 crores for the solar power sector including grid, off-grid, and PM-KUSUM projects, thereby contributing to demand for thermal imaging across the industry.
Market by Region
In 2022, the Northern region acquired a major revenue share in India thermal imaging market and the same trend will continue in the future due to the higher use of thermal cameras for surveillance purposes across northern states such as border areas of Jammu and Kashmir. Moreover, industrial clusters such as the Gurugram-Bhiwadi-Neemrana Corridor, Delhi-Mumbai Industrial Corridor, Noida - Greater Noida – Yamuna Electronics Manufacturing Zone, contribute to the demand for thermal imaging across the northern region.
Key Attractiveness of the Report
- COVID-19 Impact on the Market.
- 11 Years Market Numbers.
- Historical Data Starting from 2019 to 2022.
- Base Year: 2022
- Forecast Data until 2029.
- Key Performance Indicators Impacting the Market.
- Major Upcoming Developments and Projects.
Key Highlights of the Report:
- India Thermal Imaging Market Overview
- India Thermal Imaging Market Outlook
- India Thermal Imaging Market Forecast
- Historical Data and Forecast of India Thermal Imaging Market Revenues and Volume, for the Period 2019-2029F
- Historical Data and Forecast of India Thermal Imaging Market Revenues and Volume, By Technology, for the Period 2019-2029F
- Historical Data and Forecast of India Thermal Imaging Market Revenues and Volume, By Form Factor, for the Period 2019-2029F
- Historical Data and Forecast of India Thermal Imaging Market Revenues and Volume, By Applications, for the Period 2019-2029F
- Historical Data and Forecast of India Thermal Imaging Market Revenues and Volume, By Verticals, for the Period 2019-2029F
- Historical Data and Forecast of India Thermal Imaging Market Revenues, By Regions, for the Period 2019-2029F
- Market Opportunity Assessment
- Market Drivers and Restraints
- Market Trends
- Competitive Benchmarking
- Key Strategic Recommendations
Market Scope and Segmentation
Thereportprovides a detailed analysis of the following market segments:
By Technology
- Uncooled
- Cooled
By Form Factor
- Fixed-Mounted
- Handheld
By Applications
- Security and Surveillance
- Testing, Detection & Firefighting
- Other Applications (Human, Wildlife Animal Safety, Transportation)
By Verticals
- Defense/Military
- Commercial
- Industrial
By Region
- Northern
- Western
- Eastern
- Southern
India Thermal Imaging Market: FAQs
The India Thermal Imaging market size is projected to grow at a CAGR of 11.2% during 2023–2029F.
The market is expected to witness growth in the coming years owing to the rising adoption of advanced thermal imaging cameras in the military and defense industry for night patrolling and combat operations which would boost the market growth.
The handheld thermal imager segment by form factor will grow more in demand in the near future.
Segments that are covered in the market report are by technology, form factor, applications, verticals, and region.
6Wresearch actively monitors the India Thermal Imaging Market and publishes its comprehensive annual report, highlighting emerging trends, growth drivers, revenue analysis, and forecast outlook. Our insights help businesses to make data-backed strategic decisions with ongoing market dynamics. Our analysts track relevent industries related to the India Thermal Imaging Market, allowing our clients with actionable intelligence and reliable forecasts tailored to emerging regional needs.
Yes, we provide customisation as per your requirements. To learn more, feel free to contact us on sales@6wresearch.com
| 1. Executive Summary |
| 2. Introduction |
| 2.1 Report Description |
| 2.2 Key Highlights of the Report |
| 2.3 Market Scope & Segmentation |
| 2.4 Research Methodology |
| 2.5 Assumptions |
| 3. Global Thermal Imaging Market Overview |
| 3.1 Global Thermal Imaging Market Revenues, 2019-2029F |
| 3.2 America Thermal Imaging Market Revenues and Revenue Share, 2019-2029F |
| 3.2.1 America Thermal Imaging Market Revenues and Revenue Share, By Technology, 2019-2029F |
| 3.2.1.1 America Thermal Imaging Market Revenues and Revenue Share, By Cooled, 2019-2029F |
| 3.2.1.2 America Thermal Imaging Market Revenues and Revenue Share, By Uncooled, 2019-2029F |
| 3.2.2 America Thermal Imaging Market Revenues and Revenue Share, By Form Factor, 2019-2029F |
| 3.2.2.1 America Thermal Imaging Market Revenues and Revenue Share, By Fixed-Mounted , 2019-2029F |
| 3.2.2.2 America Thermal Imaging Market Revenues and Revenue Share, By Handheld, 2019-2029F |
| 3.3 Europe Thermal Imaging Market Revenues and Revenue Share, 2019-2029F |
| 3.3.1 Europe Thermal Imaging Market Revenues and Revenue Share, By Technology, 2019-2029F |
| 3.3.1.1 Europe Thermal Imaging Market Revenues and Revenue Share, By Cooled, 2019-2029F |
| 3.3.1.2 Europe Thermal Imaging Market Revenues and Revenue Share, By Uncooled, 2019-2029F |
| 3.3.2 Europe Thermal Imaging Market Revenues and Revenue Share, By Form Factor, 2019-2029F |
| 3.3.2.1 Europe Thermal Imaging Market Revenues and Revenue Share, By Fixed-Mounted , 2019-2029F |
| 3.3.2.2 Europe Thermal Imaging Market Revenues and Revenue Share, By Handheld, 2019-2029F |
| 3.4 Asia Pacific Thermal Imaging Market Revenues and Revenue Share, 2019-2029F |
| 3.4.1 Asia Pacific Thermal Imaging Market Revenues and Revenue Share, By Technology, 2019-2029F |
| 3.4.1.1 Asia Pacific Thermal Imaging Market Revenues and Revenue Share, By Cooled, 2019-2029F |
| 3.4.1.2 Asia Pacific Thermal Imaging Market Revenues and Revenue Share, By Uncooled, 2019-2029F |
| 3.4.2 Asia Pacific Thermal Imaging Market Revenues and Revenue Share, By Form Factor, 2019-2029F |
| 3.4.2.1 Asia Pacific Thermal Imaging Market Revenues and Revenue Share, By Fixed-Mounted , 2019-2029F |
| 3.4.2.2 Asia Pacific Thermal Imaging Market Revenues and Revenue Share, By Handheld, 2019-2029F |
| 3.5 Middle East and Africa Thermal Imaging Market Revenues and Revenue Share, 2019-2029F |
| 3.5.1 Middle East and Africa Thermal Imaging Market Revenues and Revenue Share, By Technology, 2019-2029F |
| 3.5.1.1 Middle East and Africa Thermal Imaging Market Revenues and Revenue Share, By Cooled, 2019-2029F |
| 3.5.1.2 Middle East and Africa Thermal Imaging Market Revenues and Revenue Share, By Uncooled, 2019-2029F |
| 3.5.2 Middle East and Africa Thermal Imaging Market Revenues and Revenue Share, By Form Factor, 2019-2029F |
| 3.5.2.1 Middle East and Africa Thermal Imaging Market Revenues and Revenue Share, By Fixed-Mounted , 2019-2029F |
| 3.5.2.2 Middle East and Africa Thermal Imaging Market Revenues and Revenue Share, By Handheld, 2019-2029F |
| 4. India Thermal Imaging Market Overview |
| 4.1 India Thermal Imaging Market Revenue and Volume, 2019-2029F |
| 4.2 India Thermal Imaging Market - Industry Life Cycle |
| 4.3 India Thermal Imaging Market - Porter's Five Forces |
| 4.4 India Thermal Imaging Market Ecosystem |
| 5. India Thermal Imaging Market Dynamics |
| 5.1 Impact Analysis |
| 5.2 Market Drivers |
| 5.2.1 Increasing demand for thermal imaging technology in various industries such as automotive, healthcare, and defense due to its non-invasive nature and accuracy. |
| 5.2.2 Growing adoption of thermal imaging cameras for security and surveillance purposes in India. |
| 5.2.3 Technological advancements leading to the development of more cost-effective and efficient thermal imaging solutions. |
| 6. India Thermal Imaging Market Trends |
| 7. India Thermal Imaging Market Overview, By Technology |
| 7.1 India Thermal Imaging Market Revenue Share and Revenues, By Technology |
| 7.1.1 India Thermal Imaging Market Revenues, By Cooled , 2019-2029F |
| 7.1.2 India Thermal Imaging Market Revenues, By Uncooled, 2019-2029F |
| 7.2 India Thermal Imaging Market Volume Share and Volume, By Technology |
| 7.2.1 India Thermal Imaging Market Volume, By Cooled , 2019-2029F |
| 7.2.2 India Thermal Imaging Market Volume, By Uncooled, 2019-2029F |
| 8. India Thermal Imaging Market Overview, By Form Factor |
| 8.1 India Thermal Imaging Market Revenue Share and Revenues, By Form Factor |
| 8.1.1 India Thermal Imaging Market Revenues, By Handheld , 2019-2029F |
| 8.1.2 India Thermal Imaging Market Revenues, By Fixed-Mounted, 2019-2029F |
| 8.2 India Thermal Imaging Market Volume Share and Volume, By Form Factor |
| 8.2.1 India Thermal Imaging Market Volume, By Handheld , 2019-2029F |
| 8.2.2 India Thermal Imaging Market Volume, By Fixed-Mounted, 2019-2029F |
| 9. India Thermal Imaging Market Overview, By Applications |
| 9.1 India Thermal Imaging Market Revenue Share and Revenues, By Applications |
| 9.1.1 India Thermal Imaging Market Revenues, By Security & Surveillance, 2019-2029F |
| 9.1.2 India Thermal Imaging Market Revenues, By Testing, Detection & Firefighting, 2019-2029F |
| 9.1.3 India Thermal Imaging Market Revenues, By Other Applications (Human, Wildlife Animal Safety, Transportation), 2019-2029F |
| 9.2 India Thermal Imaging Market Volume Share and Volume, By Applications |
| 9.2.1 India Thermal Imaging Market Volume, By Security & Surveillance, 2019-2029F |
| 9.2.2 India Thermal Imaging Market Volume, By Testing, Detection & Firefighting, 2019-2029F |
| 9.2.3 India Thermal Imaging Market Volume, By Other Applications (Human, Wildlife Animal Safety, Transportation), 2019-2029F |
| 10. India Thermal Imaging Market Overview, By Verticals |
| 10.1 India Thermal Imaging Market Revenue Share and Revenues, By Verticals |
| 10.1.1 India Thermal Imaging Market Revenues, By Military/ Defense, 2019-2029F |
| 10.1.2 India Thermal Imaging Market Revenues, By Industrial, 2019-2029F |
| 10.1.3 India Thermal Imaging Market Revenues, By Commercial, 2019-2029F |
| 10.2 India Thermal Imaging Market Volume Share and Volume, By Verticals |
| 10.2.1 India Thermal Imaging Market Volume, By Military/ Defense, 2019-2029F |
| 10.2.2 India Thermal Imaging Market Volume, By Industrial, 2019-2029F |
| 10.2.3 India Thermal Imaging Market Volume, By Commercial, 2019-2029F |
| 11. India Thermal Imaging Market Overview, By Region |
| 11.1 India Thermal Imaging Market Revenue Share and Revenues, By Region |
| 11.1.1 India Thermal Imaging Market Revenues, By Northern, 2019-2029F |
| 11.1.2 India Thermal Imaging Market Revenues, By Western, 2019-2029F |
| 11.1.3 India Thermal Imaging Market Revenues, By Southern, 2019-2029F |
| 11.1.4 India Thermal Imaging Market Revenues, By Eastern, 2019-2029F |
| 12. India Thermal Imaging Market Key Performance Indicators |
| 12.1 Adoption rate of thermal imaging technology across different industries in India. |
| 12.2 Number of research and development initiatives focusing on enhancing thermal imaging technology in the Indian market. |
| 12.3 Percentage increase in the number of trained professionals and technicians specializing in thermal imaging applications in India. |
| 13. India Thermal Imaging Market Opportunity Assessment |
| 14. India Thermal Imaging Market Competitive Landscape |
| 14.1 India Thermal Imaging Market Revenue Ranking, By Companies, 2022 |
| 14.2 India Thermal Imaging Market Competitive Benchmarking, By Operating Parameters |
| 15. Company Profile |
| 15.1 Teledyne FLIR LLC |
| 15.2 Fluke Corporation |
| 15.3 Testo India Pvt. Ltd |
| 15.4 Tonbo Imaging India Pvt Ltd |
| 15.5 Tata Advanced Systems Limited |
| 15.6 TAK Technologies Pvt. Ltd. |
| 15.7 Axis Communications |
| 15.8 Hangzhou Hikvision Digital Technology Co., Ltd. |
| 15.9 Thales |
| 16. Key Strategic Recommendations |
| 17. Disclaimer |
| List of Figures |
| 1. Global Thermal Imaging Market Revenues, 2019-2029F ($ Million) |
| 2. Americas Thermal Imaging Market Revenue Share , By Technology, 2022 & 2029F |
| 3. Americas Thermal Imaging Market Revenue Share , By Form Factor, 2022 & 2029F |
| 4. Europe Thermal Imaging Market Revenue Share , By Technology, 2022 & 2029F |
| 5. Europe Thermal Imaging Market Revenue Share , By Form Factor, 2022 & 2029F |
| 6. Asia Pacific Thermal Imaging Market Revenue Share , By Technology, 2022 & 2029F |
| 7. Asia Pacific Thermal Imaging Market Revenue Share , By Form Factor, 2022 & 2029F |
| 8. Middle East and Africa Thermal Imaging Market Revenue Share , By Technology, 2022 & 2029F |
| 9. Middle East and Africa Thermal Imaging Market Revenue Share , By Form Factor, 2022 & 2029F |
| 10. India Thermal Imaging Market Revenues and Volume , 2019-2029F ($ Million, Units) |
| 11. India Defence Budget Allocation, 2022-2024 (Lakh Crore) |
| 12. India Thermal Imaging Market Revenue Share, By Technology, 2022 & 2029F |
| 13. India Thermal Imaging Market Volume Share, By Technology, 2022 & 2029F |
| 14. India Thermal Imaging Market Revenue Share, By Form Factor, 2022 & 2029F |
| 15. India Thermal Imaging Market Volume Share, By Form Factor, 2022 & 2029F |
| 16. India Thermal Imaging Market Revenue Share, By Applications, 2022 & 2029F |
| 17. India Thermal Imaging Market Volume Share, By Applications, 2022 & 2029F |
| 18. India Thermal Imaging Market Revenue Share, By Verticals, 2022 & 2029F |
| 19. India Thermal Imaging Market Volume Share, By Verticals, 2022 & 2029F |
| 20. India Thermal Imaging Market Revenue Share, By Region, 2022 & 2029F |
| 21. India Production Performance of Core Industries, 2020-2021 |
| 22. India Number of Breast Cancer Patients, 2022 & 2030F ( Thousand ) |
| 23. India Medical Device Market , 2022-2030F, ( $ Billion ) |
| 24. India Thermal Imaging Market Revenue Ranking, By Companies, 2022 |
| List of Tables |
| 1. Asia Pacific, America, Europe and Middle East and Africa Thermal Imaging Market Revenue, 2019-2029F ($ Million) |
| 2. Americas Thermal Imaging Market Revenue Share , By Technology, 2019-2029F ($ Million) |
| 3. Americas Thermal Imaging Market Revenue Share , By Form Factor, 2019-2029F ($ Million) |
| 4. Europe Thermal Imaging Market Revenue Share , By Technology, 2019-2029F ($ Million) |
| 5. Europe Thermal Imaging Market Revenue Share , By Form Factor, 2019-2029F ($ Million) |
| 6. Asia Pacific Thermal Imaging Market Revenue Share , By Technology, 2019-2029F ($ Million) |
| 7. Asia Pacific Thermal Imaging Market Revenue Share , By Form Factor, 2019-2029F ($ Million) |
| 8. Middle East and Africa Thermal Imaging Market Revenue Share , By Technology, 2019-2029F ($ Million) |
| 9. Middle East and Africa Thermal Imaging Market Revenue Share , By Form Factor, 2019-2029F ($ Million) |
| 10. India Industrial Sector Schemes |
| 11. India Thermal Imaging Market Revenue Share, By Technology, 2019-2029F ($ Million) |
| 12. India Thermal Imaging Market Volume, By Technology, 2019-2029F (Units) |
| 13. India Thermal Imaging Market Revenue, By Form Factor, 2019-2029F ($ Million) |
| 14. India Thermal Imaging Market Volume, By Form Factor, 2019-2029F (Units) |
| 15. India Thermal Imaging Market Revenue, By Applications, 2019-2029F ($ Million) |
| 16. India Thermal Imaging Market Volume, By Applications, 2019-2029F (Units) |
| 17. India Thermal Imaging Market Revenue, By Verticals, 2019-2029F ($ Million) |
| 18. India Thermal Imaging Market Volume, By Verticals, 2019-2029F (Units) |
| 19. India Thermal Imaging Market Revenue, By Region, 2019-2029F ($ Million) |
Global Go To Market Strategy - 2030
Export potential enables firms to identify high-growth global markets with greater confidence by combining advanced trade intelligence with a structured quantitative methodology. The framework analyzes emerging demand trends and country-level import patterns while integrating macroeconomic and trade datasets such as GDP and population forecasts, bilateral import–export flows, tariff structures, elasticity differentials between developed and developing economies, geographic distance, and import demand projections. Using weighted trade values from 2020–2024 as the base period to project country-to-country export potential for 2030, these inputs are operationalized through calculated drivers such as gravity model parameters, tariff impact factors, and projected GDP per-capita growth. Through an analysis of hidden potentials, demand hotspots, and market conditions that are most favorable to success, this method enables firms to focus on target countries, maximize returns, and global expansion with data, backed by accuracy.
By factoring in the projected importer demand gap that is currently unmet and could be potential opportunity, it identifies the potential for the Exporter (Country) among 190 countries, against the general trade analysis, which identifies the biggest importer or exporter.
To discover high-growth global markets and optimize your business strategy:
Click Here
Pricing
- Single User License$ 1,995
- Department License$ 2,400
- Site License$ 3,120
- Global License$ 3,795

Leadership Perspectives from Industry Events
Search
Thought Leadership and Analyst Meet


Our Clients
6WResearch In News
- Doha a strategic location for EV manufacturing hub: IPA Qatar
- Demand for luxury TVs surging in the GCC, says Samsung
- Empowering Growth: The Thriving Journey of Bangladesh’s Cable Industry
- Demand for luxury TVs surging in the GCC, says Samsung
- Video call with a traditional healer? Once unthinkable, it’s now common in South Africa
- Intelligent Buildings To Smooth GCC’s Path To Net Zero
Latest Reports
- New Zealand Aseptic Manufacturing Market (2026-2032)
- Netherlands Aseptic Manufacturing Market (2026-2032)
- Nauru Aseptic Manufacturing Market (2026-2032)
- Namibia Aseptic Manufacturing Market (2026-2032)
- Mozambique Aseptic Manufacturing Market (2026-2032)
- Montenegro Aseptic Manufacturing Market (2026-2032)
- Mongolia Aseptic Manufacturing Market (2026-2032)
- Monaco Aseptic Manufacturing Market (2026-2032)
- Micronesia Aseptic Manufacturing Market (2026-2032)
- Mauritius Aseptic Manufacturing Market (2026-2032)
Industry Events and Analyst Meet

HIMTEX 2026

India Refining Summit 2026

India EV Show 2026

EV tech India Expo 2026

Auto Tech Asia 2026
Whitepaper
- Middle East & Africa Commercial Security Market Click here to view more.
- Middle East & Africa Fire Safety Systems & Equipment Market Click here to view more.
- GCC Drone Market Click here to view more.
- Middle East Lighting Fixture Market Click here to view more.
- GCC Physical & Perimeter Security Market Click here to view more.