Indonesia 1,3-butylene Glycol Market (2026-2032) Outlook | Industry, Analysis, Trends, Size, Revenue, Forecast, Share, Growth, Value & Companies
Market Forecast By Product (Pharmaceutical Grade, Industrial Grade), By Function (Humectant, Emollient, Stabilizer, Intermediate), By Application (Cosmetic & Personal Care Products, Food Products) And Competitive Landscape
| Product Code: ETC233368 | Publication Date: Aug 2023 | Updated Date: Jul 2026 | Product Type: Market Research Report | |
| Publisher: 6Wresearch | Author: Ravi Bhandari | No. of Pages: 75 | No. of Figures: 35 | No. of Tables: 20 |
Indonesia 1,3-butylene Glycol Market Size, Share & Growth Rate
The Indonesia 1,3-butylene Glycol Market was estimated at USD 247 Million in 2025 and is projected to reach USD 329 Million by 2032, growing at a CAGR of 4.2% from 2026 to 2032. This growth trajectory is primarily driven by the increasing demand from various end-user sectors, particularly cosmetics, personal care, and pharmaceuticals. As consumer preferences evolve towards high-quality personal care products, the importance of 1,3-butylene glycol as a versatile ingredient is set to bolster its market presence.
Indonesia 1,3-butylene Glycol Market Year-wise Growth Rate and Key Drivers
This graph highlights how the Indonesia 1,3-butylene Glycol Market has steadily grown over the years, supported by major growth factors.
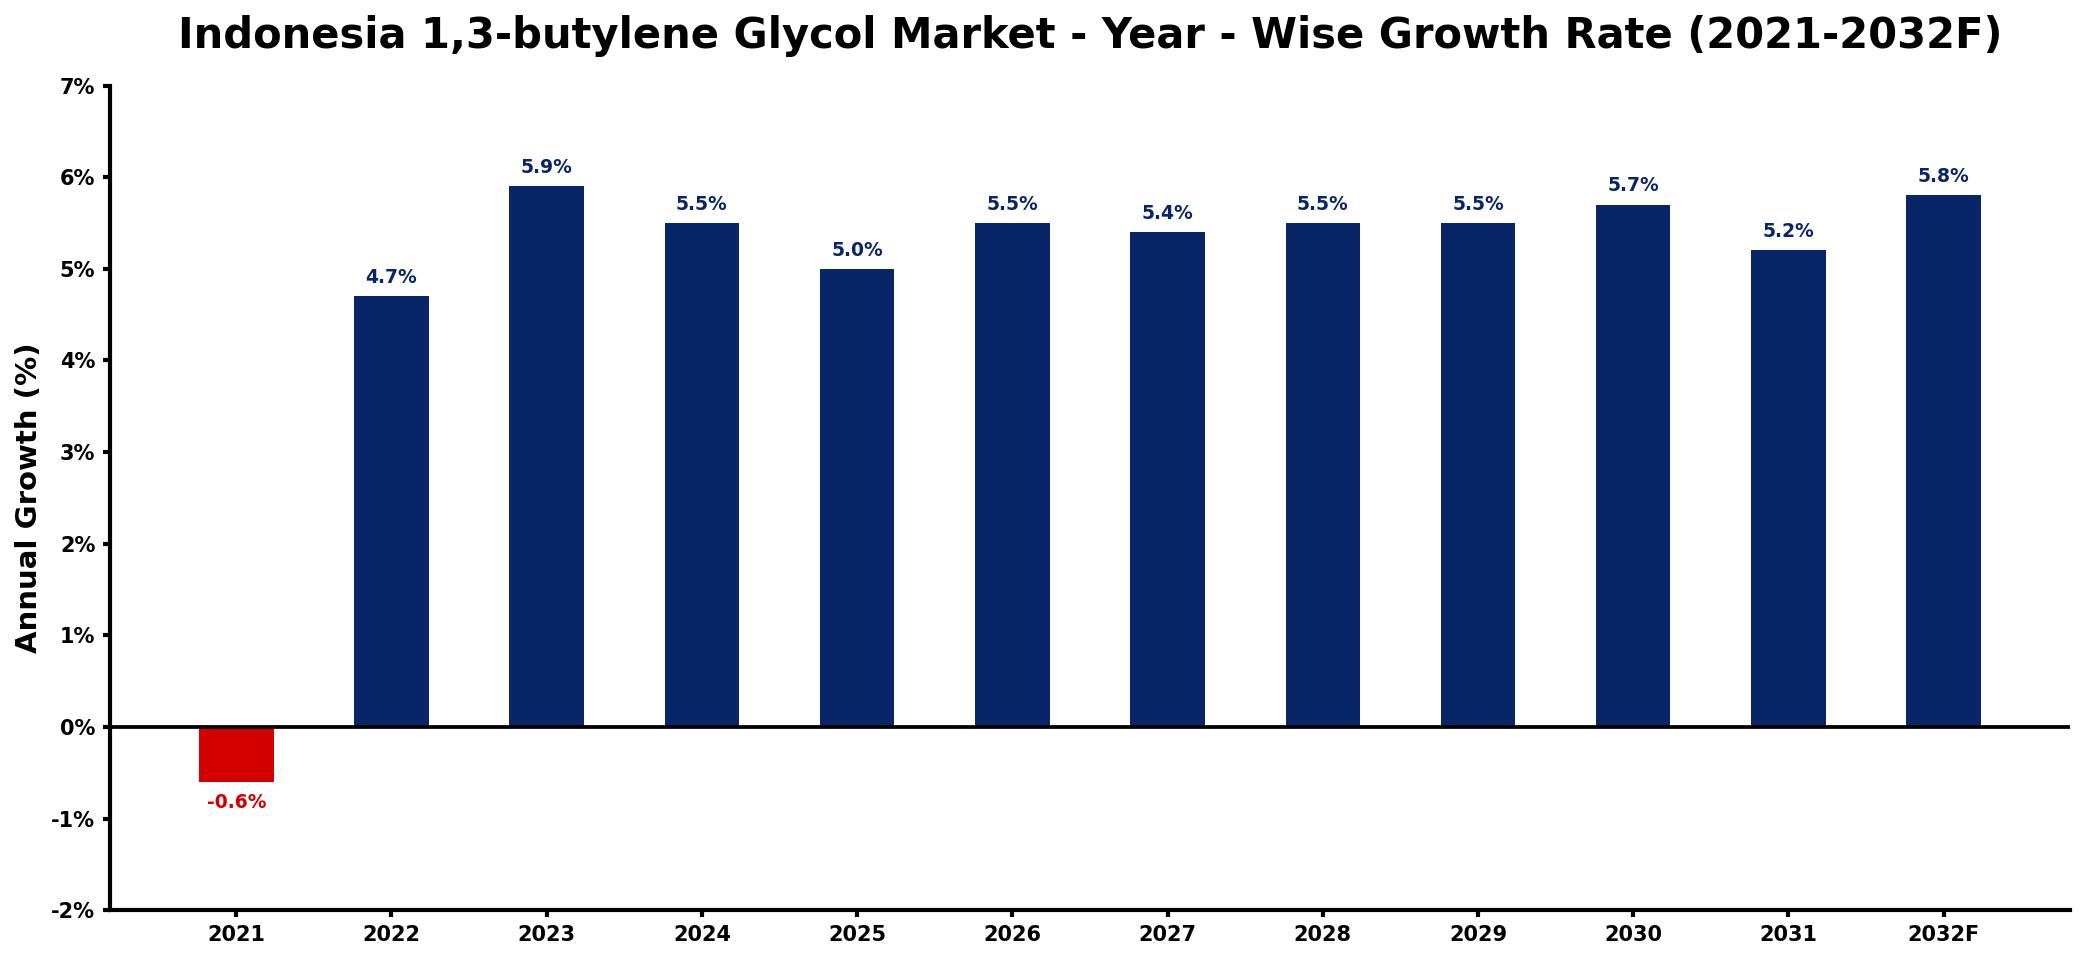
The table below presents the year‑wise growth rates along with the key drivers influencing the market
| Year | Growth Rate | Major Drivers |
| 2021 | -0.6% | decreased industrial production capacity |
| 2022 | 4.7% | rising demand from cosmetics sector |
| 2023 | 5.9% | increased use in personal care |
| 2024 | 5.5% | growing applications in pharmaceuticals |
| 2025 | 5.0% | expansion in food industry usage |
| 2026 | 5.5% | enhanced investment in R&D |
| 2027 | 5.4% | surge in e-commerce distribution |
| 2028 | 5.5% | strengthened regulations for quality |
| 2029 | 5.5% | growing awareness of sustainability |
| 2030 | 5.7% | growing downstream application demand |
| 2031 | 5.2% | increased adoption in agriculture sector |
| 2032 | 5.8% | expansion of manufacturing facilities |
Note: Market size estimations and growth projections presented in this report are based on 6Wresearch's proprietary forecasting methodology, utilizing the latest available industry data, government publications, and primary research inputs.
Indonesia 1,3-butylene Glycol Market Synopsis
Currently, the 1,3-butylene glycol market in Indonesia is experiencing notable momentum, fueled by the rapid development of the country's chemical industry. As businesses adapt to changing consumer behaviors and preferences, the versatility of 1,3-butylene glycol in a range of applications, from cosmetics to industrial products, is becoming increasingly apparent.
The rising disposable income of Indonesian consumers is further propelling the demand for personal care products, where 1,3-butylene glycol serves as an essential ingredient. Additionally, the expansion of the pharmaceutical sector in Indonesia underscores the compounds role in enhancing medication formulation and delivery.
Indonesia 1,3-butylene Glycol Market Key Takeaways
- The market is projected to achieve robust growth due to increasing applications in various industries.
- Rising consumer spending on cosmetics and personal care products is a major demand driver.
- The pharmaceutical sector's expansion is anticipated to boost the utilization of 1,3-butylene glycol.
- Regulatory challenges may impact production and distribution but are manageable.
- COVID-19 has led to fluctuations; however, recovery is on the horizon as economic conditions improve.
Evaluation of Restraints in Indonesia 1,3-butylene Glycol Market
Despite the promising outlook, the Indonesia 1,3-butylene glycol market faces certain constraints. Stringent regulations surrounding chemical safety and usage may hinder the manufacturing and distribution processes. These regulatory frameworks are essential for consumer safety but could present challenges for companies aiming to scale operations. Furthermore, health-related concerns associated with the compound could invite scrutiny, thereby affecting market growth dynamics.
Indonesia 1,3-butylene Glycol Market Trends
A significant trend in the Indonesia 1,3-butylene glycol market is the growing emphasis on eco-friendly and sustainable products. As consumers become more conscious of their environmental impact, manufacturers are increasingly seeking alternatives and enhancements that align with these values. Additionally, innovations in formulation technology are paving the way for enhanced product efficacy, particularly in the cosmetics and pharmaceuticals sectors.
Indonesia 1,3-butylene Glycol Market Opportunities
Opportunities abound in the Indonesian market for 1,3-butylene glycol, particularly within the realm of personal care and pharmaceuticals. The ongoing trends of urbanization and rising middle-class affluence indicate a fertile ground for investment. Companies looking to introduce value-added products or innovative applications can capitalize on the growing trend of wellness and personal grooming among consumers.
Government Initiatives in the Indonesia 1,3-butylene Glycol Market
The Indonesian government has been proactive in promoting the development of its chemical industry through various initiatives. These may include public spending on infrastructure improvements, support for research and development, and incentives for sustainable production practices. Policies aimed at enhancing the investment climate in the chemical sector are likely to further stimulate growth and innovation in the 1,3-butylene glycol market.
Future Insights of the Indonesia 1,3-butylene Glycol Market
Looking ahead to the period from 2026 to 2032, the Indonesia 1,3-butylene glycol market is expected to witness sustained growth, driven primarily by technological advancements and expanding applications across various sectors. The interplay of consumer demand for high-quality cosmetic and pharmaceutical products, along with the support from government initiatives, is set to create a robust environment for market expansion.
Indonesia 1,3-butylene Glycol Market Latest Developments (2025 - 2026)
Recent developments indicate a cautious yet optimistic recovery trajectory within the Indonesia 1,3-butylene glycol market. The post-pandemic rebound is marked by a gradual resumption of consumer spending in cosmetics and personal care. Innovations aimed at enhancing product formulations continue to emerge, reflecting the sector's adaptability in addressing evolving consumer needs.
Indonesia 1,3-butylene Glycol Market - Key Attractiveness of the Report
- 10 Years of Market Numbers
- Historical Data Starting from 2022 to 2025
- Base Year: 2025
- Forecast Data until 2032
- Key Performance Indicators Impacting the Market
- Major Upcoming Developments and Projects
Key Highlights of the Report:
- Indonesia 1,3-butylene Glycol Market Outlook
- Market Size of Indonesia 1,3-butylene Glycol Market, 2025
- Forecast of Indonesia 1,3-butylene Glycol Market, 2032
- Historical Data and Forecast of Indonesia 1,3-butylene Glycol Revenues & Volume for the Period 2022-2032F
- Indonesia 1,3-butylene Glycol Market Trend Evolution
- Indonesia 1,3-butylene Glycol Market Drivers and Challenges
- Indonesia 1,3-butylene Glycol Price Trends
- Indonesia 1,3-butylene Glycol Porter's Five Forces
- Indonesia 1,3-butylene Glycol Industry Life Cycle
- Historical Data and Forecast of Indonesia 1,3-butylene Glycol Market Revenues & Volume By Product for the Period 2022-2032F
- Historical Data and Forecast of Indonesia 1,3-butylene Glycol Market Revenues & Volume By Pharmaceutical Grade for the Period 2022-2032F
- Historical Data and Forecast of Indonesia 1,3-butylene Glycol Market Revenues & Volume By Industrial Grade for the Period 2022-2032F
- Historical Data and Forecast of Indonesia 1,3-butylene Glycol Market Revenues & Volume By Function for the Period 2022-2032F
- Historical Data and Forecast of Indonesia 1,3-butylene Glycol Market Revenues & Volume By Humectant for the Period 2022-2032F
- Historical Data and Forecast of Indonesia 1,3-butylene Glycol Market Revenues & Volume By Emollient for the Period 2022-2032F
- Historical Data and Forecast of Indonesia 1,3-butylene Glycol Market Revenues & Volume By Stabilizer for the Period 2022-2032F
- Historical Data and Forecast of Indonesia 1,3-butylene Glycol Market Revenues & Volume By Intermediate for the Period 2022-2032F
- Historical Data and Forecast of Indonesia 1,3-butylene Glycol Market Revenues & Volume By Application for the Period 2022-2032F
- Historical Data and Forecast of Indonesia 1,3-butylene Glycol Market Revenues & Volume By Cosmetic & Personal Care Products for the Period 2022-2032F
- Historical Data and Forecast of Indonesia 1,3-butylene Glycol Market Revenues & Volume By Food Products for the Period 2022-2032F
- Indonesia 1,3-butylene Glycol Import Export Trade Statistics
- Market Opportunity Assessment By Product
- Market Opportunity Assessment By Function
- Market Opportunity Assessment By Application
- Indonesia 1,3-butylene Glycol Top Companies Market Share
- Indonesia 1,3-butylene Glycol Competitive Benchmarking By Technical and Operational Parameters
- Indonesia 1,3-butylene Glycol Company Profiles
- Indonesia 1,3-butylene Glycol Key Strategic Recommendations
Frequently Asked Questions About the Market Study (FAQs):
The growth is driven by increased demand in key sectors such as cosmetics, personal care, and pharmaceuticals, alongside rising disposable incomes that lead to higher consumer spending.
The pharmaceutical sector's expansion enhances the demand for 1,3-butylene glycol as a crucial solvent and excipient, facilitating improved medication formulations.
The market is projected to grow from USD 247 Million in 2025 to USD 329 Million by 2032, reflecting a CAGR of 4.2% during the period from 2026 to 2032.
Yes, stringent regulations surrounding chemical safety and health concerns could impose limitations on the production and distribution processes for 1,3-butylene glycol.
Changing consumer lifestyles, particularly an increasing focus on personal grooming and wellness, significantly boost the demand for high-quality personal care products that utilize 1,3-butylene glycol.
6Wresearch actively monitors the Indonesia 1,3-butylene Glycol Market and publishes its comprehensive annual report, highlighting emerging trends, growth drivers, revenue analysis, and forecast outlook. Our insights help businesses to make data-backed strategic decisions with ongoing market dynamics. Our analysts track relevent industries related to the Indonesia 1,3-butylene Glycol Market, allowing our clients with actionable intelligence and reliable forecasts tailored to emerging regional needs.
Yes, we provide customisation as per your requirements. To learn more, feel free to contact us on sales@6wresearch.com
1 Executive Summary |
2 Introduction |
2.1 Key Highlights of the Report |
2.2 Report Description |
2.3 Market Scope & Segmentation |
2.4 Research Methodology |
2.5 Assumptions |
3 Indonesia 1,3-butylene Glycol Market Overview |
3.1 Indonesia Country Macro Economic Indicators |
3.2 Indonesia 1,3-butylene Glycol Market Revenues & Volume, 2022 & 2032F |
3.3 Indonesia 1,3-butylene Glycol Market - Industry Life Cycle |
3.4 Indonesia 1,3-butylene Glycol Market - Porter's Five Forces |
3.5 Indonesia 1,3-butylene Glycol Market Revenues & Volume Share, By Product, 2022 & 2032F |
3.6 Indonesia 1,3-butylene Glycol Market Revenues & Volume Share, By Function, 2022 & 2032F |
3.7 Indonesia 1,3-butylene Glycol Market Revenues & Volume Share, By Application, 2022 & 2032F |
4 Indonesia 1,3-butylene Glycol Market Dynamics |
4.1 Impact Analysis |
4.2 Market Drivers |
4.2.1 Growth in the cosmetics and personal care industry in Indonesia |
4.2.2 Increasing demand for 1,3-butylene glycol in the pharmaceutical sector |
4.2.3 Shift towards sustainable and bio-based ingredients in the chemical industry |
4.3 Market Restraints |
4.3.1 Fluctuating raw material prices impacting production costs |
4.3.2 Stringent government regulations on the usage of certain chemical ingredients |
4.3.3 Competition from alternative chemicals with similar properties |
5 Indonesia 1,3-butylene Glycol Market Trends |
6 Indonesia 1,3-butylene Glycol Market, By Types |
6.1 Indonesia 1,3-butylene Glycol Market, By Product |
6.1.1 Overview and Analysis |
6.1.2 Indonesia 1,3-butylene Glycol Market Revenues & Volume, By Product, 2022-2032F |
6.1.3 Indonesia 1,3-butylene Glycol Market Revenues & Volume, By Pharmaceutical Grade, 2022-2032F |
6.1.4 Indonesia 1,3-butylene Glycol Market Revenues & Volume, By Industrial Grade, 2022-2032F |
6.2 Indonesia 1,3-butylene Glycol Market, By Function |
6.2.1 Overview and Analysis |
6.2.2 Indonesia 1,3-butylene Glycol Market Revenues & Volume, By Humectant, 2022-2032F |
6.2.3 Indonesia 1,3-butylene Glycol Market Revenues & Volume, By Emollient, 2022-2032F |
6.2.4 Indonesia 1,3-butylene Glycol Market Revenues & Volume, By Stabilizer, 2022-2032F |
6.2.5 Indonesia 1,3-butylene Glycol Market Revenues & Volume, By Intermediate, 2022-2032F |
6.3 Indonesia 1,3-butylene Glycol Market, By Application |
6.3.1 Overview and Analysis |
6.3.2 Indonesia 1,3-butylene Glycol Market Revenues & Volume, By Cosmetic & Personal Care Products, 2022-2032F |
6.3.3 Indonesia 1,3-butylene Glycol Market Revenues & Volume, By Food Products, 2022-2032F |
7 Indonesia 1,3-butylene Glycol Market Import-Export Trade Statistics |
7.1 Indonesia 1,3-butylene Glycol Market Export to Major Countries |
7.2 Indonesia 1,3-butylene Glycol Market Imports from Major Countries |
8 Indonesia 1,3-butylene Glycol Market Key Performance Indicators |
8.1 Adoption rate of bio-based 1,3-butylene glycol in the market |
8.2 Number of new product launches containing 1,3-butylene glycol |
8.3 Investment in research and development for enhancing the properties of 1,3-butylene glycol |
9 Indonesia 1,3-butylene Glycol Market - Opportunity Assessment |
9.1 Indonesia 1,3-butylene Glycol Market Opportunity Assessment, By Product, 2022 & 2032F |
9.2 Indonesia 1,3-butylene Glycol Market Opportunity Assessment, By Function, 2022 & 2032F |
9.3 Indonesia 1,3-butylene Glycol Market Opportunity Assessment, By Application, 2022 & 2032F |
10 Indonesia 1,3-butylene Glycol Market - Competitive Landscape |
10.1 Indonesia 1,3-butylene Glycol Market Revenue Share, By Companies, 2025 |
10.2 Indonesia 1,3-butylene Glycol Market Competitive Benchmarking, By Operating and Technical Parameters |
11 Company Profiles |
12 Recommendations |
13 Disclaimer |
Global Go To Market Strategy - 2030
Export potential enables firms to identify high-growth global markets with greater confidence by combining advanced trade intelligence with a structured quantitative methodology. The framework analyzes emerging demand trends and country-level import patterns while integrating macroeconomic and trade datasets such as GDP and population forecasts, bilateral import–export flows, tariff structures, elasticity differentials between developed and developing economies, geographic distance, and import demand projections. Using weighted trade values from 2020–2024 as the base period to project country-to-country export potential for 2030, these inputs are operationalized through calculated drivers such as gravity model parameters, tariff impact factors, and projected GDP per-capita growth. Through an analysis of hidden potentials, demand hotspots, and market conditions that are most favorable to success, this method enables firms to focus on target countries, maximize returns, and global expansion with data, backed by accuracy.
By factoring in the projected importer demand gap that is currently unmet and could be potential opportunity, it identifies the potential for the Exporter (Country) among 190 countries, against the general trade analysis, which identifies the biggest importer or exporter.
To discover high-growth global markets and optimize your business strategy:
Click Here
Pricing
- Single User License$ 1,995
- Department License$ 2,400
- Site License$ 3,120
- Global License$ 3,795

Leadership Perspectives from Industry Events
Search
Thought Leadership and Analyst Meet


Our Clients
6WResearch In News
- India Air Conditioner Market Set for Strong Rebound in 2026 After Weather-Led Correction and GST-Driven Recovery: 6Wresearch
- ADAS in India: How Automatic Emergency Braking, Blind Spot Detection & Driver Monitoring are Transforming Road Safety
- Doha a strategic location for EV manufacturing hub: IPA Qatar
- Demand for luxury TVs surging in the GCC, says Samsung
- Empowering Growth: The Thriving Journey of Bangladesh’s Cable Industry
- Demand for luxury TVs surging in the GCC, says Samsung
Latest Reports
- Nicaragua RPG Gaming Market (2026-2032)
- New Zealand RPG Gaming Market (2026-2032)
- Netherlands RPG Gaming Market (2026-2032)
- Nauru RPG Gaming Market (2026-2032)
- Namibia RPG Gaming Market (2026-2032)
- Mozambique RPG Gaming Market (2026-2032)
- Montenegro RPG Gaming Market (2026-2032)
- Mongolia RPG Gaming Market (2026-2032)
- Monaco RPG Gaming Market (2026-2032)
- Micronesia RPG Gaming Market (2026-2032)
Industry Events and Analyst Meet

EV India Expo 2026

HIMTEX 2026

India Refining Summit 2026

India EV Show 2026

EV tech India Expo 2026
Whitepaper
- Middle East & Africa Commercial Security Market Click here to view more.
- Middle East & Africa Fire Safety Systems & Equipment Market Click here to view more.
- GCC Drone Market Click here to view more.
- Middle East Lighting Fixture Market Click here to view more.
- GCC Physical & Perimeter Security Market Click here to view more.