Indonesia Bioactive Ingredients & Product Market (2026-2032) Outlook | Share, Growth, Forecast, Value, Analysis, Trends, Revenue, Companies, Industry & Size
Market Forecast By Ingredient (Probiotics, Proteins, Plant Extracts, Minerals, Vitamins, Fibers, Carotenoids), By Type (Prebiotics, Probiotics, Amino acids, peptides & proteins, Omega 3 & structured lipids, Phytochemicals & plant extracts, Minerals, Vitamins, Fibers & specialty carbohydrates), By Application (Functional food, Functional beverages, Dietary supplements, Animal nutrition, Personal care) And Competitive Landscape
| Product Code: ETC4600649 | Publication Date: Jul 2023 | Updated Date: Mar 2026 | Product Type: Report | |
| Publisher: 6Wresearch | Author: Ravi Bhandari | No. of Pages: 85 | No. of Figures: 45 | No. of Tables: 25 |
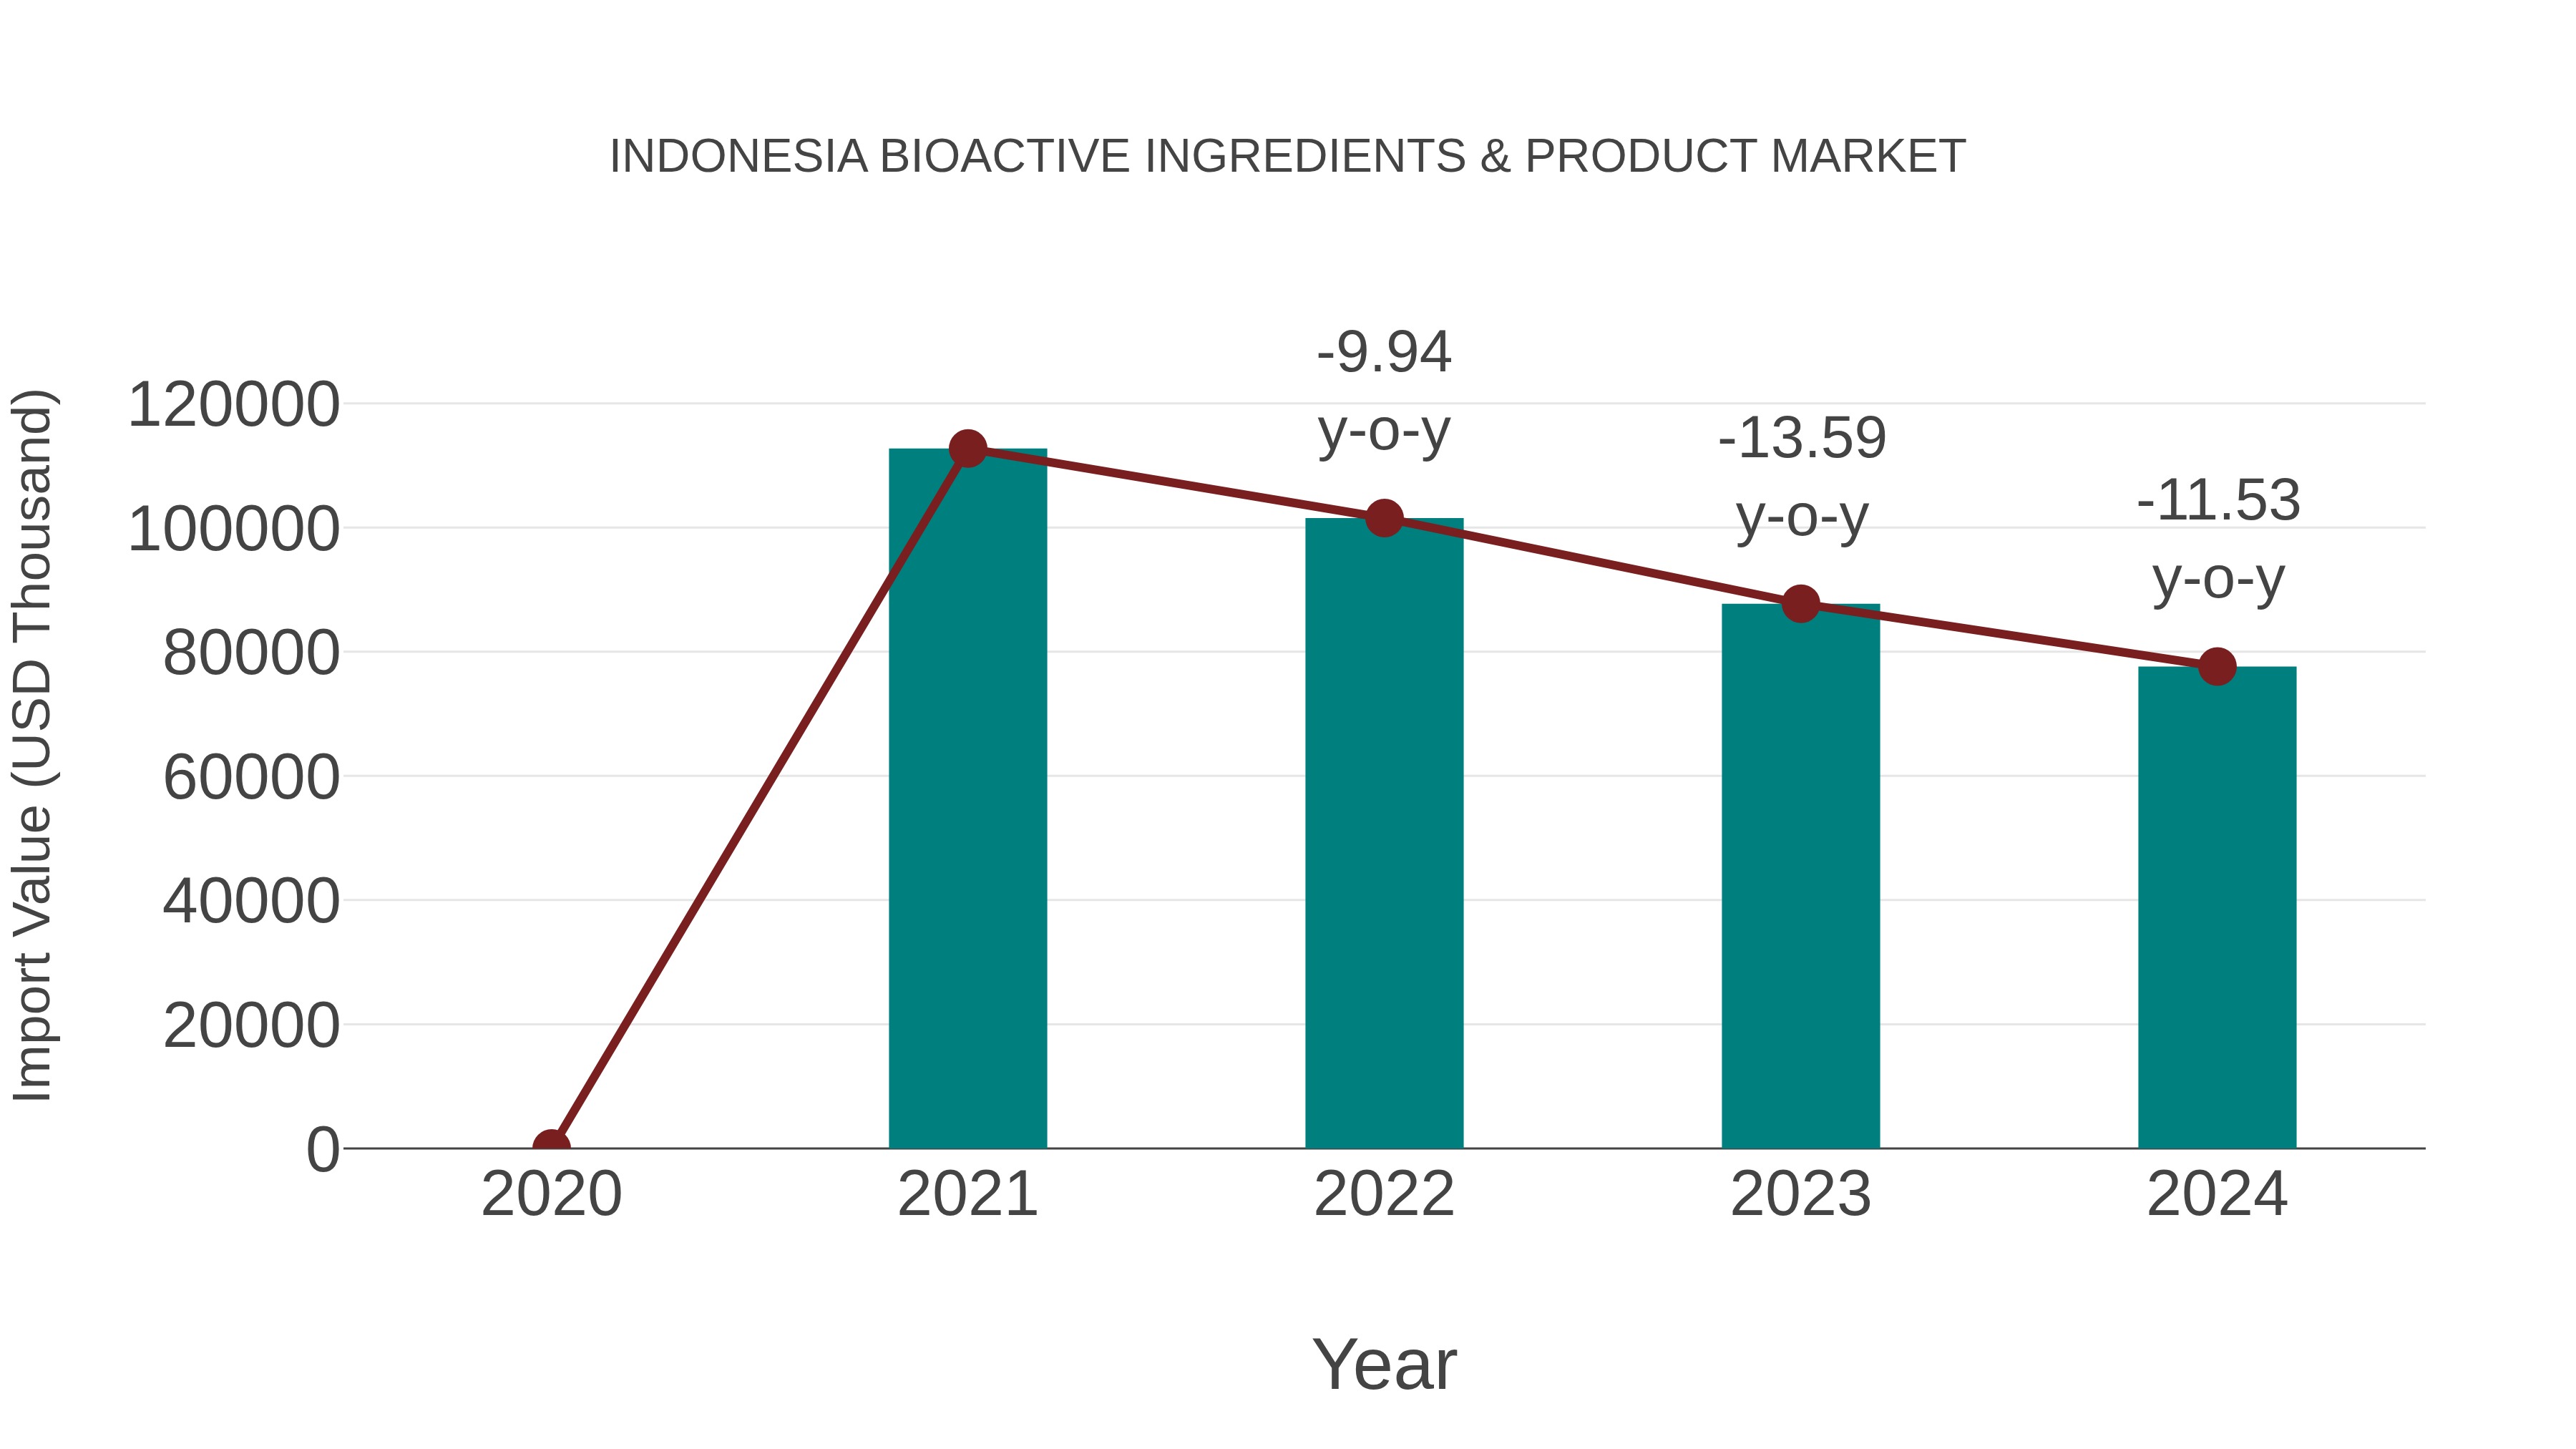
Indonesia Bioactive Ingredients & Product Market: Import Trend Analysis
In the Indonesia bioactive ingredients & product market, the import trend experienced a decline from 2023 to 2024, with a growth rate of -11.53%. The compound annual growth rate (CAGR) for the period 2020-2024 stood at -11.7%. This negative momentum could be attributed to shifts in demand dynamics or changes in trade policies impacting market stability.
Indonesia Bioactive Ingredients Product Market Overview
The market for bioactive ingredients in Indonesia encompasses a wide range of products derived from natural sources with beneficial properties for agriculture. These ingredients may include plant extracts, enzymes, and microbial metabolites that enhance plant health and productivity. The market`s growth is driven by the increasing awareness of the benefits of bioactive ingredients in optimizing agricultural practices.
Drivers of the Market
The Indonesia bioactive ingredients product market is primarily driven by the expanding health and wellness industry. Consumers are becoming more health-conscious, seeking products with natural and functional ingredients. This trend is pushing manufacturers to incorporate bioactive ingredients into their products, driving the demand for these ingredients. Moreover, the government`s focus on supporting the development of the local nutraceutical and functional food industry is fostering growth in the bioactive ingredients market.
Challenges of the Market
Creating bioactive ingredient products that meet regulatory requirements while being economically viable can be challenging. Developing innovative formulations and ensuring product stability is essential.
COVID-19 Impacts on the Market
The COVID-19 pandemic had a mixed impact on the Indonesia bioactive ingredients product market. Initially, disruptions in the supply chain and reduced economic activities affected the market. However, the heightened awareness about health and wellness during the pandemic led to an increased demand for products enriched with bioactive ingredients. As the economy recovers and consumers continue to prioritize health-conscious choices, the bioactive ingredients product market is expected to witness sustained growth in Indonesia.
Key Players of the Makret
The Indonesia bioactive ingredients product market features companies such as Bio Actives, Sari Husada, and Soho Global Health. These firms are involved in the development and distribution of bioactive ingredients for use in various sectors, including pharmaceuticals and cosmetics.
Key Highlights of the Report:
- Indonesia Bioactive Ingredients & Product Market Outlook
- Market Size of Indonesia Bioactive Ingredients & Product Market, 2025
- Forecast of Indonesia Bioactive Ingredients & Product Market, 2032
- Historical Data and Forecast of Indonesia Bioactive Ingredients & Product Revenues & Volume for the Period 2022-2032F
- Indonesia Bioactive Ingredients & Product Market Trend Evolution
- Indonesia Bioactive Ingredients & Product Market Drivers and Challenges
- Indonesia Bioactive Ingredients & Product Price Trends
- Indonesia Bioactive Ingredients & Product Porter's Five Forces
- Indonesia Bioactive Ingredients & Product Industry Life Cycle
- Historical Data and Forecast of Indonesia Bioactive Ingredients & Product Market Revenues & Volume By Ingredient for the Period 2022-2032F
- Historical Data and Forecast of Indonesia Bioactive Ingredients & Product Market Revenues & Volume By Probiotics for the Period 2022-2032F
- Historical Data and Forecast of Indonesia Bioactive Ingredients & Product Market Revenues & Volume By Proteins for the Period 2022-2032F
- Historical Data and Forecast of Indonesia Bioactive Ingredients & Product Market Revenues & Volume By Plant Extracts for the Period 2022-2032F
- Historical Data and Forecast of Indonesia Bioactive Ingredients & Product Market Revenues & Volume By Minerals for the Period 2022-2032F
- Historical Data and Forecast of Indonesia Bioactive Ingredients & Product Market Revenues & Volume By Vitamins for the Period 2022-2032F
- Historical Data and Forecast of Indonesia Bioactive Ingredients & Product Market Revenues & Volume By Fibers for the Period 2022-2032F
- Historical Data and Forecast of Indonesia Bioactive Ingredients & Product Market Revenues & Volume By Carotenoids for the Period 2022-2032F
- Historical Data and Forecast of Indonesia Bioactive Ingredients & Product Market Revenues & Volume By Type for the Period 2022-2032F
- Historical Data and Forecast of Indonesia Bioactive Ingredients & Product Market Revenues & Volume By Prebiotics for the Period 2022-2032F
- Historical Data and Forecast of Indonesia Bioactive Ingredients & Product Market Revenues & Volume By Probiotics for the Period 2022-2032F
- Historical Data and Forecast of Indonesia Bioactive Ingredients & Product Market Revenues & Volume By Amino acids, peptides & proteins for the Period 2022-2032F
- Historical Data and Forecast of Indonesia Bioactive Ingredients & Product Market Revenues & Volume By Omega 3 & structured lipids for the Period 2022-2032F
- Historical Data and Forecast of Indonesia Bioactive Ingredients & Product Market Revenues & Volume By Phytochemicals & plant extracts for the Period 2022-2032F
- Historical Data and Forecast of Indonesia Bioactive Ingredients & Product Market Revenues & Volume By Minerals for the Period 2022-2032F
- Historical Data and Forecast of Indonesia Bioactive Ingredients & Product Market Revenues & Volume By Vitamins for the Period 2022-2032F
- Historical Data and Forecast of Indonesia Bioactive Ingredients & Product Market Revenues & Volume By Fibers & specialty carbohydrates for the Period 2022-2032F
- Historical Data and Forecast of Indonesia Bioactive Ingredients & Product Market Revenues & Volume By Application for the Period 2022-2032F
- Historical Data and Forecast of Indonesia Bioactive Ingredients & Product Market Revenues & Volume By Functional food for the Period 2022-2032F
- Historical Data and Forecast of Indonesia Bioactive Ingredients & Product Market Revenues & Volume By Functional beverages for the Period 2022-2032F
- Historical Data and Forecast of Indonesia Bioactive Ingredients & Product Market Revenues & Volume By Dietary supplements for the Period 2022-2032F
- Historical Data and Forecast of Indonesia Bioactive Ingredients & Product Market Revenues & Volume By Animal nutrition for the Period 2022-2032F
- Historical Data and Forecast of Indonesia Bioactive Ingredients & Product Market Revenues & Volume By Personal care for the Period 2022-2032F
- Indonesia Bioactive Ingredients & Product Import Export Trade Statistics
- Market Opportunity Assessment By Ingredient
- Market Opportunity Assessment By Type
- Market Opportunity Assessment By Application
- Indonesia Bioactive Ingredients & Product Top Companies Market Share
- Indonesia Bioactive Ingredients & Product Competitive Benchmarking By Technical and Operational Parameters
- Indonesia Bioactive Ingredients & Product Company Profiles
- Indonesia Bioactive Ingredients & Product Key Strategic Recommendations
Indonesia Bioactive Ingredients & Product Market (2026-2032): FAQs
6Wresearch actively monitors the Indonesia Bioactive Ingredients & Product Market and publishes its comprehensive annual report, highlighting emerging trends, growth drivers, revenue analysis, and forecast outlook. Our insights help businesses to make data-backed strategic decisions with ongoing market dynamics. Our analysts track relevent industries related to the Indonesia Bioactive Ingredients & Product Market, allowing our clients with actionable intelligence and reliable forecasts tailored to emerging regional needs.
Yes, we provide customisation as per your requirements. To learn more, feel free to contact us on sales@6wresearch.com
1 Executive Summary |
2 Introduction |
2.1 Key Highlights of the Report |
2.2 Report Description |
2.3 Market Scope & Segmentation |
2.4 Research Methodology |
2.5 Assumptions |
3 Indonesia Bioactive Ingredients & Product Market Overview |
3.1 Indonesia Country Macro Economic Indicators |
3.2 Indonesia Bioactive Ingredients & Product Market Revenues & Volume, 2022 & 2032F |
3.3 Indonesia Bioactive Ingredients & Product Market - Industry Life Cycle |
3.4 Indonesia Bioactive Ingredients & Product Market - Porter's Five Forces |
3.5 Indonesia Bioactive Ingredients & Product Market Revenues & Volume Share, By Ingredient, 2022 & 2032F |
3.6 Indonesia Bioactive Ingredients & Product Market Revenues & Volume Share, By Type, 2022 & 2032F |
3.7 Indonesia Bioactive Ingredients & Product Market Revenues & Volume Share, By Application, 2022 & 2032F |
4 Indonesia Bioactive Ingredients & Product Market Dynamics |
4.1 Impact Analysis |
4.2 Market Drivers |
4.2.1 Increasing consumer awareness about health and wellness benefits of bioactive ingredients |
4.2.2 Growing demand for natural and organic products in Indonesia |
4.2.3 Supportive government regulations promoting the use of bioactive ingredients in food and beverages |
4.3 Market Restraints |
4.3.1 High production costs associated with sourcing and processing bioactive ingredients |
4.3.2 Limited availability of advanced technologies for extraction and formulation of bioactive ingredients |
5 Indonesia Bioactive Ingredients & Product Market Trends |
6 Indonesia Bioactive Ingredients & Product Market, By Types |
6.1 Indonesia Bioactive Ingredients & Product Market, By Ingredient |
6.1.1 Overview and Analysis |
6.1.2 Indonesia Bioactive Ingredients & Product Market Revenues & Volume, By Ingredient, 2022-2032F |
6.1.3 Indonesia Bioactive Ingredients & Product Market Revenues & Volume, By Probiotics, 2022-2032F |
6.1.4 Indonesia Bioactive Ingredients & Product Market Revenues & Volume, By Proteins, 2022-2032F |
6.1.5 Indonesia Bioactive Ingredients & Product Market Revenues & Volume, By Plant Extracts, 2022-2032F |
6.1.6 Indonesia Bioactive Ingredients & Product Market Revenues & Volume, By Minerals, 2022-2032F |
6.1.7 Indonesia Bioactive Ingredients & Product Market Revenues & Volume, By Vitamins, 2022-2032F |
6.1.8 Indonesia Bioactive Ingredients & Product Market Revenues & Volume, By Fibers, 2022-2032F |
6.2 Indonesia Bioactive Ingredients & Product Market, By Type |
6.2.1 Overview and Analysis |
6.2.2 Indonesia Bioactive Ingredients & Product Market Revenues & Volume, By Prebiotics, 2022-2032F |
6.2.3 Indonesia Bioactive Ingredients & Product Market Revenues & Volume, By Probiotics, 2022-2032F |
6.2.4 Indonesia Bioactive Ingredients & Product Market Revenues & Volume, By Amino acids, peptides & proteins, 2022-2032F |
6.2.5 Indonesia Bioactive Ingredients & Product Market Revenues & Volume, By Omega 3 & structured lipids, 2022-2032F |
6.2.6 Indonesia Bioactive Ingredients & Product Market Revenues & Volume, By Phytochemicals & plant extracts, 2022-2032F |
6.2.7 Indonesia Bioactive Ingredients & Product Market Revenues & Volume, By Minerals, 2022-2032F |
6.2.8 Indonesia Bioactive Ingredients & Product Market Revenues & Volume, By Fibers & specialty carbohydrates, 2022-2032F |
6.2.9 Indonesia Bioactive Ingredients & Product Market Revenues & Volume, By Fibers & specialty carbohydrates, 2022-2032F |
6.3 Indonesia Bioactive Ingredients & Product Market, By Application |
6.3.1 Overview and Analysis |
6.3.2 Indonesia Bioactive Ingredients & Product Market Revenues & Volume, By Functional food, 2022-2032F |
6.3.3 Indonesia Bioactive Ingredients & Product Market Revenues & Volume, By Functional beverages, 2022-2032F |
6.3.4 Indonesia Bioactive Ingredients & Product Market Revenues & Volume, By Dietary supplements, 2022-2032F |
6.3.5 Indonesia Bioactive Ingredients & Product Market Revenues & Volume, By Animal nutrition, 2022-2032F |
6.3.6 Indonesia Bioactive Ingredients & Product Market Revenues & Volume, By Personal care, 2022-2032F |
7 Indonesia Bioactive Ingredients & Product Market Import-Export Trade Statistics |
7.1 Indonesia Bioactive Ingredients & Product Market Export to Major Countries |
7.2 Indonesia Bioactive Ingredients & Product Market Imports from Major Countries |
8 Indonesia Bioactive Ingredients & Product Market Key Performance Indicators |
8.1 Number of new product launches containing bioactive ingredients |
8.2 Investment in research and development of innovative bioactive ingredients |
8.3 Adoption rate of bioactive ingredients by major food and beverage manufacturers |
9 Indonesia Bioactive Ingredients & Product Market - Opportunity Assessment |
9.1 Indonesia Bioactive Ingredients & Product Market Opportunity Assessment, By Ingredient, 2022 & 2032F |
9.2 Indonesia Bioactive Ingredients & Product Market Opportunity Assessment, By Type, 2022 & 2032F |
9.3 Indonesia Bioactive Ingredients & Product Market Opportunity Assessment, By Application, 2022 & 2032F |
10 Indonesia Bioactive Ingredients & Product Market - Competitive Landscape |
10.1 Indonesia Bioactive Ingredients & Product Market Revenue Share, By Companies, 2025 |
10.2 Indonesia Bioactive Ingredients & Product Market Competitive Benchmarking, By Operating and Technical Parameters |
11 Company Profiles |
12 Recommendations |
13 Disclaimer |
Global Go To Market Strategy - 2030
Export potential enables firms to identify high-growth global markets with greater confidence by combining advanced trade intelligence with a structured quantitative methodology. The framework analyzes emerging demand trends and country-level import patterns while integrating macroeconomic and trade datasets such as GDP and population forecasts, bilateral import–export flows, tariff structures, elasticity differentials between developed and developing economies, geographic distance, and import demand projections. Using weighted trade values from 2020–2024 as the base period to project country-to-country export potential for 2030, these inputs are operationalized through calculated drivers such as gravity model parameters, tariff impact factors, and projected GDP per-capita growth. Through an analysis of hidden potentials, demand hotspots, and market conditions that are most favorable to success, this method enables firms to focus on target countries, maximize returns, and global expansion with data, backed by accuracy.
By factoring in the projected importer demand gap that is currently unmet and could be potential opportunity, it identifies the potential for the Exporter (Country) among 190 countries, against the general trade analysis, which identifies the biggest importer or exporter.
To discover high-growth global markets and optimize your business strategy:
Click Here
Pricing
- Single User License$ 1,995
- Department License$ 2,400
- Site License$ 3,120
- Global License$ 3,795

Leadership Perspectives from Industry Events
Search
Thought Leadership and Analyst Meet


Our Clients
6WResearch In News
- India Export Attractiveness Tracker 2026
- India Air Conditioner Market Set for Strong Rebound in 2026 After Weather-Led Correction and GST-Driven Recovery: 6Wresearch
- ADAS in India: How Automatic Emergency Braking, Blind Spot Detection & Driver Monitoring are Transforming Road Safety
- Doha a strategic location for EV manufacturing hub: IPA Qatar
- Demand for luxury TVs surging in the GCC, says Samsung
- Empowering Growth: The Thriving Journey of Bangladesh’s Cable Industry
Latest Reports
- Nicaragua RPG Gaming Market (2026-2032)
- New Zealand RPG Gaming Market (2026-2032)
- Netherlands RPG Gaming Market (2026-2032)
- Nauru RPG Gaming Market (2026-2032)
- Namibia RPG Gaming Market (2026-2032)
- Mozambique RPG Gaming Market (2026-2032)
- Montenegro RPG Gaming Market (2026-2032)
- Mongolia RPG Gaming Market (2026-2032)
- Monaco RPG Gaming Market (2026-2032)
- Micronesia RPG Gaming Market (2026-2032)
Industry Events and Analyst Meet

EV India Expo 2026

HIMTEX 2026

India Refining Summit 2026

India EV Show 2026

EV tech India Expo 2026
Whitepaper
- Middle East & Africa Commercial Security Market Click here to view more.
- Middle East & Africa Fire Safety Systems & Equipment Market Click here to view more.
- GCC Drone Market Click here to view more.
- Middle East Lighting Fixture Market Click here to view more.
- GCC Physical & Perimeter Security Market Click here to view more.