United States (US) Bioactive Ingredients & Product Market (2026-2032) Outlook | Growth, Forecast, Industry, Analysis, Trends, Companies, Share, Revenue, Size, Value
Market Forecast By Ingredient (Probiotics, Proteins, Plant Extracts, Minerals, Vitamins, Fibers, Carotenoids), By Type (Prebiotics, Probiotics, Amino acids, peptides & proteins, Omega 3 & structured lipids, Phytochemicals & plant extracts, Minerals, Vitamins, Fibers & specialty carbohydrates), By Application (Functional food, Functional beverages, Dietary supplements, Animal nutrition, Personal care) And Competitive Landscape
| Product Code: ETC4600622 | Publication Date: Jul 2023 | Updated Date: Mar 2026 | Product Type: Report | |
| Publisher: 6Wresearch | Author: Ravi Bhandari | No. of Pages: 85 | No. of Figures: 45 | No. of Tables: 25 |
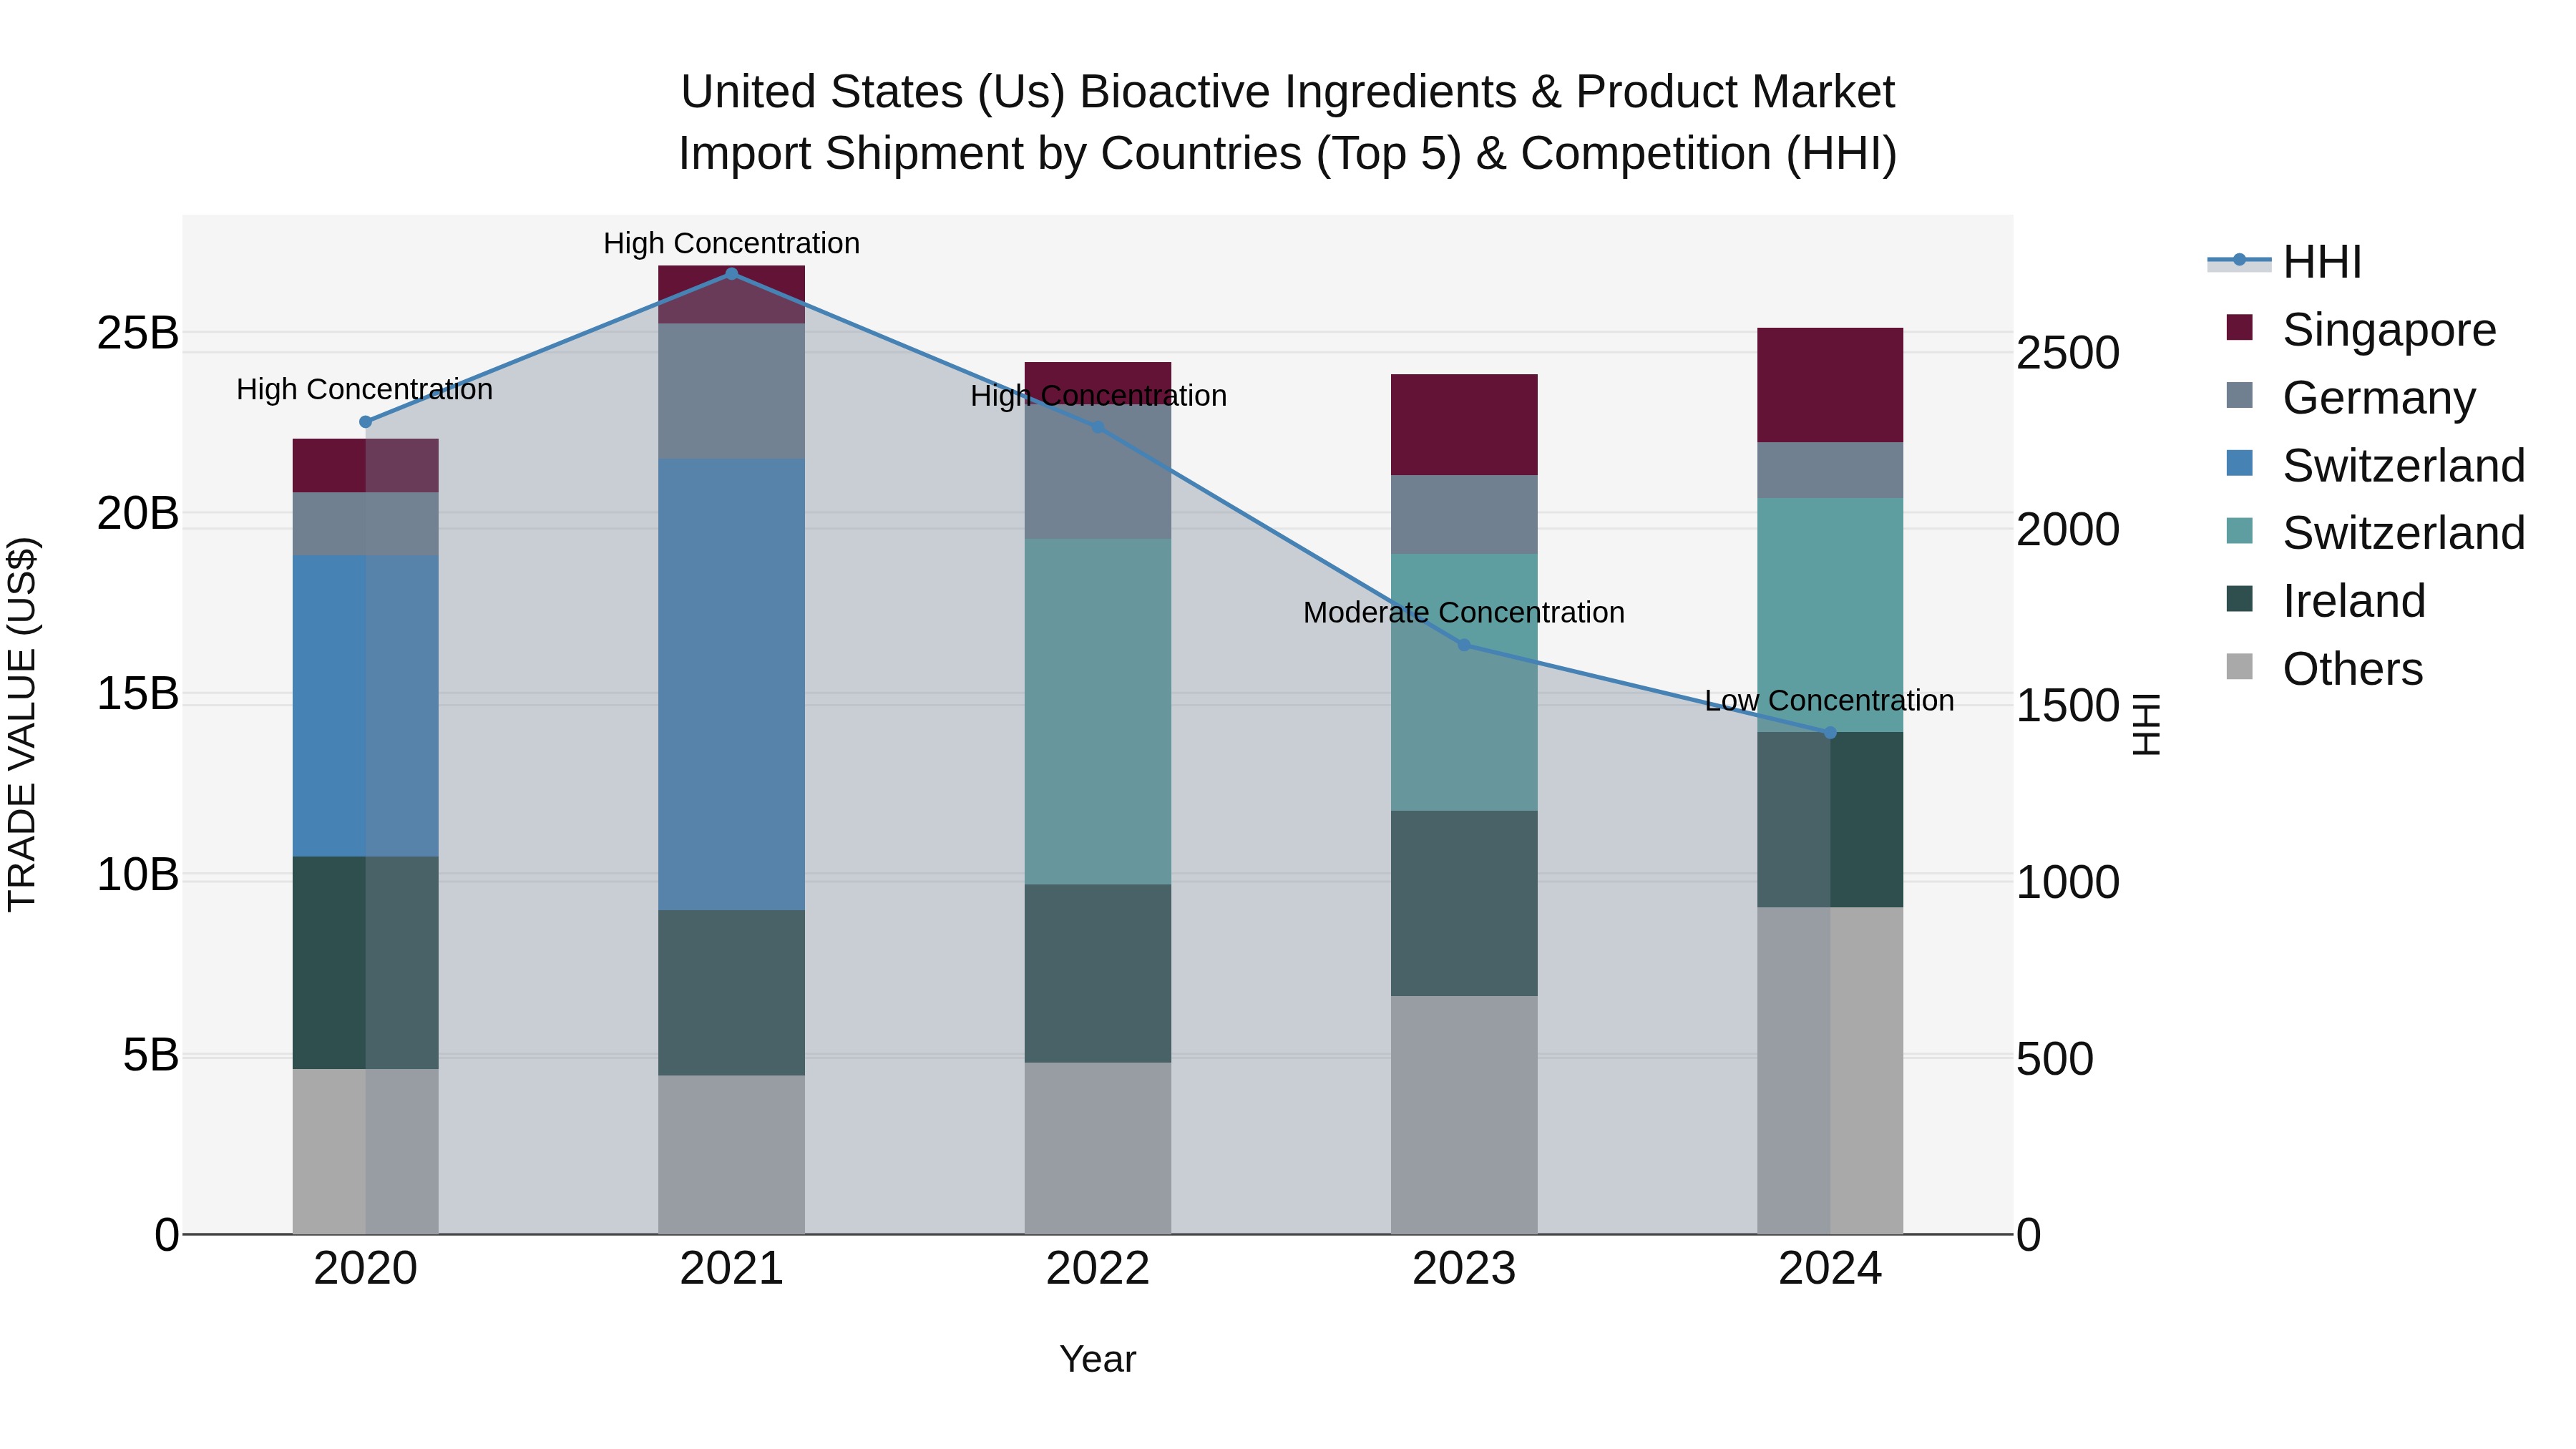
United States (US) Bioactive Ingredients & Product Market Top 5 Importing Countries and Market Competition (HHI) Analysis
The United States saw a diverse range of bioactive ingredients and products being imported in 2024, with Switzerland, Ireland, Singapore, India, and Germany emerging as the top exporting countries. The market displayed a shift towards lower concentration levels, indicating increased competition and variety in the market. With a healthy Compound Annual Growth Rate (CAGR) of 3.32% from 2020 to 2024 and a notable growth rate of 5.41% in 2024, the bioactive ingredients and products sector in the US is demonstrating promising expansion and opportunities for market players.
Key Highlights of the Report:
- United States (US) Bioactive Ingredients & Product Market Outlook
- Market Size of United States (US) Bioactive Ingredients & Product Market, 2025
- Forecast of United States (US) Bioactive Ingredients & Product Market, 2032
- Historical Data and Forecast of United States (US) Bioactive Ingredients & Product Revenues & Volume for the Period 2022 - 2032F
- United States (US) Bioactive Ingredients & Product Market Trend Evolution
- United States (US) Bioactive Ingredients & Product Market Drivers and Challenges
- United States (US) Bioactive Ingredients & Product Price Trends
- United States (US) Bioactive Ingredients & Product Porter's Five Forces
- United States (US) Bioactive Ingredients & Product Industry Life Cycle
- Historical Data and Forecast of United States (US) Bioactive Ingredients & Product Market Revenues & Volume By Ingredient for the Period 2022 - 2032F
- Historical Data and Forecast of United States (US) Bioactive Ingredients & Product Market Revenues & Volume By Probiotics for the Period 2022 - 2032F
- Historical Data and Forecast of United States (US) Bioactive Ingredients & Product Market Revenues & Volume By Proteins for the Period 2022 - 2032F
- Historical Data and Forecast of United States (US) Bioactive Ingredients & Product Market Revenues & Volume By Plant Extracts for the Period 2022 - 2032F
- Historical Data and Forecast of United States (US) Bioactive Ingredients & Product Market Revenues & Volume By Minerals for the Period 2022 - 2032F
- Historical Data and Forecast of United States (US) Bioactive Ingredients & Product Market Revenues & Volume By Vitamins for the Period 2022 - 2032F
- Historical Data and Forecast of United States (US) Bioactive Ingredients & Product Market Revenues & Volume By Fibers for the Period 2022 - 2032F
- Historical Data and Forecast of United States (US) Bioactive Ingredients & Product Market Revenues & Volume By Carotenoids for the Period 2022 - 2032F
- Historical Data and Forecast of United States (US) Bioactive Ingredients & Product Market Revenues & Volume By Type for the Period 2022 - 2032F
- Historical Data and Forecast of United States (US) Bioactive Ingredients & Product Market Revenues & Volume By Prebiotics for the Period 2022 - 2032F
- Historical Data and Forecast of United States (US) Bioactive Ingredients & Product Market Revenues & Volume By Probiotics for the Period 2022 - 2032F
- Historical Data and Forecast of United States (US) Bioactive Ingredients & Product Market Revenues & Volume By Amino acids, peptides & proteins for the Period 2022 - 2032F
- Historical Data and Forecast of United States (US) Bioactive Ingredients & Product Market Revenues & Volume By Omega 3 & structured lipids for the Period 2022 - 2032F
- Historical Data and Forecast of United States (US) Bioactive Ingredients & Product Market Revenues & Volume By Phytochemicals & plant extracts for the Period 2022 - 2032F
- Historical Data and Forecast of United States (US) Bioactive Ingredients & Product Market Revenues & Volume By Minerals for the Period 2022 - 2032F
- Historical Data and Forecast of United States (US) Bioactive Ingredients & Product Market Revenues & Volume By Vitamins for the Period 2022 - 2032F
- Historical Data and Forecast of United States (US) Bioactive Ingredients & Product Market Revenues & Volume By Fibers & specialty carbohydrates for the Period 2022 - 2032F
- Historical Data and Forecast of United States (US) Bioactive Ingredients & Product Market Revenues & Volume By Application for the Period 2022 - 2032F
- Historical Data and Forecast of United States (US) Bioactive Ingredients & Product Market Revenues & Volume By Functional food for the Period 2022 - 2032F
- Historical Data and Forecast of United States (US) Bioactive Ingredients & Product Market Revenues & Volume By Functional beverages for the Period 2022 - 2032F
- Historical Data and Forecast of United States (US) Bioactive Ingredients & Product Market Revenues & Volume By Dietary supplements for the Period 2022 - 2032F
- Historical Data and Forecast of United States (US) Bioactive Ingredients & Product Market Revenues & Volume By Animal nutrition for the Period 2022 - 2032F
- Historical Data and Forecast of United States (US) Bioactive Ingredients & Product Market Revenues & Volume By Personal care for the Period 2022 - 2032F
- United States (US) Bioactive Ingredients & Product Import Export Trade Statistics
- Market Opportunity Assessment By Ingredient
- Market Opportunity Assessment By Type
- Market Opportunity Assessment By Application
- United States (US) Bioactive Ingredients & Product Top Companies Market Share
- United States (US) Bioactive Ingredients & Product Competitive Benchmarking By Technical and Operational Parameters
- United States (US) Bioactive Ingredients & Product Company Profiles
- United States (US) Bioactive Ingredients & Product Key Strategic Recommendations
Frequently Asked Questions About the Market Study (FAQs):
6Wresearch actively monitors the United States (US) Bioactive Ingredients & Product Market and publishes its comprehensive annual report, highlighting emerging trends, growth drivers, revenue analysis, and forecast outlook. Our insights help businesses to make data-backed strategic decisions with ongoing market dynamics. Our analysts track relevent industries related to the United States (US) Bioactive Ingredients & Product Market, allowing our clients with actionable intelligence and reliable forecasts tailored to emerging regional needs.
Yes, we provide customisation as per your requirements. To learn more, feel free to contact us on sales@6wresearch.com
1 Executive Summary |
2 Introduction |
2.1 Key Highlights of the Report |
2.2 Report Description |
2.3 Market Scope & Segmentation |
2.4 Research Methodology |
2.5 Assumptions |
3 United States (US) Bioactive Ingredients & Product Market Overview |
3.1 United States (US) Country Macro Economic Indicators |
3.2 United States (US) Bioactive Ingredients & Product Market Revenues & Volume, 2022 & 2032F |
3.3 United States (US) Bioactive Ingredients & Product Market - Industry Life Cycle |
3.4 United States (US) Bioactive Ingredients & Product Market - Porter's Five Forces |
3.5 United States (US) Bioactive Ingredients & Product Market Revenues & Volume Share, By Ingredient, 2022 & 2032F |
3.6 United States (US) Bioactive Ingredients & Product Market Revenues & Volume Share, By Type, 2022 & 2032F |
3.7 United States (US) Bioactive Ingredients & Product Market Revenues & Volume Share, By Application, 2022 & 2032F |
4 United States (US) Bioactive Ingredients & Product Market Dynamics |
4.1 Impact Analysis |
4.2 Market Drivers |
4.2.1 Growing consumer awareness about health and wellness leading to increased demand for bioactive ingredients and products. |
4.2.2 Rising prevalence of chronic diseases such as diabetes, cardiovascular diseases, and obesity driving the need for functional foods and supplements. |
4.2.3 Shift towards natural and organic ingredients in food and beverage products, boosting the demand for bioactive ingredients. |
4.3 Market Restraints |
4.3.1 Stringent regulations and compliance requirements impacting the introduction of new bioactive ingredients and products. |
4.3.2 High research and development costs associated with creating innovative bioactive ingredients and products. |
5 United States (US) Bioactive Ingredients & Product Market Trends |
6 United States (US) Bioactive Ingredients & Product Market, By Types |
6.1 United States (US) Bioactive Ingredients & Product Market, By Ingredient |
6.1.1 Overview and Analysis |
6.1.2 United States (US) Bioactive Ingredients & Product Market Revenues & Volume, By Ingredient, 2022 - 2032F |
6.1.3 United States (US) Bioactive Ingredients & Product Market Revenues & Volume, By Probiotics, 2022 - 2032F |
6.1.4 United States (US) Bioactive Ingredients & Product Market Revenues & Volume, By Proteins, 2022 - 2032F |
6.1.5 United States (US) Bioactive Ingredients & Product Market Revenues & Volume, By Plant Extracts, 2022 - 2032F |
6.1.6 United States (US) Bioactive Ingredients & Product Market Revenues & Volume, By Minerals, 2022 - 2032F |
6.1.7 United States (US) Bioactive Ingredients & Product Market Revenues & Volume, By Vitamins, 2022 - 2032F |
6.1.8 United States (US) Bioactive Ingredients & Product Market Revenues & Volume, By Fibers, 2022 - 2032F |
6.2 United States (US) Bioactive Ingredients & Product Market, By Type |
6.2.1 Overview and Analysis |
6.2.2 United States (US) Bioactive Ingredients & Product Market Revenues & Volume, By Prebiotics, 2022 - 2032F |
6.2.3 United States (US) Bioactive Ingredients & Product Market Revenues & Volume, By Probiotics, 2022 - 2032F |
6.2.4 United States (US) Bioactive Ingredients & Product Market Revenues & Volume, By Amino acids, peptides & proteins, 2022 - 2032F |
6.2.5 United States (US) Bioactive Ingredients & Product Market Revenues & Volume, By Omega 3 & structured lipids, 2022 - 2032F |
6.2.6 United States (US) Bioactive Ingredients & Product Market Revenues & Volume, By Phytochemicals & plant extracts, 2022 - 2032F |
6.2.7 United States (US) Bioactive Ingredients & Product Market Revenues & Volume, By Minerals, 2022 - 2032F |
6.2.8 United States (US) Bioactive Ingredients & Product Market Revenues & Volume, By Fibers & specialty carbohydrates, 2022 - 2032F |
6.2.9 United States (US) Bioactive Ingredients & Product Market Revenues & Volume, By Fibers & specialty carbohydrates, 2022 - 2032F |
6.3 United States (US) Bioactive Ingredients & Product Market, By Application |
6.3.1 Overview and Analysis |
6.3.2 United States (US) Bioactive Ingredients & Product Market Revenues & Volume, By Functional food, 2022 - 2032F |
6.3.3 United States (US) Bioactive Ingredients & Product Market Revenues & Volume, By Functional beverages, 2022 - 2032F |
6.3.4 United States (US) Bioactive Ingredients & Product Market Revenues & Volume, By Dietary supplements, 2022 - 2032F |
6.3.5 United States (US) Bioactive Ingredients & Product Market Revenues & Volume, By Animal nutrition, 2022 - 2032F |
6.3.6 United States (US) Bioactive Ingredients & Product Market Revenues & Volume, By Personal care, 2022 - 2032F |
7 United States (US) Bioactive Ingredients & Product Market Import-Export Trade Statistics |
7.1 United States (US) Bioactive Ingredients & Product Market Export to Major Countries |
7.2 United States (US) Bioactive Ingredients & Product Market Imports from Major Countries |
8 United States (US) Bioactive Ingredients & Product Market Key Performance Indicators |
8.1 Number of new product launches incorporating bioactive ingredients in the US market. |
8.2 Growth rate of the health and wellness industry in the US. |
8.3 Consumer awareness and perception surveys regarding bioactive ingredients and products in the US. |
9 United States (US) Bioactive Ingredients & Product Market - Opportunity Assessment |
9.1 United States (US) Bioactive Ingredients & Product Market Opportunity Assessment, By Ingredient, 2022 & 2032F |
9.2 United States (US) Bioactive Ingredients & Product Market Opportunity Assessment, By Type, 2022 & 2032F |
9.3 United States (US) Bioactive Ingredients & Product Market Opportunity Assessment, By Application, 2022 & 2032F |
10 United States (US) Bioactive Ingredients & Product Market - Competitive Landscape |
10.1 United States (US) Bioactive Ingredients & Product Market Revenue Share, By Companies, 2025 |
10.2 United States (US) Bioactive Ingredients & Product Market Competitive Benchmarking, By Operating and Technical Parameters |
11 Company Profiles |
12 Recommendations |
13 Disclaimer |
Global Go To Market Strategy - 2030
Export potential enables firms to identify high-growth global markets with greater confidence by combining advanced trade intelligence with a structured quantitative methodology. The framework analyzes emerging demand trends and country-level import patterns while integrating macroeconomic and trade datasets such as GDP and population forecasts, bilateral import–export flows, tariff structures, elasticity differentials between developed and developing economies, geographic distance, and import demand projections. Using weighted trade values from 2020–2024 as the base period to project country-to-country export potential for 2030, these inputs are operationalized through calculated drivers such as gravity model parameters, tariff impact factors, and projected GDP per-capita growth. Through an analysis of hidden potentials, demand hotspots, and market conditions that are most favorable to success, this method enables firms to focus on target countries, maximize returns, and global expansion with data, backed by accuracy.
By factoring in the projected importer demand gap that is currently unmet and could be potential opportunity, it identifies the potential for the Exporter (Country) among 190 countries, against the general trade analysis, which identifies the biggest importer or exporter.
To discover high-growth global markets and optimize your business strategy:
Click Here
Pricing
- Single User License$ 1,995
- Department License$ 2,400
- Site License$ 3,120
- Global License$ 3,795

Leadership Perspectives from Industry Events
Search
Thought Leadership and Analyst Meet


Our Clients
6WResearch In News
- Doha a strategic location for EV manufacturing hub: IPA Qatar
- Demand for luxury TVs surging in the GCC, says Samsung
- Empowering Growth: The Thriving Journey of Bangladesh’s Cable Industry
- Demand for luxury TVs surging in the GCC, says Samsung
- Video call with a traditional healer? Once unthinkable, it’s now common in South Africa
- Intelligent Buildings To Smooth GCC’s Path To Net Zero
Latest Reports
- New Zealand Aseptic Manufacturing Market (2026-2032)
- Netherlands Aseptic Manufacturing Market (2026-2032)
- Nauru Aseptic Manufacturing Market (2026-2032)
- Namibia Aseptic Manufacturing Market (2026-2032)
- Mozambique Aseptic Manufacturing Market (2026-2032)
- Montenegro Aseptic Manufacturing Market (2026-2032)
- Mongolia Aseptic Manufacturing Market (2026-2032)
- Monaco Aseptic Manufacturing Market (2026-2032)
- Micronesia Aseptic Manufacturing Market (2026-2032)
- Mauritius Aseptic Manufacturing Market (2026-2032)
Industry Events and Analyst Meet

HIMTEX 2026

India Refining Summit 2026

India EV Show 2026

EV tech India Expo 2026

Auto Tech Asia 2026
Whitepaper
- Middle East & Africa Commercial Security Market Click here to view more.
- Middle East & Africa Fire Safety Systems & Equipment Market Click here to view more.
- GCC Drone Market Click here to view more.
- Middle East Lighting Fixture Market Click here to view more.
- GCC Physical & Perimeter Security Market Click here to view more.